mPINC 2022 Regional Report
Download report PDF-343KB, mPINC State and Regional Scores [XLSX-23KB]
mPINC™ is CDC’s national survey of Maternity Practices in Infant Nutrition and Care. The survey measures care practices and policies that impact newborn feeding, feeding education, staff skills, and discharge support. CDC invites all hospitals with maternity services in the U.S. and territories to participate. In 2022, 1994 of 2779 eligible hospitals participated (72%). Total scores for states ranged from 72 to 93 out of 100, with a national score of 81.
mPINC Total and Subdomain Scoresa, by Region and State, 2022
| Regionb | Participation of Eligible Hospitals | Total | Immediate Postpartum Care | Rooming-In | Feeding Practices | Feeding Education & Support | Discharge Support | Institutional Management |
|---|---|---|---|---|---|---|---|---|
| United States | 72% (1994 of 2779) | 81 | 84 | 76 | 81 | 94 | 78 | 76 |
| Northeast | 86 | 88 | 80 | 83 | 96 | 86 | 83 | |
| Connecticut [PDF-218KB] | 67% (16 of 24) | 87 | 87 | 73 | 84 | 97 | 89 | 91 |
| Maine [PDF-282KB] | 92% (23 of 25) | 85 | 86 | 71 | 88 | 97 | 87 | 83 |
| Massachusetts [PDF-284KB] | 93% (37 of 40) | 88 | 93 | 86 | 82 | 96 | 86 | 83 |
| New Hampshire [PDF-284KB] | 88% (14 of 16) | 91 | 95 | 86 | 92 | 98 | 93 | 81 |
| New York [PDF-243KB] | 70% (83 of 119) | 85 | 84 | 79 | 80 | 95 | 85 | 84 |
| Vermont [PDF-269KB] | 91% (10 of 11) | 87 | 90 | 87 | 92 | 97 | 83 | 74 |
| Western | 85 | 89 | 82 | 85 | 95 | 80 | 78 | |
| Alaska [PDF-243KB] | 79% (15 of 19) | 82 | 88 | 80 | 88 | 95 | 72 | 70 |
| California [PDF-246KB] | 68% (152 of 225) | 87 | 89 | 83 | 85 | 96 | 81 | 87 |
| Hawaii [PDF-242KB] | 83% (10 of 12) | 75 | 87 | 71 | 81 | 89 | 55 | 65 |
| Idaho [PDF-269KB] | 80% (24 of 30) | 77 | 84 | 68 | 82 | 91 | 75 | 60 |
| Nevada [PDF-267KB] | 44% (8 of 18) | 79 | 81 | 78 | 73 | 92 | 78 | 71 |
| Oregon [PDF-269KB] | 63% (30 of 48) | 87 | 91 | 84 | 89 | 96 | 92 | 72 |
| Washington [PDF-231KB] | 62% (36 of 58) | 86 | 91 | 86 | 91 | 95 | 84 | 69 |
| Mid-Atlantic | 82 | 84 | 75 | 80 | 95 | 79 | 79 | |
| Delaware [PDF-217KB] | 71% (5 of 7) | 93 | 93 | 83 | 90 | 100 | 95 | 98 |
| Maryland [PDF-282KB] | 78% (25 of 32) | 82 | 84 | 78 | 80 | 96 | 72 | 83 |
| New Jersey [PDF-306KB] | 83% (40 of 48) | 85 | 86 | 73 | 78 | 97 | 86 | 86 |
| Pennsylvania [PDF-269KB] | 83% (67 of 81) | 82 | 88 | 75 | 82 | 94 | 77 | 74 |
| Puerto Rico [PDF-269KB] | 40% (12 of 30) | 73 | 59 | 74 | 58 | 94 | 79 | 76 |
| Virginia | 55% (30 of 55) | 81 | 84 | 71 | 83 | 96 | 73 | 77 |
| West Virginia [PDF-231KB] | 76% (16 of 21) | 81 | 75 | 79 | 78 | 95 | 84 | 75 |
| Midwest | 81 | 85 | 72 | 82 | 94 | 78 | 74 | |
| Illinois [PDF-269KB] | 68% (65 of 95) | 80 | 81 | 80 | 79 | 93 | 76 | 74 |
| Indiana [PDF-269KB] | 88% (74 of 84) | 83 | 81 | 73 | 85 | 96 | 80 | 81 |
| Iowa [PDF-219KB] | 93% (53 of 57) | 73 | 83 | 58 | 80 | 93 | 69 | 56 |
| Michigan [PDF-282KB] | 73% (58 of 79) | 80 | 85 | 71 | 78 | 93 | 76 | 78 |
| Minnesota [PDF-282KB] | 68% (55 of 81) | 81 | 86 | 74 | 83 | 90 | 82 | 72 |
| Ohio [PDF-269KB] | 84% (81 of 97) | 84 | 88 | 78 | 81 | 96 | 81 | 80 |
| Wisconsin [PDF-230KB] | 74% (64 of 86) | 82 | 88 | 68 | 86 | 96 | 79 | 73 |
| Mountain Plains | 80 | 84 | 74 | 82 | 94 | 79 | 69 | |
| Colorado [PDF-218KB] | 71% (41 of 58) | 86 | 87 | 85 | 87 | 95 | 81 | 85 |
| Kansas [PDF-285KB] | 82% (47 of 57) | 82 | 87 | 73 | 86 | 96 | 81 | 68 |
| Missouri [PDF-281KB] | 78% (47 of 60) | 80 | 82 | 76 | 79 | 95 | 80 | 70 |
| Montana [PDF-281KB] | 81% (21 of 26) | 86 | 89 | 78 | 95 | 97 | 82 | 75 |
| Nebraska [PDF-282KB] | 94% (46 of 49) | 74 | 82 | 67 | 75 | 89 | 76 | 55 |
| North Dakota [PDF-282KB] | 58% (7 of 12) | 79 | 79 | 63 | 80 | 91 | 79 | 80 |
| South Dakota [PDF-270KB] | 65% (13 of 20) | 73 | 78 | 65 | 82 | 92 | 67 | 51 |
| Wyoming | 45% (9 of 20) | 75 | 82 | 68 | 73 | 87 | 72 | 65 |
| Southwest | 80 | 82 | 76 | 77 | 93 | 75 | 77 | |
| Arizona [PDF-219KB] | 48% (20 of 42) | 77 | 78 | 83 | 71 | 91 | 71 | 69 |
| Arkansas [PDF-244KB] | 64% (25 of 39) | 76 | 79 | 71 | 68 | 95 | 71 | 71 |
| Louisiana [PDF-285KB] | 92% (46 of 50) | 82 | 80 | 76 | 77 | 96 | 79 | 82 |
| New Mexico [PDF-282KB] | 63% (19 of 30) | 88 | 91 | 80 | 88 | 94 | 87 | 85 |
| Oklahoma [PDF-270KB] | 64% (29 of 45) | 85 | 89 | 81 | 82 | 97 | 82 | 82 |
| Texas [PDF-269KB] | 67% (148 of 220) | 80 | 81 | 76 | 76 | 92 | 75 | 78 |
| Utah [PDF-269KB] | 78% (35 of 45) | 77 | 86 | 70 | 78 | 92 | 68 | 70 |
| Southeast | 79 | 78 | 75 | 76 | 95 | 73 | 75 | |
| Alabama [PDF-220KB] | 78% (36 of 46) | 73 | 70 | 64 | 77 | 95 | 67 | 65 |
| Florida [PDF-219KB] | 60% (66 of 110) | 83 | 84 | 84 | 80 | 94 | 74 | 80 |
| Georgia [PDF-218KB] | 51% (38 of 75) | 78 | 81 | 70 | 75 | 94 | 73 | 76 |
| Kentucky [PDF-285KB] | 74% (35 of 47) | 74 | 79 | 68 | 71 | 95 | 68 | 67 |
| Mississippi [PDF-281KB] | 80% (33 of 41) | 82 | 84 | 77 | 71 | 96 | 74 | 91 |
| North Carolina [PDF-282KB] | 74% (56 of 76) | 82 | 80 | 82 | 78 | 95 | 80 | 78 |
| South Carolina [PDF-269KB] | 61% (23 of 38) | 80 | 76 | 74 | 77 | 96 | 79 | 79 |
| Tennessee [PDF-269KB] | 76% (45 of 59) | 72 | 64 | 67 | 74 | 94 | 68 | 67 |
| a Total and subdomain scores may be impacted by the proportion of participating hospitals in each state; response rates should be considered when interpreting results.
b Data are not reported for the District of Columbia (Mid-Atlantic Region), Rhode Island (Northeast Region), Guam (Western Region), the U.S. Virgin Islands (Northeast Region), American Samoa (Western Region), and the Northern Mariana Islands (Western Region), due to small sample size. Scores from participating hospitals in these states and territories are included in the regional and national-level scores. Regions are listed in descending order by total score and states are listed in alphabetical order within each region. Regions are defined by the U.S. Department of Agriculture’s Food and Nutrition Service. |
||||||||
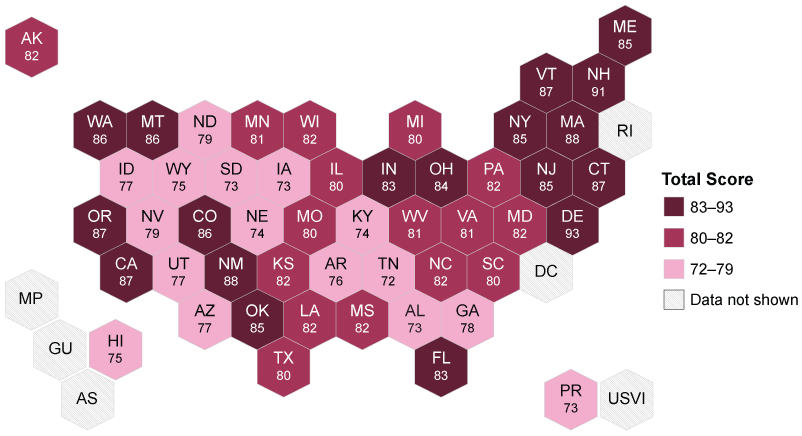
Maternity Practices in Infant Nutrition and Care (mPINC) Total Scores, by State, 2022

Figure Details: The ranges for mPINC total score are categorized by tertiles. State-level scores were not reported for the District of Columbia, Rhode Island, Guam, the U.S. Virgin Islands, American Samoa, and the Northern Mariana Islands due to small sample size.
Regions are defined by the U.S. Department of Agriculture’s Food and Nutrition Service.
About the Maternity Practices in Infant Nutrition and Care (mPINC)™ trademark: The mPINC trademark (word and logo) are owned by the U.S. Department of Health and Human Services in the United States. An organization’s participation in CDC’s mPINC survey does not imply endorsement by the U.S. Department of Health and Human Services or the Centers for Disease Control and Prevention.
Suggested Citation: Centers for Disease Control and Prevention. 2022 State Scores by Region, CDC Survey of Maternity Care Practices in Infant Nutrition and Care. Atlanta, GA. 2023.
CS 329909A 06/05/2023

