Learn how CDC's PLACES data can help improve your health efforts.
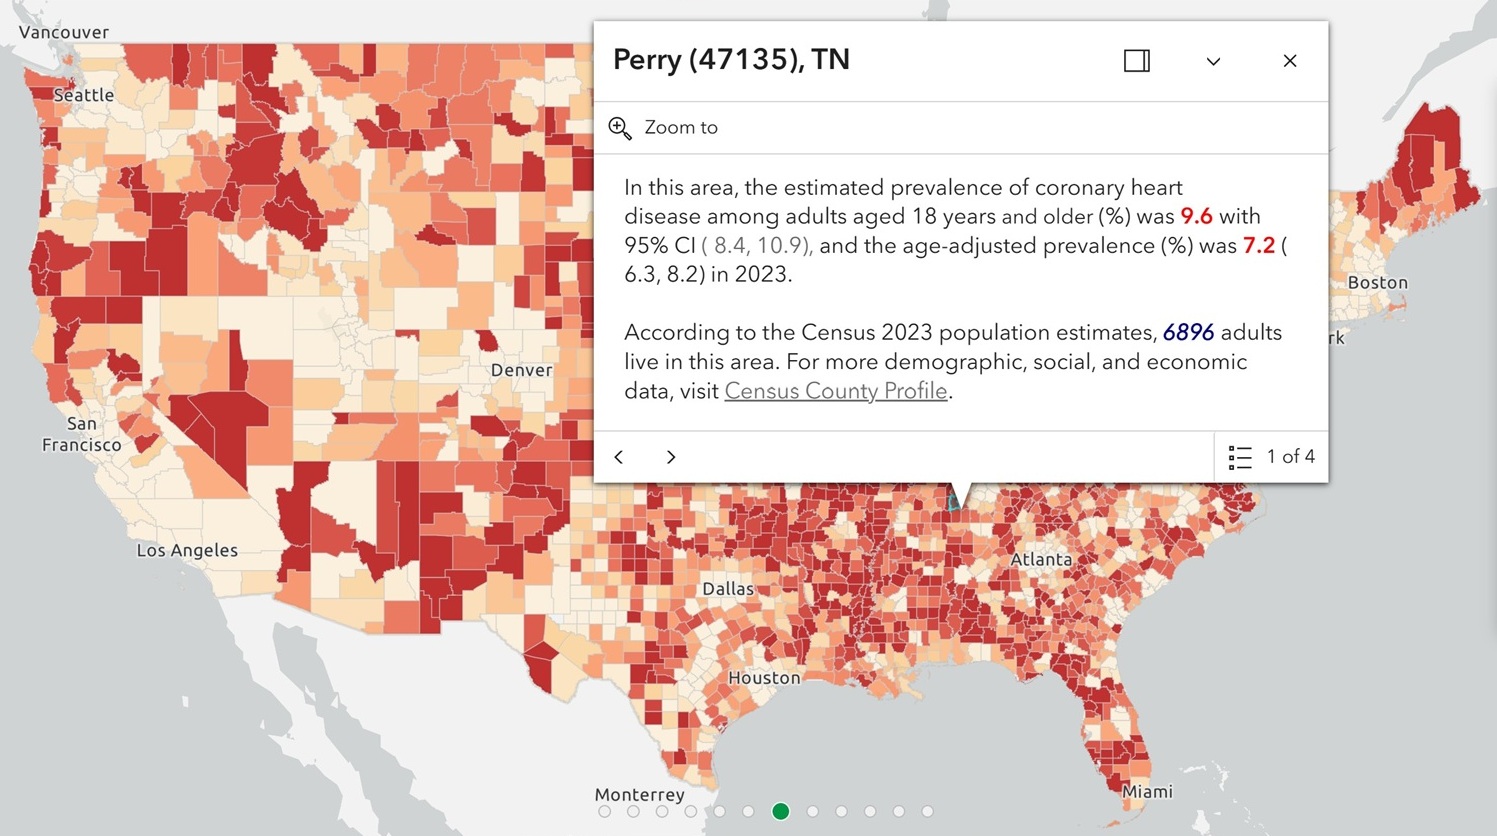
Use the original PLACES map to customize your own map that displays PLACES data.

Use this Portal to search and download PLACES datasets from current and prior data releases.
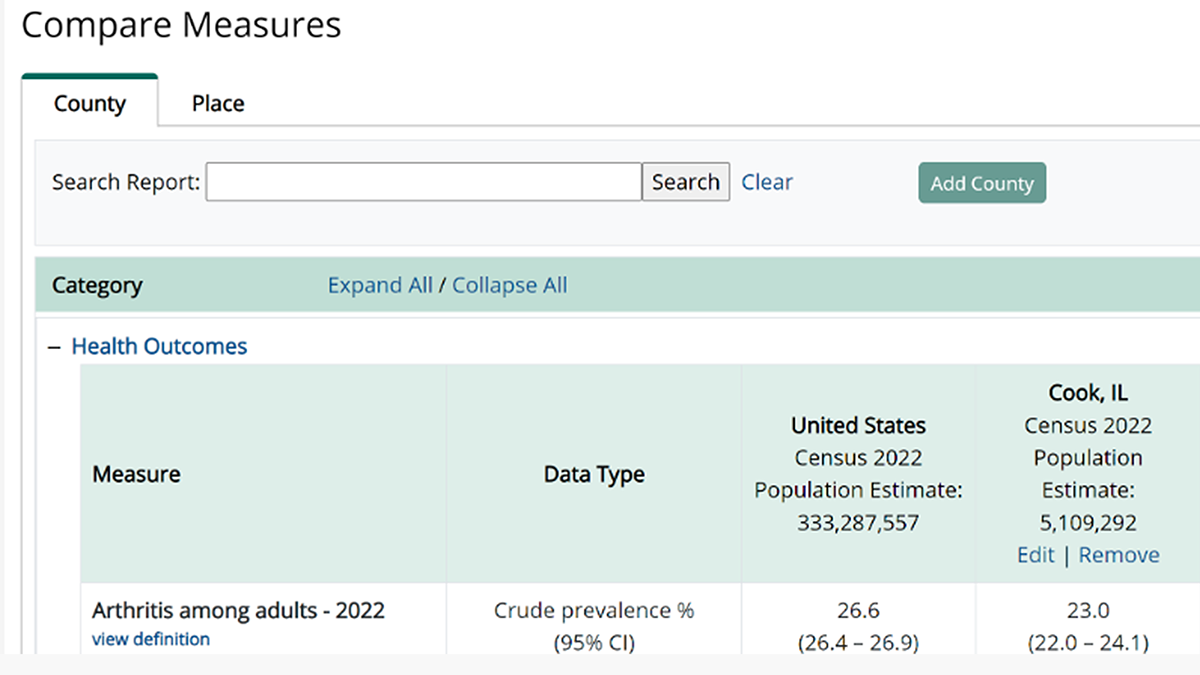
Use this tool to compare PLACES measures for up to 3 counties or places.
Behind the Data

Read important notes from the latest PLACES release (August 2024).
Learn more about the set of public health indicators that make up the CDC PLACES data measures.

Learn how PLACES uses CDC and U.S. Census data to estimate local health metrics.
PLACES and 500 Cities Data
Access current PLACES data by county, place, census tract, and ZIP Code tabulation area.
Access and download local data from 2016-2019 CDC's 500 Cities project (precursor to PLACES).