

Chlamydia Screening Percentages Reported by Commercial and Medicaid Plans by State and Year
 ShareCompartir
Table: Percentage of sexually active female enrollees aged 16-25 years* who were screened for Chlamydia trachomatis infection by state and year – Healthcare Effectiveness Data and Information Set (HEDIS), United States, 2000-2008†
| State | No. of health plans reporting in 2008 | No. of sexually active enrollees in 2008 | Year | ||||
|---|---|---|---|---|---|---|---|
| 2000 | 2002 | 2004 | 2006 | 2008 | |||
| United States | 585 | 2,759,814 | 25.4 | 29.8 | 38.2 | 43.5 | 44.7 |
| Alabama | 4 | -- | -- | -- | -- | -- | -- |
| Alaska | 1 | -- | -- | -- | -- | -- | -- |
| Arizona | 11 | 43,381 | 27.0 | 25.0 | 38.5 | 42.6 | 43.6 |
| Arkansas | 5 | 6,258 | -- | -- | -- | -- | 27.6 |
| California | 41 | 395,606 | 32.2 | 38.7 | 47.3 | 52.9 | 52.2 |
| Colorado | 13 | 43,838 | 27.6 | 29.6 | 43.9 | 42.3 | 46.8 |
| Connecticut | 14 | 54,321 | 24.4 | 32.6 | 40.0 | 46.1 | 51.4 |
| Delaware | 11 | 16,382 | 20.5 | 28.4 | 35.1 | 37.6 | 49.6 |
| District of Columbia | 5 | 3,467 | 37.6 | 39.7 | 50.3 | 52.6 | 73.2 |
| Florida | 29 | 115,950 | 24.7 | 19.4 | 29.8 | 37.5 | 43.8 |
| Georgia | 12 | 71,814 | 31.1 | 33.5 | 39.4 | 43.3 | 42.1 |
| Hawaii | 6 | 13,884 | -- | 47.0 | -- | -- | 56.2 |
| Idaho | 8 | 36,497 | -- | 25.0 | -- | 27.2 | 33.6 |
| Illinois | 19 | 79,627 | 16.1 | 19.4 | 26.3 | 31.3 | 35.2 |
| Indiana | 17 | 75,278 | 17.9 | 20.8 | 31.1 | 38.0 | 34.9 |
| Iowa | 13 | 37,446 | 19.8 | 20.2 | 26.0 | 29.4 | 34.5 |
| Kansas | 13 | 41,252 | 17.7 | 20.7 | 23.3 | 29.7 | 36.8 |
| Kentucky | 6 | 26,035 | 19.5 | 22.9 | 30.7 | 35.5 | 36.3 |
| Louisiana | 6 | 16,279 | -- | -- | -- | -- | 32.0 |
| Maine | 6 | 11,835 | 26.0 | 27.1 | -- | 43.7 | 39.5 |
| Maryland | 18 | 89,578 | 32.5 | 39.7 | 48.5 | 50.2 | 50.5 |
| Massachusetts | 18 | 119,259 | 21.5 | 34.1 | 44.8 | 51.3 | 57.1 |
| Michigan | 25 | 86,962 | 30.6 | 33.4 | 40.6 | 44.9 | 50.1 |
| Minnesota | 16 | 60,039 | 19.2 | 29.1 | 31.0 | 40.2 | 47.6 |
| Mississippi | 4 | -- | -- | -- | -- | -- | -- |
| Missouri | 12 | 28,771 | 17.3 | 30.3 | 42.3 | 41.4 | 37.1 |
| Montana | 2 | -- | -- | -- | -- | -- | -- |
| Nebraska | 3 | -- | -- | -- | -- | -- | -- |
| Nevada | 7 | 11,205 | -- | 29.1 | 37.0 | 47.8 | 46.1 |
| New Hampshire | 5 | 10,965 | -- | 28.2 | 36.2 | 42.9 | 46.3 |
| New Jersey | 21 | 113,346 | 16.0 | 16.7 | 31.9 | 38.6 | 46.2 |
| New Mexico | 12 | 28,431 | 37.3 | 32.6 | 35.5 | 44.6 | 48.7 |
| New York | 35 | 237,473 | 27.5 | 31.6 | 40.1 | 47.3 | 51.2 |
| North Carolina | 7 | 54,680 | 19.7 | 21.6 | 28.1 | 34.7 | 36.2 |
| North Dakota | 2 | -- | -- | -- | -- | -- | -- |
| Ohio | 22 | 166,659 | 24.7 | 33.3 | 34.5 | 34.3 | 37.4 |
| Oklahoma | 7 | 10,799 | 10.6 | 15.4 | -- | -- | 28.2 |
| Oregon | 9 | 31,790 | 34.5 | 40.5 | -- | 39.6 | 39.9 |
| Pennsylvania | 22 | 152,381 | 19.8 | 24.3 | 30.4 | 37.9 | 45.2 |
| Rhode Island‡ | 7 | 12,729 | 39.9 | 37.2 | 44.4 | 44.5 | -- |
| South Carolina | 7 | 14,299 | 19.0 | 21.2 | 24.7 | 26.8 | 33.6 |
| South Dakota | 0 | -- | -- | -- | -- | -- | -- |
| Tennessee | 15 | 94,143 | 19.2 | 20.3 | 40.3 | 42.7 | 39.7 |
| Texas | 25 | 145,902 | 20.9 | 24.6 | 32.2 | 35.7 | 38.2 |
| Utah | 6 | 6,938 | -- | 14.2 | 17.7 | 19.6 | 26.5 |
| Vermont‡ | 5 | 8,194 | -- | -- | -- | 41.4 | -- |
| Virginia | 12 | 82,577 | 29.1 | 32.4 | 36.7 | 43.5 | 39.7 |
| Washington | 47 | 38,302 | 33.3 | 35.4 | 43.5 | 47.5 | 40.5 |
| West Virginia | 6 | 6,151 | -- | -- | 30.3 | 35.8 | 34.1 |
| Wisconsin | 21 | 54,302 | 30.7 | 28.4 | 34.2 | 40.2 | 41.8 |
| Wyoming | 1 | -- | -- | -- | -- | -- | -- |
* Age range for data collected by year: 16-26 for 2000/2002; 16-25 for 2004/2006; 16-24 for 2008
† Data not available for states with less than 5 participating health plans
‡ Number of health plans reporting/Number of sexually active enrollees reported for 2006
Figure. Percentage of sexually active female enrollees aged 16-25 years* who were screened for Chlamydia trachomatis infection, by health plan type and year - Healthcare Effectiveness Data and Information Set, United States, 2000-2008
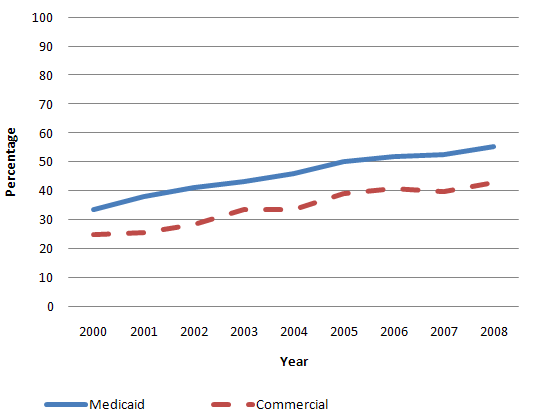
* Age range for data collected by year: 16-26 for 2000-2002; 16-25 for 2003-2007; 16-24 for 2008
Error processing SSI file
Error processing SSI file
Error processing SSI file
- Page last reviewed: September 13, 2010
- Page last updated: May 19, 2011
- Content source:
Error processing SSI file
Error processing SSI file