Assisted Reproductive Technology Surveillance — United States, 2013
Division of Reproductive Health, National Center for Chronic Disease Prevention and Health Promotion, CDC
Corresponding author: Saswati Sunderam, Division of Reproductive Health, National Center for Chronic Disease Prevention and Health Promotion. Telephone: 770-488-6356; E-mail: msunderam@cdc.gov.
Abstract
Problem/Condition: Since the first U.S. infant conceived with assisted reproductive technology (ART) was born in 1981, both the use of ART and the number of fertility clinics providing ART services have increased steadily in the United States. ART includes fertility treatments in which eggs or embryos are handled in the laboratory (i.e., in vitro fertilization [IVF] and related procedures). Women who undergo ART procedures are more likely than women who conceive naturally to deliver multiple-birth infants. Multiple births pose substantial risks to both mothers and infants, including obstetric complications, preterm delivery, and low birthweight infants. This report provides state-specific information for the United States (including Puerto Rico) on ART procedures performed in 2013 and compares infant outcomes that occurred in 2013 (resulting from ART procedures performed in 2012 and 2013) with outcomes for all infants born in the United States in 2013.
Reporting Period Covered: 2013.
Description of System: In 1996, CDC began collecting data on ART procedures performed in fertility clinics in the United States as mandated by the Fertility Clinic Success Rate and Certification Act of 1992 (FCSRCA) (Public Law 102–493). Data are collected through the National ART Surveillance System (NASS), a web-based data collection system developed by CDC. This report includes data from 52 reporting areas (the 50 states, the District of Columbia [DC], and Puerto Rico).
Results: In 2013, a total of 160,521 ART procedures (range: 109 in Wyoming to 20,299 in California) with the intent to transfer at least one embryo were performed in 467 U.S. fertility clinics and were reported to CDC. These procedures resulted in 53,252 live-birth deliveries (range: 47 in Alaska to 6,979 in California) and 66,691 infants (range: 61 in Alaska to 8,649 in California). Nationally, the total number of ART procedures performed per million women of reproductive age (15–44 years), a proxy measure of the ART usage rate, was 2,521 (range: 352 in Puerto Rico to 7,688 in DC). ART use exceeded the national rate in 13 reporting areas (California, Connecticut, Delaware, Hawaii, Illinois, Maryland, Massachusetts, New Hampshire, New Jersey, New York, Rhode Island, Virginia, and DC).
Nationally, among ART transfer procedures in patients using fresh embryos from their own eggs, the average number of embryos transferred increased with increasing age of the woman (1.8 among women aged <35 years, 2.0 among women aged 35–37 years, and 2.5 among women aged >37 years). Among women aged <35 years, who typically are considered to be good candidates for elective single embryo transfer (eSET) procedures, the national eSET rate was 21.4% (range: 4.0% in Idaho to 77.5% in Delaware).
In 2013, ART contributed to 1.6% of all infants born in the United States (range: 0.2% in Puerto Rico to 4.8% in Massachusetts) and 18.7% of all multiple-birth infants (range: 4.5% in Puerto Rico to 35.7% in Massachusetts), including 18.5% of all twin infants (range: 4.5% in Mississippi to 35.3% in Massachusetts) and 25.2% of all triplet and higher-order infants (range: 0% in several reporting areas to 51.5% in New Jersey). Multiple-birth deliveries were higher among infants conceived with ART (41.1%; range: 20.4% in Delaware to 61.6% in Wyoming) than among all infants born in the total birth population (only 3.5%; range: 1.8% in Puerto Rico to 4.5% in Massachusetts and New Jersey). Approximately 39% of ART-conceived infants were twin infants, and 2% were triplet and higher-order infants. ART-conceived twins accounted for approximately 95.4% of all ART-conceived infants born in multiple deliveries.
Nationally, infants conceived with ART contributed to 5.8% of all low birthweight (<2,500 grams) infants (range: 0.9% in Puerto Rico to 15.1% in Massachusetts). Among ART-conceived infants, 29.1% were low birthweight (range: 18.3% in Delaware to 42.6% in Louisiana), compared with 8.0% among all infants (range: 5.8% in Alaska to 11.5% in Mississippi).
ART-conceived infants contributed to 4.6% of all preterm (<37 weeks) infants (range: 0.6% in Puerto Rico to 13.3% in Massachusetts). Preterm birth rates were higher among infants conceived with ART (33.6%; range: 22.3% in DC to 50.7% in Louisiana) than among all infants born in the total birth population (11.4%; range: 8.8% in California to 16.6% in Mississippi).
The percentage of ART-conceived infants who were low birthweight was 9.0% (range: 5.1% in Mississippi to 19.7% in Puerto Rico) among singletons and 56.3% (range: 48.3% in Maine to 72.4% in Puerto Rico) among twins; the corresponding percentages among all infants born were 6.3% for singletons (range: 4.6% in Alaska to 9.6% in Mississippi and Puerto Rico) and 55.3% for twins (range: 43.6% in Alaska to 65.6% in Mississippi).
The percentage of ART-conceived infants who were preterm varied from 13.3% (range: 8.7% in Rhode Island to 26.9% in West Virginia) among singletons to 61.0% (range: 47.8% in DC to 78.8% in Oklahoma) among twins; the corresponding percentages among all infants were 10.1% for singletons (range: 6.8% in Vermont to 14.8% in Mississippi) and 56.6% for twins (range: 44.7% in New Hampshire to 68.9% in Louisiana).
Interpretation: The percentage of infants conceived with ART varied considerably by reporting area. In most reporting areas, multiple births from ART contributed to a substantial proportion of all twins, triplets, and higher-order infants born, and the low birthweight and preterm infant birth rates were disproportionately higher among ART-conceived infants than among the overall birth population. Although women aged <35 years are typically considered good candidates for eSET, on average two embryos were transferred per ART procedure with women in this group, increasing the overall multiple-birth rates in the United States. Compared with ART-conceived singletons, ART-conceived twins were approximately four-and-a-half times more likely to be born preterm, and approximately six times more likely to be born with low birthweight. Singleton infants conceived with ART had slightly higher rates of preterm delivery and low birthweight than all singleton infants born in the United States. ART use per population unit was geographically variable, with 13 reporting areas showing ART use above the national rate. Of the four states (Illinois, Massachusetts, New Jersey, and Rhode Island) with comprehensive statewide-mandated health insurance coverage for ART procedures (i.e., coverage for at least four cycles of IVF), two states (Massachusetts and New Jersey) had rates of ART use exceeding twice the national level. This type of mandated insurance has been associated with greater use of ART and likely accounts for some of the difference in per capita ART use observed among states.
Public Health Actions: Reducing the number of embryos transferred per ART procedure and increasing use of eSET, when clinically appropriate (typically for women aged <35 years), could help reduce multiple births, particularly ART-conceived twin infants, and related adverse consequences of ART. Because twins account for the majority of ART-conceived multiple births, improved patient education and counseling on the maternal and infant health risks of having twins is needed. Although ART contributes to high rates of multiple births, other factors not investigated in this report (e.g., delayed childbearing and non-ART fertility treatments) also contribute to multiple births and warrant further study.
Introduction
Since the birth of the first U.S. infant conceived with assisted reproductive technology (ART) in 1981, use of advanced technologies to overcome infertility has increased steadily, as has the number of fertility clinics providing ART services and procedures in the United States (1). In 1992, Congress passed the Fertility Clinic Success Rate and Certification Act (FCSRCA) (Public Law 102–493), which requires that all U.S. fertility clinics performing ART procedures report data to CDC annually on every ART procedure performed. CDC initiated data collection in 1996 and published the first annual ART Success Rates Report in 1997 (2). Several measures of success for ART are presented in the annual report (1,3), including the percentage of ART procedures and transfers that result in pregnancies, live-birth deliveries, singleton live-birth deliveries, and multiple live-birth deliveries.
Although ART helps millions of infertile couples to achieve pregnancy, it is associated with potential health risks to both mother and infant. Because multiple embryos are transferred in the majority of ART procedures, ART often results in multiple-gestation pregnancies and multiple births (4–11). Risks to the mother from multiple births include higher rates of caesarean deliveries, maternal hemorrhage, pregnancy-related high blood pressure, and gestational diabetes (12,13). Risks to the infant include prematurity, low birthweight, infant death, elevated risk for birth defects, and developmental disability (4–17). Further, even singleton infants conceived with ART have a higher risk for low birthweight and prematurity than singletons not conceived with ART (18,19).
This report was compiled on the basis of ART surveillance data reported to CDC's Division of Reproductive Health for procedures performed in 2013. Data on the use of ART in each U.S. state, the District of Columbia (DC), and Puerto Rico are presented; data are also reported for ART infant outcomes in 2013 resulting from ART procedures performed in 2012 and 2013. Additionally, the report examines the contribution of ART on select adverse outcomes (i.e., multiple births, low birthweight infants, and preterm deliveries) and compares ART infant outcomes to outcomes among all infants born in the United States (including Puerto Rico) in 2013.
Methods
National ART Surveillance System
In 1996, CDC initiated data collection of ART procedures performed in the United States. ART data for 1995–2003 were obtained from the Society of Assisted Reproductive Technology (SART). Since 2004, CDC has contracted with Westat, Inc., a statistical survey research organization, to obtain data from fertility clinics in the United States through the National ART Surveillance System (NASS), a web-based data collection system developed by CDC (http://www.cdc.gov/art/NASS.htm). Clinics enter their data into NASS and verify the data's accuracy before sending the data to Westat. SART-member clinics can report their data to NASS through SART. The data then are compiled by Westat and reviewed by both CDC and Westat. A small proportion of clinics (6.0%) did not report their data to CDC in 2013 and are listed as nonreporting programs in the 2013 ART Fertility Clinic Success Rates Report, as required by FCSRCA (Public Law 102–493). Because nonreporting clinics tend to be smaller on average than reporting clinics, NASS is estimated to contain information on 98.0% of all ART procedures in the United States (1).
Data collected include patient demographics, medical history, and infertility diagnoses; clinical information pertaining to the ART procedure type; and information regarding resultant pregnancies and births. The data file is organized with one record per ART procedure (or cycle of treatment) performed. Because ART providers typically do not provide continued prenatal care after a pregnancy is established, information on live births for all procedures is collected by ART clinics either directly from the patients (73.0%) or from the patients' obstetric providers (26.0%). Approximately one percent of pregnancy outcomes are missing in NASS.
ART Procedures
ART includes fertility treatments (e.g., in vitro fertilization [IVF], gamete intrafallopian transfer, and zygote intrafallopian transfer) in which eggs or embryos are handled in a laboratory. Approximately 99% of ART procedures performed are IVF. Because an ART procedure consists of several steps over an interval of approximately 2 weeks, a procedure often is referred to as a cycle of treatment. An ART cycle usually begins with drug-induced ovarian stimulation. If eggs are produced, the cycle progresses to the egg-retrieval stage, which involves surgical removal of the eggs from the ovaries. After the eggs are retrieved, they are combined with sperm in the laboratory during the IVF procedure. If successful, the most viable embryos (i.e., those that appear morphologically most likely to develop and implant) are selected for transfer back into the uterus by clinicians. If an embryo implants in the uterus, a clinical pregnancy is diagnosed by the presence of a gestational sac detectable by ultrasound. Most pregnancy losses occur within the first 12 weeks. Beyond 12 weeks of gestation, the pregnancy usually progresses to a live-birth delivery, defined as the delivery of one or more live-born infants. Survival of pregnancy ranges from 95.0% at 16 weeks to 98.0% at 20 weeks (20). ART does not include treatments in which only sperm are handled (i.e., intrauterine insemination) or procedures in which a woman takes drugs only to stimulate egg production without the intention of having eggs retrieved.
ART procedures are classified into four types on the basis of the source of the egg (patient or donor) and the status of the embryos (fresh or thawed). Both fresh and thawed embryos can be derived from either the patient's eggs or the donor's eggs. Both patient and donor embryos can be created using sperm from a partner or from a donor. ART procedures involving fresh embryos include an egg-retrieval stage. ART procedures that use thawed embryos do not include egg retrieval because the eggs were fertilized during a previous procedure, and the resultant embryos were frozen until the current procedure. An ART procedure can be discontinued at any step for medical reasons or by patient choice.
Variables and Definitions
ART data and outcomes from ART procedures are presented by the patient's residence (i.e., reporting area) at the time of treatment, which might not be the same as the location where the procedure was performed. If information on patient's residence was missing, residence was assigned as the location where the procedure was performed. Procedures performed in the United States among non-U.S. residents are included in NASS data, however they might be excluded from certain calculations for which the exact denominators were not known. To protect confidentiality in the presentation of data in tables, cells with values from 1–4 are suppressed, as are data that can be used to derive cell values of 1–4. However, these values are included in the totals. Because of small numbers, ART data from territories (with the exception of Puerto Rico) are not included in this report. In addition, rates derived from cell values <20 in the denominator have been suppressed because they are unstable, and rates could not be calculated when the denominator was zero (e.g., preterm birth among triplets, in states with no triplet births).
This report presents data on all procedures initiated; however, birth outcomes are determined on the basis of procedures that involved embryo transfer. The number of ART procedures performed per 1 million women of reproductive age (15–44 years) was calculated, and the resulting rate approximates the proportion of women of reproductive age who used ART in each reporting area. However, this proxy measure of ART use is only an approximation because some women who used ART might fall outside the age range of 15–44 years (approximately 10% in 2013), and some women might have had more than one procedure during the reporting period.
Live-birth delivery was defined as birth of one or more live-born infants, with delivery of multiple infants counted as one live-birth delivery. A singleton live-birth delivery was defined as a birth of only one infant who was born live. A multiple live-birth delivery was defined as a birth of two or more infants, at least one of whom was live-born.
Elective single-embryo transfer (eSET) is a procedure in which one embryo, selected from a larger number of available embryos, is placed in the uterus, with extra embryos cryopreserved. Fresh transfer procedures in which only one embryo was transferred but no embryos were cryopreserved are not considered eSET. In this report, both eSET procedures and the average number of embryos transferred were calculated for fresh, nondonor procedures in which at least one embryo was transferred. The percentage of eSET was calculated by dividing the total number of transfer procedures in which only one embryo was transferred and one or more embryos were cryopreserved, by the sum of the total number of single embryo transfer procedures where extra embryos were cryopreserved plus the total number of transfer procedures in which more than one embryo was transferred. Transfer procedures in which only one embryo was transferred but no embryos were cryopreserved were excluded from the calculation of eSET percentages. The average number of embryos transferred for three age groups (<35 years, 35–37 years, and >37 years) was calculated by dividing the total number of embryos transferred by the total number of embryo-transfer procedures performed in that age group.
The contribution of ART to all infants born in a particular reporting area was used as a second measure of ART use. Additionally, the percentage of infants (ART-conceived and all infants) born in the reporting area were calculated by plurality (singleton, multiple, twin, and triplet and higher-order births) by dividing the number of infants (ART-conceived and all infants) in each plurality group by the total number of infants born in that plurality group. The contribution of ART to an outcome (e.g., preterm or low birthweight infants) was calculated by dividing the total number of outcomes among ART-conceived infants by the total number of outcomes among all infants born. Additionally, the percentages of infants with low birthweight and preterm delivery were calculated for each plurality group (singletons, twins, and triplets and higher-order births) for both ART-conceived infants and all infants, by dividing the number of low birthweight or preterm infants in each plurality group by the total number of infants in that plurality group.
Low birthweight was defined as <2,500 grams, and very low birthweight as <1,500 grams. For comparability with births to women who did not undergo ART, for which gestational age is determined on the basis of the date of the last menstrual period, gestational age for fresh ART procedures was calculated by subtracting the date of egg retrieval from the birth date and adding 14 days. For frozen embryo cycles and for fresh ART procedures for which the date of retrieval was not available, gestational age was calculated by subtracting the date of embryo transfer from the birth date and adding 17 days (to account for an average of 3 days in embryo culture). Preterm delivery was defined as gestational age <37 weeks, and very preterm delivery as gestational age <32 weeks (21).
Content of This Report
This report provides information on U.S. ART procedures performed in 2013 and compares infant outcomes for ART-conceived infants born in 2013 (resulting from ART procedures performed in 2012 and 2013) with outcomes for all infants born in 2013 in the United States. Specifically, this report provides data on the number and outcomes of all ART procedures performed in 52 reporting areas (the 50 states, DC, and Puerto Rico) in 2013. For each of these reporting areas, data regarding live-birth delivery rates; the number of live-born infants, live-singleton, and multiple-birth deliveries; and the number of ART procedures in relation to the number of women in the reproductive age group (15–44 years) are reported (22).* Data are also presented on the number of embryo-transfer procedures performed, the average number of embryos transferred, and the percentage of eSET procedures performed among women who used fresh embryos from their own eggs, by age group.
For each reporting area, the proportions of singletons and multiple-birth (including twin and triplet and higher-order) infants resulting from ART are compared to the respective proportions among all infants born in that location in 2013. Infants born in the reporting area during that year include those who were conceived naturally and those resulting from ART and other infertility treatments. To accurately assess the proportion of ART births among overall U.S. births in 2013, ART births were aggregated from 2 reporting years: 1) infants conceived from ART procedures performed in 2012 and born in 2013 (69% of the live-birth deliveries reported to the ART surveillance system for 2013) and 2) infants conceived from ART procedures performed in 2013 and born in 2013 (31% of the live-birth deliveries reported to the ART surveillance system for 2013). Data on the total number of live-birth and multiple-birth infants in each reporting area in 2013 were obtained from U.S. natality files (23). The report presents the number and percentage of select adverse perinatal outcomes (low birthweight, very low birthweight, preterm delivery, and very preterm delivery) among ART-conceived infants and all infants and the contribution of ART to these outcomes. Additionally, the percentages of adverse perinatal outcomes are reported for singleton, twin, and triplet and higher-order infants for ART-conceived infants and all infants.
Results
Overview of Fertility Clinics
Of 497 fertility clinics in the United States that performed ART procedures in 2013, a total of 467 (94.0%) provided data to CDC with the majority located in or near major cities in the United States. The number of fertility clinics performing ART procedures varied by reporting area. The reporting areas with the largest number of fertility clinics reporting data for 2013 were in California (68), Texas (43), New York (39), Florida (30), Illinois (26), and New Jersey (21) (Figure 1).
Number and Type of ART Procedures
The number, type, and outcome of ART procedures performed in 2013 are provided for all 52 reporting areas (Table 1). Residency data were missing for approximately 0.9% of procedures performed and 1.1% of live-birth deliveries; however they are included in the totals. Approximately 16.1% of ART procedures were conducted among out-of-state residents. Non-U.S. residents accounted for approximately 2.6% of ART procedures, 2.9% of ART live-birth deliveries, and 2.9% of ART infants born.
A total of 190,773 ART procedures were reported to CDC in 2013 (1). This report includes data for 160,521 ART procedures performed in the United States (including Puerto Rico) with the intent to transfer at least one embryo (Table 1). It excludes 27,564 egg/embryo-freezing and embryo-banking procedures that did not result in an embryo transfer, 2,655 oocyte-thaw procedures, and 33 procedures that were performed in the remaining territories. Of the 160,521 procedures performed in the reporting areas, a total of 135,214 (84.2%) progressed to embryo transfer (Table 1). Of the 135,214 ART procedures that progressed to the embryo transfer stage, 65,580 (48.5%) resulted in a pregnancy, 53,252 (39.4%) in a live-birth delivery, 40,124 (29.7%) in a singleton live-birth delivery, and 13,128 (9.7%) in a multiple live-birth delivery. The 53,252 live-birth deliveries included 40,124 (75.3%) singleton live-birth deliveries and 13,128 (24.7%) multiple live-birth deliveries and resulted in 66,691 live-born infants (Table 1) (Figure 2).
Six states (California, Illinois, Massachusetts, New Jersey, New York, and Texas) accounted for 49.0% (78,643 of 160,521) of all ART procedures, 49.0% (66,275 of 135,214) of all embryo transfer procedures, 47.3% (31,511 of 66,691) of all infants born from ART, and 45.5% (5,978 of 13,128) of all ART multiple live-birth deliveries in the United States (Table 1); however, these six states accounted for only 36.5% of all U.S. births (21).
The number of ART procedures per million women of reproductive age (15–44 years) varied from 352 in Puerto Rico to 7,688 in DC, with an overall national average rate of 2,521. Thirteen reporting areas (California, Connecticut, Delaware, Hawaii, Illinois, Maryland, Massachusetts, New Hampshire, New Jersey, New York, Rhode Island, Virginia, and DC) had rates higher than the national rate. Of these reporting areas, Massachusetts (6,930), New Jersey (5,043), and DC (7,688) had rates exceeding twice the national rate, while Connecticut (4,650), Illinois (3,998), Maryland (4,372), and New York (4,802) had rates exceeding 1.5 times the national rate (Figure 3).
Embryo Transfer and Patient's Age
The number of embryo-transfer procedures performed, the average number of embryos transferred per procedure, and the percentage of eSET procedures performed among women who used fresh embryos from their own eggs are provided by age group (Table 2). Overall, the number of embryo transfer procedures performed were 33,732 among women aged <35 years, 15,930 among women aged 35–37 years, and 23,859 among women aged >37 years. Nationally, the average number of embryos transferred per procedure was 1.8 among women aged <35 years (range: 1.2 in Delaware to 2.2 in Alaska and Puerto Rico), 2.0 among women aged 35–37 years (range: 1.5 in Maine to 2.3 in New Mexico and Puerto Rico), and 2.5 among women aged >37 years (range: 1.8 in Delaware to 3.1 in Rhode Island). Nationally, rates of eSET ranged from 21.4% among women aged <35 years (range: 4.0% in Idaho to 77.5% in Delaware), 12.6% among women aged 35–37 years (range: 0% in Idaho and Oklahoma to 38.2% in Maine), and 3.6% among women aged >37 years (range: 0% in eight reporting areas to 29.2% in Delaware). Among women aged <35 years, eSET rates exceeded the national rate for women aged <35 years in 20 reporting areas: California, Connecticut, Delaware, Georgia, Iowa, Maine, Maryland, Massachusetts, Minnesota, Montana, New Hampshire, New Jersey, North Carolina, Pennsylvania, South Dakota, Vermont, Virginia, Washington, Wisconsin, and DC.
Singleton and Multiple-Birth Infants
Among 3,968,667 infants born in the United States and Puerto Rico in 2013 (21), a total of 62,812 (1.6%) were conceived with ART procedures performed in 2012 and 2013 (Table 3). California, Texas, and New York had the highest total number of all infant births (494,705; 387,340; and 236,980, respectively), as well as ART-conceived infant births (8,490; 4,987; and 6,455, respectively). The contribution of ART to all infants born was highest in Massachusetts (4.8%), followed by DC (3.9%), New Jersey (3.7%), and Connecticut (3.3%). Although singletons accounted for 96.5% of total infants born in 2013 (range: 95.5% in Massachusetts and New Jersey to 98.2% in Puerto Rico), singletons accounted for only 58.9% of all ART-conceived infants (range: 38.4% in Wyoming to 79.6% in Delaware).
Nationwide, 41.1% of ART-conceived infants were multiples (range: 20.4% in Delaware to 61.6% in Wyoming), compared with only 3.5% of all infants (range: 1.8% in Puerto Rico to 4.5% in Massachusetts and New Jersey) (Table 4). ART-conceived twins accounted for approximately 95.4% (24,607 of 25,798) of all ART-conceived infants born in multiple deliveries. ART multiple-birth infants represent 18.7% (range: 4.5% in Puerto Rico to 35.7% in Massachusetts) of total multiple-birth infants. Approximately 39.2% (range: 20.4% in Delaware to 51.1% in Idaho) of all ART-conceived infants were twins, compared with only 3.3% (range: 1.7% in Puerto Rico to 4.4% in Massachusetts and New Jersey) of all infants. ART-conceived twin infants accounted for 18.5% (range: 4.5% in Mississippi to 35.3% in Massachusetts) of all twins born in 2013. Finally, 1.9% of ART-conceived infants were triplets and higher-order multiples (range: 0 in six reporting areas to 8.8% in Mississippi), compared with 0.1% (with very little variation by reporting area) of all infants. ART triplet and higher-order–multiple infants contributed to 25.2% (range: 0% in Puerto Rico to 51.5% in New Jersey) of all triplet and higher-order infants born in 2013.
Adverse Perinatal Outcomes
Nationally, ART-conceived infants contributed to approximately 5.8% of all low birthweight (range: 0.9% in Puerto Rico to 15.1% in Massachusetts) and 5.8% of all very low birthweight infants (range: 0% in Alaska to 14.5% in Massachusetts) (Table 5). In three states (Connecticut, Massachusetts, and New Jersey), >10% of all low birthweight and very low birthweight infants born were conceived with ART.
In most reporting areas, percentages of low birthweight and very low birthweight infants were higher among infants conceived with ART than among all infants (Table 5). Among ART-conceived infants, 29.1% had low birthweight (range: 18.3% in Delaware to 42.6% in Louisiana), compared with 8.0% among all infants (range: 5.8% in Alaska to 11.5% in Mississippi). Approximately 5.1% of ART-conceived infants had very low birthweight (range: 0% in Alaska to 10.6% in Tennessee), compared with 1.4% among all infants (range: 0.9% in Montana and Vermont to 12.2% in Puerto Rico) (Table 5).
Nationally, ART contributed approximately 4.6% (range: 0.6% in Puerto Rico to 13.3% in Massachusetts) and 5.0% (range: 0.7% in Puerto Rico to 13.0% in Massachusetts) of all preterm and very preterm infants, respectively (Table 6). In three states (Connecticut, Massachusetts, and New Jersey), >10% of all preterm infants were conceived with ART, and in two states (Massachusetts and New Jersey), >10% of all very preterm infants were conceived with ART.
As with low birthweight, rates of preterm and very preterm infants were higher among ART-conceived infants than in the total birth population (Table 6). Among ART-conceived infants, 33.6% were born preterm (range: 22.3% in DC to 50.7% in Louisiana), compared with 11.4% among all infants (range: 8.1% in Vermont to 16.6% in Mississippi). Approximately 6.1% of ART-conceived infants were very preterm (range: 2.3% in Oregon to 13.2% in Montana), compared with 1.9% among all infants (range: 1.1% in Vermont to 3.3% in Alabama) (Table 6).
The percentage of ART-conceived infants who were low birthweight varied from 9.0% (range: 5.1% in Mississippi to 19.7% in Puerto Rico) among singletons, to 56.3% (range: 48.3% in Maine to 72.4% in Puerto Rico) among twins, and 93.6% (range: 61.9% in Wisconsin to 100% in several reporting areas) among triplets and higher-order multiples; the corresponding percentages among all infants born were 6.3% (range: 4.6% in Alaska to 9.6% in Mississippi and Puerto Rico) among singletons, 55.3% (range: 43.6% in Alaska to 65.6% in Mississippi) among twins, and 94.2% (range: 81.8% in Puerto Rico to 100% in four reporting areas) among triples and higher-order multiples (Table 7).
The percentage of ART-conceived infants who were born preterm varied from 13.3% among singletons (range: 8.7% in Rhode Island to 26.9% in West Virginia), to 61.0% among twins (range: 47.8% in DC to 78.8% in Oklahoma), and 97.5% among triplets and higher-order multiples (range: 85.7% in Virginia to 100% in several reporting areas); the corresponding percentages among all infants were 10.1% for singletons (range: 6.8% in Vermont to 14.8% in Mississippi), 56.6% for twins (range: 44.7% in New Hampshire to 68.9% in Louisiana), and 93.0% for triplets and higher-order infants (range: 81.8% in Puerto Rico to 100% in several reporting areas) (Table 8).
Discussion
Overview
The use of ART has increased substantially in the United States since the beginning of ART surveillance. In 1996 (the first full year for which ART data were reported to CDC), a total of 20,597 infants were born from 64,036 ART procedures (24). Since then, the number of procedures reported to CDC and the number of infants born from ART procedures has approximately tripled. Several changes can be observed in ART use and outcomes since the preceding reporting year in 2012 (25). ART utilization rates as measured by procedures performed per million women of reproductive age (15–44 years) increased from 2,483 to 2,521. The average number of embryos transferred declined among younger age groups (1.9 to 1.8 among women aged <35 years). Rates of eSET increased among younger age groups (15.3% to 21.4% among women aged <35 years). Overall, rates of ART-conceived infants born in multiple-birth deliveries declined from 43.6% to 41.1%, rates of ART-conceived twin infants declined from 41.2% to 39.2%, and rates of ART-conceived triplet and higher-order infants declined from 2.4% to 1.9%. However, the contribution of ART-conceived twin infants to all twin infants and the contribution of ART-conceived preterm infants to all preterm infants remained unchanged at approximately 19% and 4.6%, respectively.
Comparable data on ART use and embryo transfer practices from 16 European countries indicate that in 2010, ART use as defined by the number of procedures performed per million women of reproductive age was 6,258; this was 2.5 times higher than the rate in the United States in 2013 (26). Rates of single embryo transfers (eSET rates are not reported) varied widely in Europe as they did across the reporting areas in the United States, and a few countries reported a single embryo transfer rate of over 50%. Overall, in these 16 reporting countries, approximately 80% of all IVF deliveries were singleton deliveries, compared with 75% in the United States (26).
The contribution of ART on rates of multiple births and poor birth outcomes remained substantial in 2013, as approximately 41% of ART-conceived infants were born in multiple births (compared with only 3.5% of infants among the total birth population). These rates remain high despite the continuing decline in the contribution of ART-conceived infants to all triplets and higher-order infants, which dropped from 29.6% in 2012 to 25.2% in 2013. ART-conceived twins accounted for approximately 95.4% (24,607 of 25,798) of all ART-conceived infants born in multiple-birth deliveries. On average, approximately two embryos were transferred among women aged <35 years, even though single embryo transfers have been associated with better perinatal outcomes in most women in this age group (27–29). Nationally, the rate of eSET procedures was relatively low among women aged <35 years, although it increased substantially from 15.3% in 2012 to 21.4% in 2013. Rates of low birthweight and preterm births were substantially higher among ART-conceived infants (29.1% and 33.6%, respectively) than among all infants (8.0% and 11.4%, respectively). Compared with ART singletons, ART twin and triplet and higher-order infants were more likely to be born preterm (more than four-and-a-half times and seven times more, respectively). Although infants conceived with ART accounted for approximately 1.6% of total births in the United States in 2013, the proportions of twin and triplet and higher-order infants attributable to ART were 18.5% and 25.2%, respectively.
Variations by Reporting Area
ART use (as measured by the number of ART procedures performed per 1 million women of reproductive age varied widely by reporting area after controlling for the size of the population of women of reproductive age: residents of Connecticut, Delaware, Hawaii, Illinois, Maryland, New Hampshire, New Jersey, New York, Rhode Island, Virginia, and DC had higher ART use than the national level. Although some women who used ART might have been aged >44 years, this measure is still useful as a proxy indicator of ART use in each reporting area. Importantly, residents of California, Illinois, Massachusetts, New York, New Jersey, and Texas accounted for nearly half (47%) of all ART-conceived infants, yet rates of ART use were not correspondingly high in all six states. ART use exceeded twice the national rate in two (Massachusetts and New Jersey) of these six states. Massachusetts ranked highest in ART use, whereas California, despite having the highest overall number of ART procedures and the highest number of ART-conceived infants, ranked 13th nationally, with a rate of ART use that was slightly higher than the national rate. Furthermore, the contribution of ART to all infants born in the state was 4.8% in Massachusetts and 1.7% in California.
Such differences might be explained in part by variations in state health insurance coverage. A total of 15 states (Arkansas, California, Connecticut, Hawaii, Illinois, Louisiana, Maryland, Massachusetts, Montana, New Jersey, New York, Ohio, Rhode Island, Texas, and West Virginia) have passed legislation mandating insurance coverage for infertility treatments, although not all mandates require coverage for ART; mandates from four of these states (Illinois, Massachusetts, New Jersey, and Rhode Island) include comprehensive coverage for at least four cycles of IVF.† Three of the four states with comprehensive mandates (Illinois, Massachusetts, and New Jersey) had rates of ART use that were at least 50% higher than the national level. This type of mandated insurance has been associated with greater use of ART (30–32).
Elective Single-Embryo Transfer Rates
According to the American Society of Reproductive Medicine (ASRM) and SART, although eSET is appropriate, it is not required for favorable prognosis for patients aged <35 years (who typically have extra embryos available for cryopreservation) undergoing their first ART treatment procedures, for patients with previous successful IVF procedures, and for patients who are recipients of oocytes from a donor aged <35 years (33). ASRM/SART guidelines on the number of embryos transferred allow for up to two embryos to be transferred even among good prognosis patients with patient counseling regarding risks for multifetal pregnancies (34). A high number of double embryo transfers occur among patients who otherwise appear to be good candidates for transferring one embryo (35). Reducing the number of embryos transferred from two to one among those patients who have a good chance of pregnancy and live birth with single embryo transfers will lower ART-conceived twin rates and improve ART outcomes (35,36).
Percentage of eSET procedures was higher among women aged <35 years than older age groups (21.4% nationally) and varied widely among reporting areas (range: 4.0% to 77.5%). The eSET rates are influenced by many factors (e.g., patient's age, diagnostic factors, and cost); ART treatment costs are high and typically paid out-of-pocket by the patient. Therefore, broad insurance mandates for IVF might increase access to ART services and decrease multiple-embryo transfer procedures (31,37). National eSET rates tripled in the United States among younger women from 7.4% in 2009 to 21.4% in 2013 (24). Rates of eSET are still lower in the United States than in countries that impose restrictions on the number of embryos transferred and provide extensive public funding for ART services (38). In the United States, even where mandated, coverage for infertility treatment can vary in scope (30). In the four states with mandatory comprehensive insurance for ART, eSET rates among women aged <35 years were higher than the national average (21.4%) in Massachusetts (43.0%) and New Jersey (26.4%), whereas they were lower in Illinois (19.1%) and Rhode Island (15.7%). Because ART procedures are expensive (out-of-pocket costs estimated at $27,000 for those with no insurance), wider acceptance and use of eSET procedures still face considerable barriers in the United States and might require strengthening the guidelines on eSET practices and greater expansion of insurance coverage for ART services (35,36,39).
ART Multiple-Birth Infants
Since 2000, the percentage of multiple-birth infants in the United States that were ART-conceived declined by 22.6% (from 53.1% in 2000 to 41.1% in 2013) (40). A substantial decline of 78.7% was noted in the triplets and higher-order infants that were ART-conceived (from 8.9% in 2000 to 1.9% in 2013), and a lesser decline of 11.3% was noted in the percentage of twins that were ART-conceived (from 44.2% in 2000 to 39.2% in 2013).
The slow decline in twin rates among women who undergo ART procedures is largely attributable to low increases in eSET rates and the continued practice of transferring two embryos among favorable prognosis patients aged <35 years (35,36). On average, two embryos were transferred per ART procedure in this age group in 2013, and this practice varied little between states. The average number of embryos transferred in this age group also indicated little variation among the four states with comprehensive mandated ART coverage.
High ART-conceived twin rates can also be partially explained by a desire for parenthood among couples experiencing infertility who might underestimate the risks for multiple-gestation pregnancies (41–43). Therefore, understanding the perspective of couples undergoing infertility treatments about multiple births is an important consideration. Although a major barrier to the greater use of eSET is the high out-of-pocket cost of ART, the use and acceptance of eSET among younger patients with good prognosis can be promoted through patient education. Studies indicate that patient education focusing on maternal and perinatal morbidity, mortality, and the economic costs of twin gestation has been effective in reducing the preference for twins among patients (44–46).
Singleton live-birth deliveries have lower risks than multiple-birth deliveries for adverse birth outcomes (e.g., prematurity, low birthweight, disability, and death) (47–49). To optimize birth outcomes, the transfer of fewer embryos should be encouraged, taking into consideration patient's age and prognosis (28). These findings indicate that ART-conceived twins and higher-order multiples were approximately four-and-a-half and seven times more likely to be born preterm than were ART-conceived singletons. The ASRM Practice Committee has noted that the most direct way to limit the risk for multiple gestations from ART is to transfer one embryo at a time (33). Although the guidelines issued by ASRM/SART on the number of embryos transferred were revised several times (34,50–53), they still allow a maximum of two embryos to be transferred for women aged <35 years who have good prognosis.
The economic costs of multiple births underscore renewed efforts to reduce ART-related multiple births. In 2013, the mean medical cost was estimated to be $26,922 for ART-conceived singleton deliveries, $115,238 for ART-conceived twins, and $434,668 for ART-conceived triplet and higher-order infants (54). Transferring two embryos is associated with a slight increase in birth rate and a greater increase in the twin birth rate as compared with transferring a single embryo (28,55). Although cumulative birth rates from transferring two embryos over two procedures are similar to birth rates from transferring two embryos in single procedure, lowering twin delivery rates might also be cost effective (56,57). Because of the data on the higher economic costs from maternal and neonatal complications, insurance companies could consider expanding coverage for ART services in return for clinically appropriate limitations on the number of embryos transferred (24,27,36,54).
ART Low Birthweight Infants
and Preterm Births
The rates of low birthweight and very low birthweight infants were disproportionately higher among ART-conceived infants than among infants in the total birth population. The two states (Massachusetts and New Jersey) that had large numbers of ART procedures and births also had high ART contributions (>10%) to both categories of low birthweight and preterm births. In the United States, the contribution of ART to preterm births, most of which are also low birthweight, is a key concern. Since 1981, the rate of preterm births in the United States has increased >21% to its present level of 11.4% (23,48). Fertility treatments, both ART and controlled ovarian stimulations, contribute substantially to preterm births (48,58). Preterm births are a leading cause of infant mortality and morbidity; preterm infants are at increased risk for death and have more health and developmental problems than full-term infants (48,59–61). The health risks associated with preterm births have contributed to increasing health care costs. In 2005, the estimated economic cost associated with preterm births in the United States was $26 billion ($51,600 per infant born preterm) (48). ART-conceived infants born preterm accounted for approximately 5% of all preterm births in the United States in 2012 and an estimated total economic cost of >$1.3 billion annually (62).
In addition to the known multiple-birth risks associated with ART, singleton infants conceived from ART procedures are at increased risk for low birthweight and preterm delivery. In 2013, singleton infants conceived with ART (9.0%) were more likely than infants born in the total birth population (6.3%) to have low birthweight. The percentage of ART singletons born preterm was 13.3%, and the percentage of singletons born preterm in the total U.S. birth population was 10.1%. Therefore, adverse infant health outcomes (e.g., low birthweight and preterm delivery) among singletons also should be considered when assessing the effects of ART.
Limitations
The findings in this report are subject to at least five limitations. First, ART surveillance data were reported for each ART procedure performed rather than for each patient who used ART. Second, because patients can achieve a successful pregnancy after undergoing multiple procedures, the procedure-specific success rates reported here underestimate the true per-patient success rates. Third, prematurity and low birthweight could be associated with factors contributing to underlying infertility and not entirely to ART procedures. Fourth, a small percentage of fertility clinics that performed ART in 2013 did not report their data to CDC, and these clinics might have had results differing from reporting clinics. Fifth, NASS lacks data on embryo quality, which influences the use of eSET among favorable prognosis patients aged <35 years, however having extra embryos available for cryopreservation has been shown to be a good predictor of embryo quality. Finally, two states had a substantial percentage of residency information missing for procedures performed in 2013 (Hawaii [7.4%] and Pennsylvania [3.1%]). Overall, residency data were missing for approximately 0.9% of procedures performed and 1.1% of all live-birth deliveries resulting from ART procedures performed in 2013.
Conclusion
Since 1996, the number of ART procedures performed in the United States and the number of infants born as a result of these procedures nearly tripled. With this increasing use, ART-conceived infants represented 1.6% of infants born in the United States in 2013 and noticeably contributed to the prevalence of low birthweight and preterm deliveries, as approximately half of ART-conceived infants were born in multiple-gestation pregnancies that resulted in multiple births. Although rates of triplet and higher-order infants from ART-induced pregnancies have declined since 2000, rates of twin infants have remained persistently high. Therefore, the impact of ART on poor birth outcomes remains substantial, despite the decline in higher-order–multiple births among ART-conceived infants. This report documents the rates and contribution of ART to multiple-birth deliveries, low birthweight, and preterm birth by each state. It also highlights the differences in rates of low birthweight and prematurity between ART-conceived singleton, twin, and triplet and higher-order infants and all singleton, twin, and triplet and higher-order infants born in the total birth population. This allows state health departments to monitor the extent of ART-related adverse perinatal outcomes in their individual states.
Comprehensive insurance coverage of ART can help increase access to fertility treatments. The findings in this report indicate that ART use was higher than the national rate in all four states with mandated comprehensive insurance coverage. Three of these four states had utilization rates exceeding 1.5 times the national level. However, embryo transfer practices were similar to the national rates in all four states providing comprehensive insurance coverage. The use of eSET among patients aged <35 years was high in Massachusetts (43%), which had a correspondingly lower rate of ART-conceived multiple-birth infants (34%). Further research is needed to ascertain the influence of state health insurance mandates on ART use, embryo transfer practices, and infant outcomes, as well as the economic and out-of-pocket patient costs of multiple births (29,33,35,36). Increased use of ART in reporting areas with insurance mandates can also result in higher numbers of ART-conceived multiple-birth deliveries. Addressing the risk for multiple-birth deliveries also requires understanding the perspectives of couples undergoing infertility treatments who might view a multiple birth, especially twins, as an acceptable or desired outcome and lack awareness of the increased risks associated with multiple births to mothers and infants. Clinicians need to be aware of ongoing efforts to limit the number of embryos transferred to reduce twin rates and encourage wider implementation of eSET, when clinically appropriate, as mechanisms of promoting singleton infant births among ART-conceived pregnancies (28,33,36).
Other factors influencing multiple births include maternal age at conception and non-ART fertility treatments (48,58,63). During 1980–2009, the older age of women giving childbirth accounted for a substantial rise in twins (63). Further efforts also are needed to monitor the use of non-ART fertility treatments and their role in the rising number of multiple-birth deliveries (48,58). In 2011, it was estimated that approximately 19% of twin births in the United States were attributable to non-IVF fertility treatments (58). ART only partially explains the overall prevalence of these adverse outcomes in the United States. Preterm births resulting from controlled ovarian stimulation (superovulation-intrauterine insemination and conventional ovulation induction) also might contribute to multiple gestations (48,58). More research is needed to identify the causes and consequences of preterm births that occur because of infertility treatments and to institute guidelines to reduce the number of multiple gestations (48,58). The risk for multiple gestations associated with non-ART fertility treatments is less well-documented, as clinics are not mandated to report data on their use. Studies have demonstrated that singleton infants conceived with ovulation stimulation are more likely than naturally conceived infants to be small for gestational age (64). CDC is monitoring the prevalence of non-ART fertility treatment use and their resultant outcomes among women who had live births in several states participating in the Pregnancy Risk Assessment Monitoring System (65). CDC has outlined a strategy for improving ART practice and outcomes through coordinated efforts of health care professionals, professional societies, patients with infertility, organizations representing people coping with infertility, the scientific community, insurance providers, nonprofit organizations, and governmental agencies (66). CDC is also working to improve state-based surveillance of ART, infertility, and other birth-related issues by linking data from NASS to data collected by states (i.e., birth certificate, infant death, hospital discharge, and birth defect registry information). This initiative, the States Monitoring ART (SMART) Collaborative,§ has been determined to be feasible and useful for monitoring long-term outcomes of ART (67,68). The most recent ART Surveillance Summary was published by CDC in 2015 (25). CDC will continue to provide updates of ART use in the United States as data become available.
References
- CDC; American Society for Reproductive Medicine; Society for Assisted Reproductive Technology. 2013 assisted reproductive technology fertility clinic success rates report. Atlanta, GA: US Department of Health and Human Services, CDC; 2015.
- CDC; American Society for Reproductive Medicine; Society for Assisted Reproductive Technology. RESOLVE. 1995 assisted reproductive technology success rates. Atlanta, GA: US Department of Health and Human Services, CDC; 1997.
- CDC; American Society for Reproductive Medicine; Society for Assisted Reproductive Technology. 2013 assisted reproductive technology national summary report. Atlanta, GA: US Department of Health and Human Services, CDC; 2015.
- Schieve LA, Peterson HB, Meikle SF, et al. Live-birth rates and multiple-birth risk using in vitro fertilization. JAMA 1999;282:1832–8.
- Schieve LA, Meikle SF, Peterson HB, Jeng G, Burnett NM, Wilcox LS. Does assisted hatching pose a risk for monozygotic twinning in pregnancies conceived through in vitro fertilization? Fertil Steril 2000;74:288–94.
- Reynolds MA, Schieve LA, Martin JA, Jeng G, Macaluso M. Trends in multiple births conceived using assisted reproductive technology, United States, 1997–2000. Pediatrics 2003;111:1159–62.
- Reynolds MA, Schieve LA, Jeng G, Peterson HB, Wilcox LS. Risk of multiple birth associated with in vitro fertilization using donor eggs. Am J Epidemiol 2001;154:1043–50.
- Vahratian A, Schieve LA, Reynolds MA, Jeng G. Live-birth rates and multiple-birth risk of assisted reproductive technology pregnancies conceived using thawed embryos, USA 1999–2000. Hum Reprod 2003;18:1442–8.
- Wright V, Schieve LA, Vahratian A, Reynolds MA. Monozygotic twinning associated with day 5 embryo transfer in pregnancies conceived after IVF. Hum Reprod 2004;19:1831–6.
- Kissin DM, Schieve LA, Reynolds MA. Multiple-birth risk associated with IVF and extended embryo culture: USA, 2001. Hum Reprod 2005;20:2215–23.
- Reynolds MA, Schieve LA. Trends in embryo transfer practices and multiple gestation for IVF procedures in the USA, 1996–2002. Hum Reprod 2006;21:694–700.
- Murray SR, Norman JE. Multiple pregnancies following assisted reproductive technologies—a happy consequence or double trouble? Semin Fetal Neonatal Med 2014;19:222–7.
- The ESHRE Capri Workshop Group. Multiple gestation pregnancy. Hum Reprod 2000;15:1856–64.
- MacKay AP, Berg CJ, King JC, Duran C, Chang J. Pregnancy-related mortality among women with multifetal pregnancies. Obstet Gynecol 2006;107:563–8.
- Bukulmez O. Does assisted reproductive technology cause birth defects? Curr Opin Obstet Gynecol 2009;21:260–4.
- Reefhuis J, Honein MA, Schieve LA, Correa A, Hobbs CA, Rasmussen SA; National Birth Defects Prevention Study. Assisted reproductive technology and major structural birth defects in the United States. Hum Reprod 2009;24:360–6.
- Fountain C, Zhang Y, Kissin DM, et al. Association between assisted reproductive technology conception and autism in California, 1997–2007. Am J Public Health 2015;105:963–71.
- Schieve LA, Meikle SF, Ferre C, Peterson HB, Jeng G, Wilcox LS. Low and very low birth weight in infants conceived with use of assisted reproductive technology. N Engl J Med 2002;346:731–7.
- Schieve LA, Ferre C, Peterson HB, Macaluso M, Reynolds MA, Wright VC. Perinatal outcome among singleton infants conceived through assisted reproductive technology in the United States. Obstet Gynecol 2004;103:1144–53.
- Farr SL, Schieve LA, Jamieson DJ. Pregnancy loss among pregnancies conceived through assisted reproductive technology, United States, 1999–2002. Am J Epidemiol 2007;165:1380–8.
- Kramer MR, Hogue CR. What causes racial disparities in very preterm birth? A biosocial perspective. Epidemiol Rev 2009;31:84–98.
- US Census Bureau, Population Division. Annual estimates of the resident population for selected age groups by sex for the United States, states, counties, and Puerto Rico Commonwealth and Municipios: April 1, 2010 to July 1, 2013. Washington, DC: US Census Bureau; 2013. Available at http://factfinder.census.gov/faces/tableservices/jsf/pages/productview.xhtml?pid=PEP_2013_PEPAGESEX&prodType=table.
- Martin JA, Hamilton BE, Osterman MJ, Curtin SC, Matthews TJ. Births: final data for 2013. Natl Vital Stat Rep 2015;64:1–65.
- CDC; American Society for Reproductive Medicine; Society for Assisted Reproductive Technology. RESOLVE. 1996 assisted reproductive technology success rates. Atlanta, GA: US Department of Health and Human Services, CDC; 1998.
- Sunderam S, Kissin DM, Crawford SB, et al. Assisted reproductive technology surveillance—United States, 2012. MMWR Surveill Summ 2015;64(No. SS-6).
- Kupka MS, Ferraretti AP, de Mouzon J, et al.; European Society of Human Reproduction and Embryology, European IVF-Monitoring Consortium. Assisted reproductive technology in Europe, 2010: results generated from European registers by ESHRE. Hum Reprod 2014;29:2099–113.
- Min JK, Breheny SA, MacLachlan V, Healy DL. What is the most relevant standard of success in assisted reproduction? The singleton, term gestation, live birth rate per cycle initiated: the BESST endpoint for assisted reproduction. Hum Reprod 2004;19:3–7.
- Kissin DM, Kulkarni AD, Kushnir VA, Jamieson DJ; National ART Surveillance System Group. Number of embryos transferred after in vitro fertilization and good perinatal outcome. Obstet Gynecol 2014;123:239–47.
- Stillman RJ, Richter KS, Jones HW Jr. Refuting a misguided campaign against the goal of single-embryo transfer and singleton birth in assisted reproduction. Hum Reprod 2013;28:2599–607.
- Henne MB, Bundorf MK. Insurance mandates and trends in infertility treatments. Fertil Steril 2008;89:66–73.
- Hamilton BH, McManus B. The effects of insurance mandates on choices and outcomes in infertility treatment markets. Health Econ 2012;21:994–1016.
- Bitler MP, Schmidt L. Utilization of infertility treatments: the effects of insurance mandates. Demography 2012;49:125–49.
- Practice Committee of the Society for Assisted Reproductive Technology; Practice Committee of the American Society for Reproductive Medicine. Elective single-embryo transfer. Fertil Steril 2012;97:835–42.
- Practice Committee of American Society for Reproductive Medicine; Practice Committee of the Society for Assisted Reproductive Technology. Criteria for number of embryos to transfer: a committee opinion. Fertil Steril 2013;99:44–6.
- Kissin DM, Kulkarni AD, Mneimneh A, et al.; National ART Surveillance System (NASS) group. Embryo transfer practices and multiple births resulting from assisted reproductive technology: an opportunity for prevention. Fertil Steril 2015;103:954–61.
- Coddington C, Jensen JR. Multiple pregnancy: changing expectations for patients and patterns for physicians. Fertil Steril 2015;103:898–9.
- Jain T, Harlow BL, Hornstein MD. Insurance coverage and outcomes of in vitro fertilization. N Engl J Med 2002;347:661–6.
- Maheshwari A, Griffiths S, Bhattacharya S. Global variations in the uptake of single embryo transfer. Hum Reprod Update 2011;17:107–20.
- Nachtigall RD, MacDougall K, Davis AC, Beyene Y. Expensive but worth it: older parents' attitudes and opinions about the costs and insurance coverage for in vitro fertilization. Fertil Steril 2012;97:82–7.
- Wright VC, Schieve LA, Reynolds MA, Jeng G. Assisted reproductive technology surveillance—United States, 2000. MMWR Surveill Summ 2003;52(No. 9). Erratum in: MMWR Morb Mortal Wkly Rep:2003;52:942.
- Grobman WA, Milad MP, Stout J, Klock SC. Patient perceptions of multiple gestations: an assessment of knowledge and risk aversion. Am J Obstet Gynecol 2001;185:920–4.
- Blennborn M, Nilsson S, Hillervik C, Hellberg D. The couple's decision-making in IVF: one or two embryos at transfer? Hum Reprod 2005;20:1292–7.
- Pinborg A, Loft A, Schmidt L, Andersen AN. Attitudes of IVF/ICSI-twin mothers towards twins and single embryo transfer. Hum Reprod 2003;18:621–7.
- Ryan GL, Sparks AE, Sipe CS, Syrop CH, Dokras A, Van Voorhis BJ. A mandatory single blastocyst transfer policy with educational campaign in a United States IVF program reduces multiple gestation rates without sacrificing pregnancy rates. Fertil Steril 2007;88:354–60.
- Hope N, Rombauts L. Can an educational DVD improve the acceptability of elective single embryo transfer? A randomized controlled study. Fertil Steril 2010;94:489–95.
- Murray S, Shetty A, Rattray A, Taylor V, Bhattacharya S. A randomized comparison of alternative methods of information provision on the acceptability of elective single embryo transfer. Hum Reprod 2004;19:911–6.
- Practice Committee of American Society for Reproductive Medicine. Multiple gestation associated with infertility therapy: an American Society for Reproductive Medicine Practice Committee opinion. Fertil Steril 2012;97:825–34.
- Behrman RE, Butler AS, eds. Preterm birth: causes, consequences, and prevention. Washington, DC: National Academies Press; 2007.
- Boulet SL, Schieve LA, Nannini A, et al. Perinatal outcomes of twin births conceived using assisted reproduction technology: a population-based study. Hum Reprod 2008;23:1941–8.
- Practice Committee of the Society for Assisted Reproductive Technology; American Society for Reproductive Medicine. Guidelines on the number of embryos transferred. Fertil Steril 2004;82(Suppl 1):1–2.
- Practice Committee of the Society for Assisted Reproductive Technology; Practice Committee of the American Society for Reproductive Medicine. Guidelines on number of embryos transferred. Fertil Steril 2006;86(5 Suppl 1):S51–2.
- Practice Committee of the Society for Assisted Reproductive Technology; Practice Committee of American Society for Reproductive Medicine. Guidelines on number of embryos transferred. Fertil Steril 2008;90(5 Suppl):S163–4.
- Practice Committee of the American Society for Reproductive Medicine; Practice Committee of the Society for Assisted Reproductive Technology. Guidelines on number of embryos transferred. Fertil Steril 2009;92:1518–9.
- Lemos EV, Zhang D, Van Voorhis BJ, Hu XH. Healthcare expenses associated with multiple vs singleton pregnancies in the United States. Am J Obstet Gynecol 2013;209:586.e1–11.
- Henne MB, Bundorf MK. The effects of competition on assisted reproductive technology outcomes. Fertil Steril 2010;93:1820–30.
- Luke B, Brown MB, Wantman E, et al. Application of a validated prediction model for in vitro fertilization: comparison of live birth rates and multiple birth rates with 1 embryo transferred over 2 cycles vs 2 embryos in 1 cycle. Am J Obstet Gynecol 2015;212:676.e1–7.
- Fiddelers AAA, Severens JL, Dirksen CD, Dumoulin JC, Land JA, Evers JL. Economic evaluations of single- versus double-embryo transfer in IVF. Hum Reprod Update 2007;13:5–13.
- Kulkarni AD, Jamieson DJ, Jones HW Jr, et al. Fertility treatments and multiple births in the United States. N Engl J Med 2013;369:2218–25.
- Callaghan WM, MacDorman MF, Rasmussen SA, Qin C, Lackritz EM. The contribution of preterm birth to infant mortality rates in the United States. Pediatrics 2006;118:1566–73.
- Tanner K, Sabrine N, Wren C. Cardiovascular malformations among preterm infants. Pediatrics 2005;116:e833–8.
- Rasmussen SA, Moore CA, Paulozzi LJ, Rhodenhiser EP. Risk for birth defects among premature infants: a population-based study. J Pediatr 2001;138:668–73.
- Kissin DM, Jamieson DJ, Barfield WD. Monitoring health outcomes of assisted reproductive technology. N Engl J Med 2014;371:91–3.
- Martin JA, Hamilton BE, Osterman MJK. Three decades of twin births in the United States, 1980–2009. NCHS Data Brief 2012;80:1–8.
- D'Angelo DV, Whitehead N, Helms K, Barfield W, Ahluwalia IB. Birth outcomes of intended pregnancies among women who used assisted reproductive technology, ovulation stimulation, or no treatment. Fertil Steril 2011;96:314–320.e2.
- Barradas DT, Barfield WD, Wright V, D'Angelo D, Manning SE, Schieve LA. Assessment of assisted reproductive technology use questions: pregnancy risk assessment monitoring system survey, 2004. Public Health Rep 2012;127:516–23.
- CDC. National public health action plan for the detection, prevention, and management of infertility. Atlanta, Georgia: CDC; 2014. Available at http://www.cdc.gov/reproductivehealth/Infertility/PDF/DRH_NAP_Final_508.pdf.
- Kissin DM, Jamieson DJ, Barfield WD. Assisted reproductive technology program reporting. JAMA 2011;306:2564.
- Mneimneh AS, Boulet SL, Sunderam S, et al.; States Monitoring ART (SMART) Collaborative. States Monitoring Assisted Reproductive Technology (SMART) Collaborative: data collection, linkage, dissemination, and use. J Womens Health (Larchmt) 2013;22:571–7.
* Data regarding population size was compiled on the basis of July 1, 2013 estimates from the U.S. Census Bureau.
† Eight states (Arkansas, Connecticut, Hawaii, Illinois, Maryland, Massachusetts, New Jersey, and Rhode Island) have mandates that cover at least one ART cycle. Seven states (California, Louisiana, Montana, New York, Ohio, Texas, and West Virginia) have insurance mandates that exclude IVF coverage. Information available at http://www.resolve.org/family-building-options/insurance_coverage/state-coverage.html.
§ SMART is a collaboration between CDC and state health departments in Connecticut, Florida, Massachusetts, and Michigan. Information is available at http://www.cdc.gov/art/smart/index.html.
FIGURE 1. Location and number* of assisted reproductive technology clinics — United States and Puerto Rico, 2013
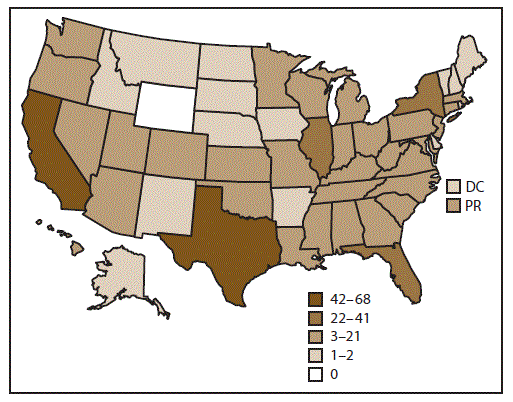
Abbreviations: DC = District of Columbia; PR = Puerto Rico.
* In 2013, of the 497 clinics in the United States, 467 (94%) submitted data.
Alternate text: This U.S. map shows the number of assisted reproductive technology clinics in each U.S. state, District of Columbia, and Puerto Rico for 2013. In total, 467 clinics (94% of all clinics) reported data and were included in the figure. Texas and California have the largest numbers of reporting clinics, between 42 and 68, respectively.
FIGURE 2. Number of outcomes of assisted reproductive technology procedures — United States and Puerto Rico, 2013
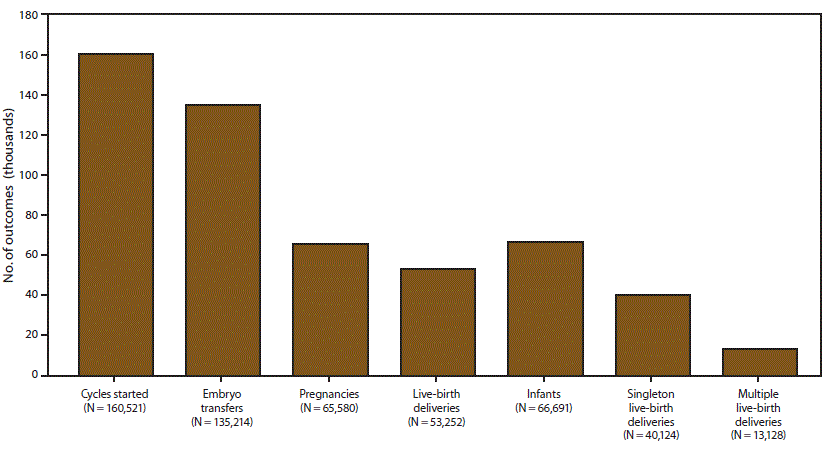
Alternate text: This bar graph presents the number of assisted reproductive technology procedures in the United States and Puerto Rico in 2013. The procedures indicated in the bar graph are cycles started, embryo transfers, pregnancies, live-birth deliveries, infants, singleton live-birth deliveries, and multiple live-birth deliveries. Of 160,521 cycles started, 65,580 women became pregnant, resulting in 66,691 infant births.
FIGURE 3. Number of reporting areas by number of procedures performed using assisted reproductive technology, among women of reproductive age* (15–44 years) — United States and Puerto Rico, 2013
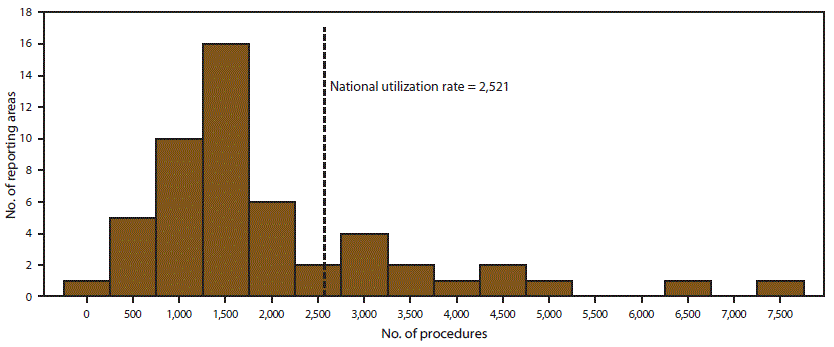
* Per 1 million women aged 15–44 years.
Alternate text: This histogram indicates the number of assisted reproductive technology procedures performed among women of reproductive age (per one million women) by number of reporting areas in the United States and Puerto Rico in 2013. Women of reproductive age are those aged 15-44 years. The national average utilization rate was 2,521 procedures per reporting area. The largest proportion of reporting areas (16 of 52) indicated performing 1,500 procedures in 2013.
|
TABLE 1. (Continued) Number* and outcomes of assisted reproductive technology procedures, by female patient's reporting area of residence† at time of treatment — United States and Puerto Rico, 2013 |
|||||||||
|---|---|---|---|---|---|---|---|---|---|
|
Patient's reporting |
No. of ART clinics§ |
No. of ART procedures performed |
No. of ART embryo transfer procedures¶ |
No. of ART pregnancies |
No. of ART live-birth deliveries |
No. of ART singleton live-birth deliveries |
No. of ART multiple live-birth deliveries |
No. of ART live-born infants |
ART procedures |
|
Ohio |
12 |
3,633 |
3,144 |
1,506 |
1,257 |
876 |
381 |
1,652 |
1,640.8 |
|
Oklahoma |
3 |
805 |
731 |
373 |
337 |
251 |
86 |
424 |
1,064.8 |
|
Oregon |
4 |
1,166 |
1,027 |
603 |
503 |
341 |
162 |
666 |
1,513.3 |
|
Pennsylvania†† |
19 |
6,076 |
5,039 |
2,357 |
1,914 |
1,467 |
447 |
2,366 |
2,516.4 |
|
Puerto Rico |
3 |
260 |
230 |
126 |
96 |
64 |
32 |
128 |
352.1 |
|
Rhode Island |
1 |
709 |
595 |
225 |
181 |
136 |
45 |
226 |
3,381.5 |
|
South Carolina |
4 |
1,198 |
1,021 |
514 |
428 |
306 |
122 |
553 |
1,278.9 |
|
South Dakota |
1 |
284 |
237 |
106 |
93 |
71 |
22 |
116 |
1,810.6 |
|
Tennessee |
8 |
1,362 |
1,126 |
572 |
466 |
350 |
116 |
586 |
1,058.1 |
|
Texas |
43 |
10,475 |
9,007 |
4,693 |
3,841 |
2,714 |
1,127 |
5,002 |
1,889.6 |
|
Utah |
3 |
1,361 |
1,171 |
625 |
533 |
345 |
188 |
720 |
2,161.1 |
|
Vermont |
1 |
239 |
199 |
89 |
79 |
55 |
24 |
104 |
2,054.4 |
|
Virginia |
13 |
6,019 |
4,809 |
2,217 |
1,743 |
1,408 |
335 |
2,082 |
3,590.2 |
|
Washington |
11 |
3,106 |
2,645 |
1,331 |
1,056 |
809 |
247 |
1,312 |
2,244.6 |
|
West Virginia |
3 |
262 |
224 |
98 |
84 |
64 |
20 |
105 |
773.7 |
|
Wisconsin |
7 |
1,634 |
1,453 |
728 |
622 |
454 |
168 |
792 |
1,503.4 |
|
Wyoming |
0 |
109 |
96 |
62 |
51 |
32 |
19 |
71 |
988.7 |
|
Nonresident |
NA |
4,099 |
3,497 |
1,874 |
1,549 |
1,145 |
404 |
1,958 |
—§§ |
|
Total |
467 |
160,521 |
135,214 |
65,580 |
53,252 |
40,124 |
13,128 |
66,691 |
2,520.8 |
|
Abbreviation: ART = assisted reproductive technology; NA = not applicable. * Excludes 27,564 egg/embryo-freezing and embryo-banking procedures, 2,655 oocyte thaw procedures, and 33 procedures performed in territories not included in this report. † In cases of missing residency data (approximately 1%), the patient's residence was assigned as the location in which the ART procedure was performed. § The ART procedures and outcomes by patient's reporting area of residence do not necessarily reflect the procedures and outcomes of the ART clinics within the reporting area, as some patients seek treatment at a clinic in a location other than their area of residence. ¶ Embryo transfer procedures include all procedures performed in which an attempt was made to transfer at least one embryo. ** Source: US Census Bureau, Population Division. Annual estimates of the resident population for selected age groups by sex for the United States, states, counties, and Puerto Rico Commonwealth and Municipios: April 1, 2010 to July 1, 2013. Washington, DC: US Census Bureau; 2013. Available at http://factfinder.census.gov/faces/tableservices/jsf/pages/productview.xhtml?pid=PEP_2013_PEPAGESEX&prodType=table. †† Residency information for procedures performed was missing in two states: Hawaii (7%) and Pennsylvania (3%). Overall, residency information was missing for 1,365 (0.9%) procedures performed and 569 (1.1%) live-birth deliveries. §§ Non-U.S. residents excluded from rate because the appropriate denominators were not available. |
|||||||||
|
TABLE 3. Number, proportion, and percentage of infants born with the use of assisted reproductive technology, by female patient's reporting area of residence* at time of treatment — United States and Puerto Rico, 2013† |
||||||
|---|---|---|---|---|---|---|
|
Patient's reporting area of residence |
Total no. |
No. ART |
Proportion of ART infants among all infants (%) |
Singleton infants among ART infants |
Singleton infants among all infants§ |
Proportion of ART singleton infants among all singleton infants (%) |
|
No. (%) |
No. (%) |
|||||
|
Alabama |
58,167 |
368 |
0.6 |
207 (56.3) |
56,167 (96.6) |
0.4 |
|
Alaska |
11,446 |
75 |
0.7 |
43 (57.3) |
11,111 (97.1) |
0.4 |
|
Arizona |
85,600 |
917 |
1.1 |
552 (60.2) |
83,034 (97.0) |
0.7 |
|
Arkansas |
37,832 |
203 |
0.5 |
112 (55.2) |
36,726 (97.1) |
0.3 |
|
California |
494,705 |
8,490 |
1.7 |
5,064 (59.6) |
478,635 (96.8) |
1.1 |
|
Colorado |
65,007 |
1,120 |
1.7 |
601 (53.7) |
62,850 (96.7) |
1.0 |
|
Connecticut |
36,085 |
1,174 |
3.3 |
692 (58.9) |
34,607 (95.9) |
2.0 |
|
Delaware |
10,831 |
186 |
1.7 |
148 (79.6) |
10,491 (96.9) |
1.4 |
|
District of Columbia |
9,288 |
366 |
3.9 |
271 (74.0) |
8,958 (96.4) |
3.0 |
|
Florida |
215,407 |
2,732 |
1.3 |
1,600 (58.6) |
208,393 (96.7) |
0.8 |
|
Georgia |
128,748 |
1,445 |
1.1 |
859 (59.4) |
124,370 (96.6) |
0.7 |
|
Hawaii¶ |
18,987 |
385 |
2.0 |
202 (52.5) |
18,350 (96.6) |
1.1 |
|
Idaho |
22,383 |
235 |
1.0 |
104 (44.3) |
21,635 (96.7) |
0.5 |
|
Illinois |
156,931 |
3,888 |
2.5 |
2,294 (59.0) |
150,793 (96.1) |
1.5 |
|
Indiana |
83,102 |
720 |
0.9 |
391 (54.3) |
80,268 (96.6) |
0.5 |
|
Iowa |
39,094 |
590 |
1.5 |
361 (61.2) |
37,747 (96.6) |
1.0 |
|
Kansas |
38,839 |
360 |
0.9 |
172 (47.8) |
37,508 (96.6) |
0.5 |
|
Kentucky |
55,686 |
540 |
1.0 |
275 (50.9) |
53,797 (96.6) |
0.5 |
|
Louisiana |
63,201 |
478 |
0.8 |
223 (46.7) |
60,862 (96.3) |
0.4 |
|
Maine |
12,776 |
149 |
1.2 |
85 (57.0) |
12,305 (96.3) |
0.7 |
|
Maryland |
71,953 |
2,076 |
2.9 |
1,457 (70.2) |
69,363 (96.4) |
2.1 |
|
Massachusetts |
71,788 |
3,442 |
4.8 |
2,278 (66.2) |
68,524 (95.5) |
3.3 |
|
Michigan |
113,489 |
1,381 |
1.2 |
770 (55.8) |
109,260 (96.3) |
0.7 |
|
Minnesota |
69,159 |
1,135 |
1.6 |
626 (55.2) |
66,672 (96.4) |
0.9 |
|
Mississippi |
38,634 |
171 |
0.4 |
98 (57.3) |
37,295 (96.5) |
0.3 |
|
Missouri |
75,296 |
864 |
1.1 |
454 (52.5) |
72,560 (96.4) |
0.6 |
|
Montana |
12,377 |
91 |
0.7 |
59 (64.8) |
12,005 (97.0) |
0.5 |
|
Nebraska |
26,095 |
270 |
1.0 |
138 (51.1) |
25,185 (96.5) |
0.5 |
|
Nevada |
35,030 |
462 |
1.3 |
256 (55.4) |
33,944 (96.9) |
0.8 |
|
New Hampshire |
12,396 |
291 |
2.3 |
194 (66.7) |
11,921 (96.2) |
1.6 |
|
New Jersey |
102,575 |
3,755 |
3.7 |
2,139 (57.0) |
97,940 (95.5) |
2.2 |
|
New Mexico |
26,354 |
153 |
0.6 |
81 (52.9) |
25,679 (97.4) |
0.3 |
|
New York |
236,980 |
6,455 |
2.7 |
3,922 (60.8) |
227,501 (96.0) |
1.7 |
|
North Carolina |
119,002 |
1,434 |
1.2 |
842 (58.7) |
114,854 (96.5) |
0.7 |
|
North Dakota |
10,599 |
117 |
1.1 |
56 (47.9) |
10,242 (96.6) |
0.5 |
|
Ohio |
138,936 |
1,607 |
1.2 |
858 (53.4) |
133,921 (96.4) |
0.6 |
|
Oklahoma |
53,369 |
402 |
0.8 |
243 (60.4) |
51,745 (97.0) |
0.5 |
|
Oregon |
45,155 |
658 |
1.5 |
337 (51.2) |
43,649 (96.7) |
0.8 |
|
Pennsylvania¶ |
140,921 |
2,179 |
1.5 |
1,369 (62.8) |
135,975 (96.5) |
1.0 |
|
Puerto Rico |
36,486 |
90 |
0.2 |
61 (67.8) |
35,847 (98.2) |
0.2 |
|
Rhode Island |
10,809 |
236 |
2.2 |
127 (53.8) |
10,398 (96.2) |
1.2 |
|
South Carolina |
56,795 |
444 |
0.8 |
240 (54.1) |
54,715 (96.3) |
0.4 |
|
South Dakota |
12,248 |
108 |
0.9 |
67 (62.0) |
11,885 (97.0) |
0.6 |
|
Tennessee |
79,992 |
551 |
0.7 |
326 (59.2) |
77,526 (96.9) |
0.4 |
|
Texas |
387,340 |
4,987 |
1.3 |
2,636 (52.9) |
374,672 (96.7) |
0.7 |
|
Utah |
50,957 |
718 |
1.4 |
379 (52.8) |
49,256 (96.7) |
0.8 |
|
Vermont |
5,975 |
79 |
1.3 |
53 (67.1) |
5,789 (96.9) |
0.9 |
|
Virginia |
102,147 |
1,894 |
1.9 |
1,280 (67.6) |
98,379 (96.3) |
1.3 |
|
Washington |
86,577 |
1,348 |
1.6 |
873 (64.8) |
83,763 (96.7) |
1.0 |
|
West Virginia |
20,825 |
117 |
0.6 |
78 (66.7) |
20,201 (97.0) |
0.4 |
|
Wisconsin |
66,649 |
803 |
1.2 |
433 (53.9) |
64,355 (96.6) |
0.7 |
|
Wyoming |
7,644 |
73 |
1.0 |
28 (38.4) |
7,376 (96.5) |
0.4 |
|
Total |
3,968,667 |
62,812 |
1.6 |
37,014 (58.9) |
3,831,004 (96.5) |
1.0 |
|
Abbreviation: ART = assisted reproductive technology. * In cases of missing residency data (approximately 1%), the patient's residence was assigned as the location in which the ART procedure was performed. † Includes infants conceived from ART procedures performed in 2012 and born in 2013, and infants conceived from ART procedures performed in 2013 and born in 2013. Total ART births exclude nonresidents. § (Source: Martin JA, Hamilton BE, Osterman MJK, Curtin SC, Mathews TJ. Births: final data for 2013. Natl Vital Stat Rep 2015;64:1–65. Available at http://www.ncbi.nlm.nih.gov/pubmed/25603115.) U.S. births include nonresidents. ¶ Residency information for procedures performed was missing in two states: Hawaii (7%) and Pennsylvania (3%). Overall, residency information was missing for 1,365 (0.9%) procedures performed and 569 (1.1%) live-birth deliveries. |
||||||
|
TABLE 4. (Continued) Number, percentage, and proportion of multiple-birth, twins, and triplets and higher order infants born with use of assisted reproductive technology procedure, by female patient's reporting area of residence* at time of treatment — United States and Puerto Rico, 2013† |
|||||||||
|---|---|---|---|---|---|---|---|---|---|
|
Patient's reporting area of residence |
Multiple-birth infants |
Twin infants |
Triplet and higher order infants |
||||||
|
ART infants§ |
All infants¶ |
Proportion |
ART infants§ |
All infants¶ |
Proportion of ART twin infants |
ART infants§ |
All infants¶ |
Proportion of ART triplet and higher order infants among all triplet and higher order infants (%) |
|
|
Ohio |
749 (46.6) |
5,015 (3.6) |
14.9 |
695 (43.2) |
4,794 (3.5) |
14.5 |
54 (3.4) |
221 (0.2) |
24.4 |
|
Oklahoma |
159 (39.6) |
1,624 (3.0) |
9.8 |
153 (38.1) |
1,578 (3.0) |
9.7 |
6 (1.5) |
46 (0.1) |
13.0 |
|
Oregon |
321 (48.8) |
1,506 (3.3) |
21.3 |
— (—)†† |
1,479 (3.3) |
—†† |
— (—)†† |
27 (0.1) |
—†† |
|
Pennsylvania¶¶ |
810 (37.2) |
4,946 (3.5) |
16.4 |
777 (35.7) |
4,793 (3.4) |
16.2 |
33 (1.5) |
153 (0.1) |
21.6 |
|
Puerto Rico |
29 (32.2) |
639 (1.8) |
4.5 |
29 (32.2) |
617 (1.7) |
4.7 |
0 (0) |
22 (0.1) |
0 |
|
Rhode Island |
109 (46.2) |
411 (3.8) |
26.5 |
— (—)†† |
396 (3.7) |
—†† |
— (—)†† |
15 (0.1) |
—††,§§ |
|
South Carolina |
204 (45.9) |
2,080 (3.7) |
9.8 |
192 (43.2) |
2,007 (3.5) |
9.6 |
12 (2.7) |
73 (0.1) |
16.4 |
|
South Dakota |
41 (38.0) |
363 (3.0) |
11.3 |
— (—)†† |
346 (2.8) |
—†† |
— (—)†† |
17 (0.1) |
—††,§§ |
|
Tennessee |
225 (40.8) |
2,466 (3.1) |
9.1 |
195 (35.4) |
2,377 (3.0) |
8.2 |
30 (5.4) |
89 (0.1) |
33.7 |
|
Texas |
2,351 (47.1) |
12,668 (3.3) |
18.6 |
2,259 (45.3) |
12,198 (3.1) |
18.5 |
92 (1.8) |
470 (0.1) |
19.6 |
|
Utah |
339 (47.2) |
1,701 (3.3) |
19.9 |
327 (45.5) |
1,635 (3.2) |
20.0 |
12 (1.7) |
66 (0.1) |
18.2 |
|
Vermont |
26 (32.9) |
186 (3.1) |
14.0 |
26 (32.9) |
186 (3.1) |
14.0 |
0 (0) |
0 (0) |
—** |
|
Virginia |
614 (32.4) |
3,768 (3.7) |
16.3 |
593 (31.3) |
3,609 (3.5) |
16.4 |
21 (1.1) |
159 (0.2) |
13.2 |
|
Washington |
475 (35.2) |
2,814 (3.3) |
16.9 |
456 (33.8) |
2,712 (3.1) |
16.8 |
19 (1.4) |
102 (0.1) |
18.6 |
|
West Virginia |
39 (33.3) |
624 (3.0) |
6.3 |
— (—)†† |
612 (2.9) |
—†† |
— (—)†† |
12 (0.1) |
—††,§§ |
|
Wisconsin |
370 (46.1) |
2,294 (3.4) |
16.1 |
349 (43.5) |
2,196 (3.3) |
15.9 |
21 (2.6) |
98 (0.1) |
21.4 |
|
Wyoming |
45 (61.6) |
268 (3.5) |
16.8 |
— (—)†† |
— (—)†† |
15.8 |
— (—)†† |
— (—)†† |
—††,§§ |
|
Total |
25,798 (41.1) |
137,663 (3.5) |
18.7 |
24,607 (39.2) |
132,941 (3.3) |
18.5 |
1,191 (1.9) |
4,722 (0.1) |
25.2 |
|
Abbreviation: ART = assisted reproductive technology. * In cases of missing residency data (approximately 1%), the patient's residence was assigned as the location in which the ART procedure was performed. † ART totals include infants conceived from ART procedures performed in 2012 and born in 2013 and infants conceived from ART procedures performed in 2013 and born in 2013. Total ART births exclude nonresidents. § Includes only the number of infants live-born in a multiple-birth delivery. For example, if three infants were born in a live-birth delivery and one of the three infants was stillborn, the total number of live born infants would be two. However, the two infants still would be counted as triplets. ¶ (Source: Martin JA, Hamilton BE, Osterman MJK, Curtin SC, Mathews TJ. Births: final data for 2013. Natl Vital Stat Rep 2015;64:1–65. Available at http://www.ncbi.nlm.nih.gov/pubmed/25603115.) U.S. births include nonresidents. ** Rates not calculated because N = 0 for the denominator. †† To protect confidentiality, cells with values from 1–4 are suppressed, as are data that can be used to derive cell values of 1–4. These values are included in totals. §§ Rates based on N = <20 in the denominator have been suppressed because such rates are considered unstable. ¶¶ Residency information for procedures performed was missing in two states: Hawaii (7%) and Pennsylvania (3%). Overall, residency information was missing for 1,365 (0.9%) procedures performed and 569 (1.1%) live-birth deliveries. |
|||||||||
|
TABLE 5. Number, percentage, and proportion of infants born with use of assisted reproductive technology,* by low birth weight category and female patient's reporting area of residence† at time of treatment — United States and Puerto Rico, 2013 |
||||||
|---|---|---|---|---|---|---|
|
Patient's reporting |
<2,500 g (LBW) |
<1,500 g (VLBW) |
||||
|
ART infants |
All infants§ |
Proportion of ART LBW infants among all LBW infants (%) |
ART infants |
All infants§ |
Proportion of ART VLBW infants among all VLBW infants (%) |
|
|
Alabama |
132 (36.6) |
5,805 (10.0) |
2.3 |
31 (8.6) |
1,215 (2.1) |
2.6 |
|
Alaska |
18 (24.7) |
658 (5.8) |
2.7 |
0 (0) |
110 (1.0) |
0 |
|
Arizona |
269 (29.9) |
5,897 (6.9) |
4.6 |
35 (3.9) |
919 (1.1) |
3.8 |
|
Arkansas |
73 (36.0) |
3,312 (8.8) |
2.2 |
19 (9.4) |
608 (1.6) |
3.1 |
|
California |
2,282 (27.7) |
33,753 (6.8) |
6.8 |
370 (4.5) |
5,683 (1.1) |
6.5 |
|
Colorado |
409 (37.1) |
5,718 (8.8) |
7.2 |
79 (7.2) |
844 (1.3) |
9.4 |
|
Connecticut |
333 (28.7) |
2,820 (7.8) |
11.8 |
60 (5.2) |
514 (1.4) |
11.7 |
|
Delaware |
34 (18.3) |
900 (8.3) |
3.8 |
7 (3.8) |
181 (1.7) |
3.9 |
|
District of Columbia |
74 (20.3) |
875 (9.4) |
8.5 |
11 (3.0) |
225 (2.4) |
4.9 |
|
Florida |
790 (29.8) |
18,346 (8.5) |
4.3 |
166 (6.3) |
3,266 (1.5) |
5.1 |
|
Georgia |
488 (34.0) |
12,064 (9.5) |
4.0 |
74 (5.2) |
2,350 (1.8) |
3.1 |
|
Hawaii¶ |
137 (36.3) |
1,562 (8.2) |
8.8 |
23 (6.1) |
263 (1.4) |
8.7 |
|
Idaho |
85 (36.2) |
1,545 (6.9) |
5.5 |
12 (5.1) |
243 (1.1) |
4.9 |
|
Illinois |
1,098 (28.4) |
12,898 (8.2) |
8.5 |
203 (5.3) |
2,319 (1.5) |
8.8 |
|
Indiana |
217 (30.2) |
6,569 (7.9) |
3.3 |
41 (5.7) |
1,157 (1.4) |
3.5 |
|
Iowa |
148 (25.1) |
2,561 (6.6) |
5.8 |
18 (3.1) |
451 (1.2) |
4.0 |
|
Kansas |
114 (32.6) |
2,721 (7.0) |
4.2 |
24 (6.9) |
484 (1.2) |
5.0 |
|
Kentucky |
186 (34.8) |
4,845 (8.7) |
3.8 |
37 (6.9) |
833 (1.5) |
4.4 |
|
Louisiana |
202 (42.6) |
6,901 (10.9) |
2.9 |
32 (6.8) |
1,302 (2.1) |
2.5 |
|
Maine |
34 (23.8) |
911 (7.1) |
3.7 |
8 (5.6) |
152 (1.2) |
5.3 |
|
Maryland |
501 (24.2) |
6,088 (8.5) |
8.2 |
102 (4.9) |
1,156 (1.6) |
8.8 |
|
Massachusetts |
830 (24.4) |
5,505 (7.7) |
15.1 |
137 (4.0) |
944 (1.3) |
14.5 |
|
Michigan |
414 (30.1) |
9,331 (8.2) |
4.4 |
89 (6.5) |
1,794 (1.6) |
5.0 |
|
Minnesota |
286 (25.3) |
4,398 (6.4) |
6.5 |
40 (3.5) |
792 (1.1) |
5.1 |
|
Mississippi |
61 (35.7) |
4,458 (11.5) |
1.4 |
13 (7.6) |
827 (2.1) |
1.6 |
|
Missouri |
264 (31.2) |
6,033 (8.0) |
4.4 |
42 (5.0) |
1,019 (1.4) |
4.1 |
|
Montana |
31 (34.1) |
913 (7.4) |
3.4 |
7 (7.7) |
110 (0.9) |
6.3 |
|
Nebraska |
83 (30.7) |
1,682 (6.4) |
4.9 |
20 (7.4) |
294 (1.1) |
6.8 |
|
Nevada |
136 (30.2) |
2,810 (8.0) |
4.8 |
16 (3.5) |
445 (1.3) |
3.6 |
|
New Hampshire |
68 (23.5) |
841 (6.8) |
8.1 |
7 (2.4) |
141 (1.1) |
5.0 |
|
New Jersey |
1,145 (30.9) |
8,469 (9.9) |
13.5 |
195 (5.3) |
1,571 (1.8) |
12.4 |
|
New Mexico |
61 (40.7) |
2,333 (8.9) |
2.6 |
13 (8.7) |
346 (1.3) |
3.8 |
|
New York |
1,616 (26.3) |
18,847 (8.0) |
8.6 |
239 (3.9) |
3,210 (1.4) |
7.4 |
|
North Carolina |
427 (29.9) |
10,432 (8.8) |
4.1 |
91 (6.4) |
2,001 (1.7) |
4.5 |
|
North Dakota |
38 (32.5) |
679 (6.4) |
5.6 |
— (—)** |
126 (1.2) |
—** |
|
Ohio |
508 (31.8) |
11,808 (8.5) |
4.3 |
99 (6.2) |
2,207 (1.6) |
4.5 |
|
Oklahoma |
140 (34.9) |
4,297 (8.1) |
3.3 |
21 (5.2) |
732 (1.4) |
2.9 |
|
Oregon |
187 (28.7) |
2,841 (6.3) |
6.6 |
8 (1.2) |
442 (1.0) |
1.8 |
|
Pennsylvania¶ |
576 (26.7) |
11,219 (8.0) |
5.1 |
107 (5.0) |
2,006 (1.4) |
5.3 |
|
Puerto Rico |
33 (36.7) |
3,846 (10.5) |
0.9 |
8 (8.9) |
471 (12.2) |
1.7 |
|
Rhode Island |
62 (27.0) |
746 (6.9) |
8.3 |
13 (5.7) |
142 (1.3) |
9.2 |
|
South Carolina |
151 (34.5) |
5,496 (9.7) |
2.7 |
27 (6.2) |
1,057 (1.9) |
2.6 |
|
South Dakota |
30 (27.8) |
766 (6.3) |
3.9 |
— (—)** |
120 (1.0) |
—** |
|
Tennessee |
182 (33.2) |
7,307 (9.1) |
2.5 |
58 (10.6) |
1,320 (1.7) |
4.4 |
|
Texas |
1,684 (34.3) |
32,159 (8.3) |
5.2 |
326 (6.6) |
5,322 (1.4) |
6.1 |
|
Utah |
221 (30.9) |
3,567 (7.0) |
6.2 |
32 (4.5) |
507 (1.0) |
6.3 |
|
Vermont |
17 (22.1) |
401 (6.7) |
4.2 |
— (—)** |
52 (0.9) |
—** |
|
Virginia |
445 (23.9) |
8,182 (8.0) |
5.4 |
76 (4.1) |
1,559 (1.5) |
4.9 |
|
Washington |
338 (25.3) |
5,547 (6.4) |
6.1 |
54 (4.0) |
908 (1.0) |
5.9 |
|
West Virginia |
37 (31.6) |
1,955 (9.4) |
1.9 |
6 (5.1) |
254 (1.2) |
2.4 |
|
Wisconsin |
220 (27.8) |
4,668 (7.0) |
4.7 |
38 (4.8) |
846 (1.3) |
4.5 |
|
Wyoming |
31 (42.5) |
660 (8.6) |
4.7 |
5 (6.8) |
89 (1.2) |
5.6 |
|
Total |
17,946 (29.1) |
307,365 (8.0) |
5.8 |
3,148 (5.1) |
54,492 (1.4) |
5.8 |
|
Abbreviations: ART = assisted reproductive technology; LBW = low birth weight; VLBW = very low birth weight. * ART totals include infants conceived from ART procedures performed in 2012 and born in 2013 and infants conceived from ART procedures performed in 2013 and born in 2013. Total ART infants exclude nonresidents and include only infants with birthweight data available. † In cases of missing residency data (approximately 1%), the patient's residence was assigned as the location in which the ART procedure was performed. § (Source: Martin JA, Hamilton BE, Osterman MJK, Curtin SC, Mathews TJ. Births: final data for 2013. Natl Vital Stat Rep 2015;64:1–65. Available at http://www.ncbi.nlm.nih.gov/pubmed/25603115.) U.S. births include nonresidents and infants with birthweight data available. ¶ Residency information for procedures performed was missing in two states: Hawaii (7%) and Pennsylvania (3%). Overall, residency information was missing for 1,365 (0.9%) procedures performed and 569 (1.1%) live-birth deliveries. ** To protect confidentiality, cells with values from 1–4 are suppressed, as are data that can be used to derive cell values of 1–4. These values are included in totals. |
||||||
|
TABLE 6. Number, percentage, and proportion of infants born with use of assisted reproductive technology,* by preterm gestational age category and female patient's reporting area of residence† at time of treatment — United States and Puerto Rico, 2013 |
||||||
|---|---|---|---|---|---|---|
|
Patient's reporting area of residence |
<37 weeks (PTB) |
<32 weeks (VPTB) |
||||
|
ART infants |
All infants§ |
Proportion of ART PTB infants among all PTB infants (%) |
ART infants |
All infants§ |
Proportion of ART VPTB infants among all VPTB infants (%) |
|
|
Alabama |
146 (40.1) |
8,780 (15.1) |
1.7 |
28 (7.7) |
1,899 (3.3) |
1.5 |
|
Alaska |
22 (29.3) |
1,146 (10.0) |
1.9 |
— (—)¶ |
171 (1.5) |
—¶ |
|
Arizona |
292 (32.1) |
9,959 (11.6) |
2.9 |
50 (5.5) |
1,439 (1.7) |
3.5 |
|
Arkansas |
82 (40.8) |
4,801 (12.7) |
1.7 |
21 (10.4) |
779 (2.1) |
2.7 |
|
California |
2,686 (31.9) |
43,627 (8.8) |
6.2 |
466 (5.5) |
6,702 (1.4) |
7.0 |
|
Colorado |
452 (40.6) |
6,669 (10.3) |
6.8 |
94 (8.4) |
1,075 (1.7) |
8.7 |
|
Connecticut |
358 (30.7) |
3,545 (9.8) |
10.1 |
63 (5.4) |
644 (1.8) |
9.8 |
|
Delaware |
47 (25.4) |
1,343 (12.4) |
3.5 |
5 (2.7) |
258 (2.4) |
1.9 |
|
District of Columbia |
81 (22.3) |
1,232 (13.3) |
6.6 |
16 (4.4) |
265 (2.9) |
6.0 |
|
Florida |
947 (34.8) |
29,174 (13.5) |
3.2 |
195 (7.2) |
4,624 (2.1) |
4.2 |
|
Georgia |
528 (36.7) |
16,319 (12.7) |
3.2 |
91 (6.3) |
3,074 (2.4) |
3.0 |
|
Hawaii** |
156 (41.1) |
2,382 (12.5) |
6.5 |
26 (6.8) |
377 (2.0) |
6.9 |
|
Idaho |
101 (43.0) |
2,340 (10.5) |
4.3 |
15 (6.4) |
366 (1.6) |
4.1 |
|
Illinois |
1,227 (31.7) |
18,426 (11.7) |
6.7 |
237 (6.1) |
3,361 (2.1) |
7.1 |
|
Indiana |
279 (38.8) |
9,132 (11.0) |
3.1 |
45 (6.3) |
1,526 (1.8) |
2.9 |
|
Iowa |
184 (31.2) |
4,322 (11.1) |
4.3 |
30 (5.1) |
803 (2.1) |
3.7 |
|
Kansas |
146 (40.6) |
4,199 (10.8) |
3.5 |
25 (6.9) |
642 (1.7) |
3.9 |
|
Kentucky |
230 (42.7) |
7,031 (12.6) |
3.3 |
35 (6.5) |
1,230 (2.2) |
2.8 |
|
Louisiana |
242 (50.7) |
9,542 (15.1) |
2.5 |
36 (7.5) |
1,843 (2.9) |
2.0 |
|
Maine |
44 (29.9) |
1,190 (9.3) |
3.7 |
10 (6.8) |
200 (1.6) |
5.0 |
|
Maryland |
586 (28.3) |
8,536 (11.9) |
6.9 |
116 (5.6) |
1,567 (2.2) |
7.4 |
|
Massachusetts |
954 (27.8) |
7,158 (10.0) |
13.3 |
149 (4.3) |
1,145 (1.6) |
13.0 |
|
Michigan |
513 (37.4) |
13,211 (11.6) |
3.9 |
105 (7.6) |
2,446 (2.2) |
4.3 |
|
Minnesota |
350 (30.8) |
6,806 (9.8) |
5.1 |
49 (4.3) |
1,131 (1.6) |
4.3 |
|
Mississippi |
76 (44.4) |
6,397 (16.6) |
1.2 |
12 (7.0) |
1,111 (2.9) |
1.1 |
|
Missouri |
325 (37.7) |
8,514 (11.3) |
3.8 |
45 (5.2) |
1,349 (1.8) |
3.3 |
|
Montana |
31 (34.1) |
1,304 (10.5) |
2.4 |
12 (13.2) |
196 (1.6) |
6.1 |
|
Nebraska |
101 (37.4) |
2,756 (10.6) |
3.7 |
29 (10.7) |
448 (1.7) |
6.5 |
|
Nevada |
183 (39.6) |
4,410 (12.6) |
4.1 |
24 (5.2) |
665 (1.9) |
3.6 |
|
New Hampshire |
83 (28.9) |
1,115 (9.0) |
7.4 |
13 (4.5) |
186 (1.5) |
7.0 |
|
New Jersey |
1,309 (35.1) |
11,802 (11.5) |
11.1 |
226 (6.1) |
2,105 (2.1) |
10.7 |
|
New Mexico |
67 (43.8) |
3,062 (11.6) |
2.2 |
11 (7.2) |
415 (1.6) |
2.7 |
|
New York |
1,839 (28.6) |
25,378 (10.7) |
7.2 |
339 (5.3) |
4,076 (1.7) |
8.3 |
|
North Carolina |
463 (32.4) |
14,286 (12.0) |
3.2 |
107 (7.5) |
2,939 (2.5) |
3.6 |
|
North Dakota |
45 (38.5) |
1,049 (9.9) |
4.3 |
— (—)¶ |
189 (1.8) |
—¶ |
|
Ohio |
583 (36.4) |
16,727 (12.0) |
3.5 |
104 (6.5) |
3,203 (2.3) |
3.2 |
|
Oklahoma |
168 (42.1) |
6,819 (12.8) |
2.5 |
36 (9.0) |
1,026 (1.9) |
3.5 |
|
Oregon |
207 (31.6) |
4,212 (9.3) |
4.9 |
15 (2.3) |
611 (1.4) |
2.5 |
|
Pennsylvania** |
667 (30.7) |
15,040 (10.7) |
4.4 |
126 (5.8) |
2,765 (2.0) |
4.6 |
|
Puerto Rico |
31 (34.4) |
5,519 (15.1) |
0.6 |
6 (6.7) |
825 (2.3) |
0.7 |
|
Rhode Island |
70 (29.7) |
1,101 (10.2) |
6.4 |
18 (7.6) |
198 (1.8) |
9.1 |
|
South Carolina |
194 (43.8) |
7,806 (13.7) |
2.5 |
42 (9.5) |
1,462 (2.6) |
2.9 |
|
South Dakota |
39 (36.1) |
1,324 (10.8) |
2.9 |
8 (7.4) |
209 (1.7) |
3.8 |
|
Tennessee |
212 (38.6) |
10,076 (12.6) |
2.1 |
63 (11.5) |
1,616 (2.0) |
3.9 |
|
Texas |
2,014 (40.6) |
47,611 (12.3) |
4.2 |
382 (7.7) |
7,391 (1.9) |
5.2 |
|
Utah |
262 (36.7) |
5,180 (10.2) |
5.1 |
36 (5.0) |
666 (1.3) |
5.4 |
|
Vermont |
20 (25.3) |
485 (8.1) |
4.1 |
— (—)¶ |
68 (1.1) |
—¶ |
|
Virginia |
570 (30.2) |
11,249 (11.0) |
5.1 |
91 (4.8) |
2,059 (2.0) |
4.4 |
|
Washington |
394 (29.4) |
8,399 (9.7) |
4.7 |
65 (4.8) |
1,300 (1.5) |
5.0 |
|
West Virginia |
52 (44.4) |
2,597 (12.5) |
2.0 |
7 (6.0) |
383 (1.8) |
1.8 |
|
Wisconsin |
307 (38.4) |
6,908 (10.4) |
4.4 |
46 (5.8) |
1,117 (1.7) |
4.1 |
|
Wyoming |
34 (46.6) |
884 (11.2) |
3.8 |
5 (6.8) |
144 (1.9) |
3.5 |
|
Total |
20,999 (33.6) |
452,880 (11.4) |
4.6 |
3,783 (6.1) |
76,289 (1.9) |
5.0 |
|
Abbreviations: ART = assisted reproductive technology; PTB = preterm birth; VPTB = very preterm birth. * ART totals include infants conceived from ART procedures performed in 2012 and born in 2013 and infants conceived from ART procedures performed in 2013 and born in 2013. Total ART births exclude nonresidents and include only infants with gestational age data available. † In cases of missing residency data (approximately 1%), the patient's residence was assigned as the location in which the ART procedure was performed. § (Source: Martin JA, Hamilton BE, Osterman MJK, Curtin SC, Mathews TJ. Births: final data for 2013. Natl Vital Stat Rep 2015;64:1–65. Available at http://www.ncbi.nlm.nih.gov/pubmed/25603115.) U.S. births include nonresidents and infants with gestational age data available. ¶ To protect confidentiality, cells with values from 1–4 are suppressed, as are data that can be used to derive cell values of 1–4. These values are included in totals. ** Residency information for procedures performed was missing in two states: Hawaii (7%) and Pennsylvania (3%). Overall, residency information was missing for 1,365 (0.9%) procedures performed and 569 (1.1%) live-birth deliveries. |
||||||
|
TABLE 7. (Continued) Percentages of low birth weight infants (<2,500 g) among infants born with assisted reproductive technology* and all U.S. infants, by plurality and female patient's reporting area of residence† at time of treatment — United States and Puerto Rico, 2013 |
||||||
|---|---|---|---|---|---|---|
|
Patient's reporting |
ART |
All |
ART |
All |
ART triplets and higher order infants¶ (%) |
All triplets and higher order infants§ (%) |
|
Ohio |
8.9 |
6.7 |
55.0 |
54.6 |
96.3 |
94.5 |
|
Oklahoma |
13.6 |
6.5 |
66.7 |
57.3 |
—** |
100.0 |
|
Oregon |
8.4 |
4.8 |
49.7 |
49.7 |
—**,†† |
NA |
|
Pennsylvania¶¶ |
9.0 |
6.3 |
55.2 |
53.6 |
100.0 |
100.0 |
|
Puerto Rico |
19.7 |
9.6 |
72.4 |
63.7 |
—§§ |
81.8 |
|
Rhode Island |
5.6 |
5.2 |
51.0 |
48.5 |
—**,†† |
—** |
|
South Carolina |
8.0 |
7.7 |
65.4 |
59.5 |
—** |
100.0 |
|
South Dakota |
—†† |
4.9 |
60.5 |
50.1 |
—**,†† |
—** |
|
Tennessee |
9.6 |
7.5 |
62.1 |
59.6 |
100.0 |
100.0 |
|
Texas |
9.5 |
6.5 |
60.6 |
58.8 |
100.0 |
97.6 |
|
Utah |
10.8 |
5.4 |
52.3 |
53.6 |
—** |
100.0 |
|
Vermont |
—†† |
5.3 |
54.2 |
51.6 |
—§§ |
—§§ |
|
Virginia |
9.5 |
6.2 |
53.2 |
54.4 |
—** |
95.6 |
|
Washington |
7.9 |
4.9 |
55.7 |
51.4 |
—** |
92.2 |
|
West Virginia |
11.5 |
7.8 |
69.4 |
60.7 |
—**,†† |
—** |
|
Wisconsin |
8.4 |
5.4 |
50.1 |
50.6 |
61.9 |
100.0 |
|
Wyoming |
—†† |
6.7 |
64.3 |
61.1 |
—**,†† |
—** |
|
Total |
9.0 |
6.3 |
56.3 |
55.3 |
93.6 |
94.2 |
|
Abbreviations: ART = assisted reproductive technology; NA = not available. * ART totals include infants conceived from ART procedures performed in 2012 and born in 2013 and infants conceived from ART procedures performed in 2013 and born in 2013. Total ART births exclude nonresidents and only include infants with birthweight data available. † In cases of missing residency data (approximately 1%), the patient's residence was assigned as the location in which the ART procedure was performed. § (Source: Martin JA, Hamilton BE, Osterman MJK, Curtin SC, Mathews TJ. Births: final data for 2013. Natl Vital Stat Rep 2015;64:1–65. Available at http://www.ncbi.nlm.nih.gov/pubmed/25603115.) U.S. births include nonresidents and include infants with birthweight data available. ¶ Includes only the number of infants live-born in a multiple-birth delivery. For example, if three infants were born in a live-birth delivery and one of the three infants was stillborn, the total number of live-born infants would be two. However, the two infants still would be counted as triplets. ** Rates based on N = <20 in the denominator have been suppressed because such rates are considered unstable. †† To protect confidentiality, cells with values from 1–4 are suppressed, as are data that can be used to derive cell values of 1–4. These values are included in totals. §§ Rate not calculated because N = 0 for the denominator. ¶¶ Residency information for procedures performed was missing in two states: Hawaii (7%) and Pennsylvania (3%). Overall, residency information was missing for 1,365 (0.9%) procedures performed and 569 (1.1%) live-birth deliveries. |
||||||
|
TABLE 8. (Continued) Percentages of preterm (<37 weeks) infants among infants born with the use of assisted reproductive technology* and all U.S. infants, by plurality and female patient's reporting area of residence† at time of treatment — United States and Puerto Rico, 2013 |
||||||
|---|---|---|---|---|---|---|
|
Patient's reporting |
ART |
All |
ART |
All |
ART triplets and higher order infants ¶ (%) |
All triplets and higher order infants§ (%) |
|
Ohio |
13.2 |
10.3 |
60.0 |
57.7 |
100.0 |
90.5 |
|
Oklahoma |
17.8 |
11.2 |
78.8 |
61.5 |
—†† |
93.5 |
|
Oregon |
13.1 |
7.8 |
50.3 |
53.3 |
—**,†† |
88.9 |
|
Pennsylvania¶¶ |
13.1 |
9.0 |
59.1 |
55.0 |
100.0 |
94.1 |
|
Puerto Rico |
16.4 |
14.2 |
72.4 |
64.2 |
—§§ |
81.8 |
|
Rhode Island |
8.7 |
8.5 |
52.8 |
51.8 |
—**,†† |
—†† |
|
South Carolina |
15.9 |
11.8 |
75.0 |
63.3 |
—†† |
90.4 |
|
South Dakota |
—** |
9.5 |
63.2 |
51.4 |
—**,†† |
—†† |
|
Tennessee |
15.1 |
11.0 |
68.2 |
62.5 |
100.0 |
100.0 |
|
Texas |
14.8 |
10.6 |
68.4 |
59.6 |
100.0 |
94.5 |
|
Utah |
14.9 |
8.4 |
59.7 |
61.8 |
—†† |
86.4 |
|
Vermont |
—** |
6.8 |
61.5 |
48.9 |
—§§ |
—§§ |
|
Virginia |
13.2 |
9.3 |
64.6 |
54.1 |
—†† |
89.3 |
|
Washington |
11.2 |
8.2 |
61.2 |
53.5 |
—†† |
88.2 |
|
West Virginia |
26.9 |
10.8 |
77.8 |
64.4 |
—**,†† |
—†† |
|
Wisconsin |
14.1 |
8.6 |
64.8 |
58.2 |
100.0 |
90.8 |
|
Wyoming |
—** |
9.6 |
71.4 |
65.7 |
—**,†† |
—†† |
|
Total |
13.3 |
10.1 |
61.0 |
56.6 |
97.5 |
93.0 |
|
Abbreviations: ART = assisted reproductive technologies. * ART totals include infants conceived from ART procedures performed in 2012 and born in 2013 and infants conceived from ART procedures performed in 2013 and born in 2013. Total ART births exclude nonresidents and includes only infants with gestational age data available. † In cases of missing residency data (approximately 1%), the patient's residence was assigned as the location in which the ART procedure was performed. § (Source: Martin JA, Hamilton BE, Osterman MJK, Curtin SC, Mathews TJ. Births: final data for 2013. Natl Vital Stat Rep 2015;64:1–65. Available at http://www.ncbi.nlm.nih.gov/pubmed/25603115.) U.S. births include nonresidents and infants with gestational age data available. ¶ Includes only the number of infants live-born in a multiple-birth delivery. For example, if three infants were born in a live-birth delivery and one of the three infants was stillborn, the total number of live-born infants would be two. However, the two infants still would be counted as triplets. ** To protect confidentiality, cells with values from 1–4 are suppressed, as are data that can be used to derive cell values of 1–4. These values are included in totals. †† Rates based on N = <20 in the denominator have been suppressed because such rates are considered unstable. §§ Rate not calculated because N = 0 for the denominator. ¶¶ Residency information for procedures performed was missing in two states: Hawaii (7%) and Pennsylvania (3%). Overall, residency information was missing for 1,365 (0.9%) procedures performed and 569 (1.1%) live-birth deliveries. |
||||||
Use of trade names and commercial sources is for identification only and does not imply endorsement by the U.S. Department of
Health and Human Services.
References to non-CDC sites on the Internet are
provided as a service to MMWR readers and do not constitute or imply
endorsement of these organizations or their programs by CDC or the U.S.
Department of Health and Human Services. CDC is not responsible for the content
of pages found at these sites. URL addresses listed in MMWR were current as of
the date of publication.
All MMWR HTML versions of articles are electronic conversions from typeset documents.
This conversion might result in character translation or format errors in the HTML version.
Users are referred to the electronic PDF version (http://www.cdc.gov/mmwr)
and/or the original MMWR paper copy for printable versions of official text, figures, and tables.
An original paper copy of this issue can be obtained from the Superintendent of Documents, U.S.
Government Printing Office (GPO), Washington, DC 20402-9371;
telephone: (202) 512-1800. Contact GPO for current prices.
**Questions or messages regarding errors in formatting should be addressed to
mmwrq@cdc.gov.
