Persons using assistive technology might not be able to fully access information in this file. For assistance, please send e-mail to: mmwrq@cdc.gov. Type 508 Accommodation and the title of the report in the subject line of e-mail.
Surveillance of Influenza Vaccination Coverage — United States, 2007–08 Through 2011–12 Influenza Seasons
Corresponding author: Peng-jun Lu, Immunization Services Division, National Center for Immunization and Respiratory Diseases, CDC. Telephone: 404-639-8844; E-mail: lhp8@cdc.gov.
Abstract
Problem/Condition: Substantial improvement in annual influenza vaccination of recommended groups is needed to reduce the health effects of influenza and reach Healthy People 2020 targets. No single data source provides season-specific estimates of influenza vaccination coverage and related information on place of influenza vaccination and concerns related to influenza and influenza vaccination.
Reporting Period: 2007–08 through 2011–12 influenza seasons.
Description of Systems: CDC uses multiple data sources to obtain estimates of vaccination coverage and related data that can guide program and policy decisions to improve coverage. These data sources include the National Health Interview Survey (NHIS), the Behavioral Risk Factor Surveillance System (BRFSS), the National Flu Survey (NFS), the National Immunization Survey (NIS), the Immunization Information Systems (IIS) eight sentinel sites, Internet panel surveys of health-care personnel and pregnant women, and the Pregnancy Risk Assessment and Monitoring System (PRAMS).
Results: National influenza vaccination coverage among children aged 6 months–17 years increased from 31.1% during 2007–08 to 56.7% during the 2011–12 influenza season as measured by NHIS. Vaccination coverage among children aged 6 months–17 years varied by state as measured by NIS. Changes from season to season differed as measured by NIS and NHIS. According to IIS sentinel site data, full vaccination (having either one or two seasonal influenza vaccinations, as recommended by the Advisory Committee on Immunization Practices for each influenza season, based on the child's influenza vaccination history) with up to two recommended doses for the 2011–12 season was 27.1% among children aged 6 months–8 years and was 44.3% for the youngest children (aged 6–23 months).
Influenza vaccination coverage among adults aged ≥18 years increased from 33.0% during 2007–08 to 38.3% during the 2011–12 influenza season as measured by NHIS. Vaccination coverage by age group for the 2011–12 season as measured by BRFSS was <5 percentage points different from NHIS estimates, whereas NFS estimates were 6–8 percentage points higher than BRFSS estimates. Vaccination coverage among persons aged ≥18 years varied by state as measured by BRFSS. For adults aged ≥18 years, a doctor's office was the most common place for receipt of influenza vaccination (38.4%, BRFSS; 32.5%, NFS) followed by a pharmacy (20.1%, BRFSS; 19.7%, NFS). Overall, 66.9% of health-care personnel (HCP) reported having been vaccinated during the 2011–12 season, as measured by an Internet panel survey of HCP, compared with 62.4%, as estimated through NHIS. Vaccination coverage among pregnant women was 47.0%, as measured by an Internet panel survey of women pregnant during the influenza season, and 43.0%, as measured by BRFSS during the 2011–12 influenza season. Overall, as measured by NFS, 86.8% of adults aged ≥18 years rated the influenza vaccine as very or somewhat effective, and 46.5% of adults aged ≥18 years believed their risk for getting sick with influenza if unvaccinated was high or somewhat high.
Interpretation: During the 2011–12 season, influenza vaccination coverage varied by state, age group, and selected populations (e.g., HCP and pregnant women), with coverage estimates well below the Healthy People 2020 goal of 70% for children aged 6 months–17 years, 70% for adults aged ≥18 years, and 90% for HCP.
Public Health Actions: Continued efforts are needed to encourage health-care providers to offer influenza vaccination and to promote public health education efforts among various populations to improve vaccination coverage. Ongoing surveillance to obtain coverage estimates and information regarding other issues related to influenza vaccination (e.g., knowledge, attitudes, and beliefs) is needed to guide program and policy improvements to reduce morbidity and mortality associated with influenza by increasing vaccination rates. Ongoing comparisons of telephone and Internet panel surveys with in-person surveys such as NHIS are needed for appropriate interpretation of data and resulting public health actions. Examination of results from all data sources is necessary to fully assess the various components of influenza vaccination coverage among different populations in the United States.
Introduction
Seasonal influenza is associated with substantial morbidity and mortality in the United States (1–5). Rates for serious illness and death are higher among adults aged ≥65 years, children aged <2 years, pregnant women, and persons of any age who have medical conditions that place them at increased risk for influenza complications (1). The economic impact of influenza illness is substantial (1,2,6,7). One national study estimated the annual economic cost of seasonal influenza in the United States to be $87.1 billion, including $10.4 billion in direct medical costs (7). The estimated economic impact of an influenza pandemic is $71.3–$166.5 billion (8).
Annual influenza vaccinations are the most effective method for preventing influenza and its complications. In addition, influenza vaccinations are cost-effective (6,9–19). Since the 2010–11 influenza season, the Advisory Committee on Immunization Practices (ACIP) has recommended that persons aged ≥6 months receive annual vaccinations with the most up-to-date influenza strains predicted on the basis of viral surveillance data (2). Before 2010, only persons aged ≥50 years, pregnant women, persons aged 18–49 years with medical conditions that place them at high risk for influenza complications, health-care personnel (HCP), and children aged 6 months–17 years were recommended for annual vaccination (1,2,20). Healthy People 2020 objectives and targets have been established to highlight the need for increased influenza vaccination coverage for all persons aged ≥6 months (21).
Influenza vaccinations for HCP are important to reduce transmission of influenza in health-care settings and reduce the risk for influenza outbreaks and deaths among patients in nursing homes (22,23). Since 1984, ACIP has recommended an annual influenza vaccination for HCP (1,2,22,24). Pregnant women and their infants are at increased risk for serious influenza-related complications, including premature labor, premature birth, low birthweight for gestational age, hospitalization, and maternal and fetal death (25–29). Vaccination of mothers with influenza vaccine can decrease the risk for influenza-related illness in mothers and decrease the risk for influenza illness and influenza-related hospitalization among infants aged <6 months (27–29). Recommendations for influenza vaccination of pregnant women have changed over time (30–33). In 2004, ACIP recommended that all women who are or will be pregnant during an influenza season should be vaccinated, regardless of trimester (33).
Previous studies have shown that vaccination coverage has been suboptimal (1,34–46). Ongoing surveillance of influenza vaccination is neded to determine vaccination coverage levels during each season, trends in coverage by season, and populations with lagging coverage by geographic region, socioeconomic status, health-care access and use, and influenza risk status. Information on type of place the influenza vaccination was received and knowledge, attitudes, and beliefs related to influenza and influenza vaccination help identify barriers to and facilitators of vaccination. This information allows vaccination programs to identify those who need vaccination and better identify and support vaccination services. This information is used to monitor progress toward national Healthy People 2020 objectives for influenza vaccination (21), provide datas to assess the safety of influenza vaccination (47–49), and model the level of influenza-associated morbidity and mortality, including morbidity and mortality prevented by influenza vaccination (50,51).
Timely and season-specific estimates are needed to manage rapid influenza vaccination program planning. Estimates from one season need to be available in time to evaluate and plan for the next season. Timely within-season estimates are needed to check the progress of the seasonal vaccination campaign and encourage continued vaccination. Frequent, weekly, or monthly estimates are needed in urgent public health situations, such as during a season with a vaccine shortage (38,52) or an influenza pandemic (39–41,53,54). During rapid or urgent public health responses, trade-offs might be made in validity to achieve timeliness (e.g., by using telephone or Internet panel surveys instead of in-person surveys that use an address-based sample frame). Some bias in estimating vaccination coverage levels might result; however, these data are still useful to vaccination programs for evaluating trends and identifying population subgroups with lower coverage (35–38). To evaluate vaccine safety or the impact of influenza vaccination, a higher degree of validity might be required because bias in coverage levels could lead to overestimation or underestimation of vaccine safety and impact.
No single source can collect all the data needed to assess vaccination coverage, safety, and other factors, such as vaccine acceptance. The multiple demands for influenza vaccination assessment data have led to use of various data sources, reporting periods, and analytic methods to meet information needs. This can confuse those who use the surveillance information as they consider which estimates to use to meet their needs. The National Health Interview Survey (NHIS) provides national estimates used for monitoring Healthy People 2020 objectives but is less timely than other data sources (e.g., the Behavioral Risk Factor Surveillance System [BRFSS] and Internet panel surveys). NHIS has the most comprehensive set of ancillary information on health-care access, use, and insurance that can be used to assess factors associated with influenza vaccination.
Vaccination Coverage (Population-Based Surveys or Systems)
- National estimates of influenza vaccination coverage for persons aged ≥6 months: National Immunization Survey (NIS), NHIS, and BRFSS
- State-specific estimates of influenza vaccination coverage for persons aged ≥6 months: NIS and BRFSS
- National estimates for within-season estimates and postseason estimates for children and adults and knowledge, attitudes, and beliefs regarding influenza vaccination among adults: National Flu Survey (NFS)
- Estimates to assess full coverage (having either one or two seasonal influenza vaccinations, as recommended by ACIP for each influenza season, based on the child's influenza vaccination history) with up to 2 influenza vaccination doses among children aged <9 years as recommended based on previous influenza vaccination history: sentinel Immunization Information Systems (IIS)
Special Populations: Vaccination Coverage and Knowledge, Attitudes, and Beliefs (Internet Surveys, Telephone Surveys, and Population-Based Surveys)
- State-level estimates for women who are pregnant during influenza season in selected states: Pregnancy Risk Assessment Monitoring System (PRAMS)
- National estimates of influenza vaccination coverage and knowledge, attitudes, and beliefs regarding influenza vaccination among HCP and pregnant women: Internet panel surveys
Place of Vaccination (Population-Based Surveys)
- Estimates of types of places children aged 6 months–17 years received influenza vaccinations: NIS
- Estimates of types of places adults aged ≥18 years received influenza vaccinations: BRFSS
- Estimates of types of places children and adults received influenza vaccinations: NFS
The findings in this report indicate that continued efforts are needed to encourage health-care providers to offer influenza vaccination and to promote public health education efforts among various populations to improve vaccination coverage. Health departments and other vaccination providers should increase access to vaccination at work and school locations, pharmacies and stores, and other nonmedical sites, and physicians and clinics should implement proven strategies for improving vaccination coverage (e.g., office-based protocols, including reminder/recall notification and standing orders). Ongoing surveillance to obtain coverage estimates and information regarding other issues related to influenza vaccination (e.g., knowledge, attitudes, and beliefs) is needed to guide program and policy improvements to reduce morbidity and mortality associated with influenza by increasing vaccination rates.
Methods
To describe current approaches for assessment of influenza vaccination coverage, attitudes toward influenza and vaccination, and place of vaccination, CDC summarized the data sources and analytic methods used. Uses of these data are described by summarizing estimates from the 2011–12 influenza season (and other seasons when data were available). Estimates across data sources are compared, and results are interpreted, taking into account strengths and limitations of estimates across data sources. Various surveys and surveillance systems were used to assess influenza vaccination during several influenza seasons (Table 1).
Estimates of Season-Specific Influenza Vaccination Coverage
Traditionally, estimates of influenza vaccination prevalence as measured by BRFSS and NHIS are calculated from interview data collected during the calendar year and measured the proportion of persons reporting influenza vaccination during the 12 months preceding the survey. Influenza vaccinations for a given season can start as early as July, although typically by the following February or March; however, they might continue into the following June (when influenza vaccines for the season usually expire). Therefore, annual estimates represent a weighted average of incomplete estimates for up to three influenza seasons. For example, using 2012 interview data with a recall period of the previous 12 months, a prevalence estimate of influenza vaccination during the previous 12 months would reflect only later vaccinations for the 2010–11 season, biased assessment of the 2011–12 season, and only early vaccinations for the 2012–13 season.
Other approaches, such as changing the time from calendar year to seasonal year, have been used to better estimate season-specific influenza vaccination coverage. These approaches included restricting estimates based on interviews conducted in the postvaccination period (e.g., March–June) and assessing influenza vaccinations during the previous 12 months or since the beginning of the vaccination period, based on self-report or parental report of month and year of most recent influenza vaccination. These approaches do not use all relevant data, decrease precision, and do not account for censoring of later season vaccinations. For example, a person interviewed in March might be vaccinated in April but be counted as unvaccinated for the influenza season.
In this report, a nonparametric Kaplan-Meier survival analysis approach is used to estimate season-specific influenza vaccination coverage for surveys with ongoing data collection throughout the vaccination period. This approach uses interviews conducted during the vaccination period (typically August–June) to estimate the cumulative monthly proportion of persons in the population vaccinated by the end of each month during July–May, based on self-report or parental report of month and year of influenza vaccination. This method has been used by CDC for season-specific estimates starting with the 2009–10 influenza season (39,41,53). Advantages of this approach include 1) using all relevant data to maximize precision; 2) using data collected during the vaccination period that likely has more accurate recall of vaccinations than interview data collected months after vaccination; 3) providing monthly estimates useful for program planning and needed for evaluation of vaccine safety and vaccine impact on morbidity and mortality; and 4) providing more statistically stable estimates by week or month during an urgent public health response (e.g., vaccine shortage or influenza pandemic vaccination campaign) when ongoing within-season estimates are needed.
Comparing estimates from BRFSS using the traditional calendar year data with previous 12-month vaccination period and season-specific Kaplan-Meier estimates, the difference in influenza vaccination coverage for adults aged ≥18 years ([previous 12-month prevalence] – [season-specific prevalence]) was -0.2 percentage points for the 2007–08 season, -1.4 percentage points for 2008–09, and 1.5 percentage points for 2009–10. Larger differences were observed when stratified by adult age group (Figure 1). For ease of analysis or when season-specific estimates are not needed, the calendar year data with previous 12-month vaccination period method has been used to calculate estimates; however, these estimates might differ from season-specific estimates and might lead to spurious conclusions about season-specific trends.
Statistical Analyses
Statistical software was used to calculate point estimates and 95% confidence intervals (CIs) for all data sources except IIS and the Internet panel surveys (55). The t test for linear trends was used for data sources with multiple seasons of data. Differences in estimates between the most recent two influenza seasons were assessed with a t test. All tests were two-tailed, with the significance level set at α<0.05. Estimates were suppressed for sample sizes <30, and CIs with half-widths >10 were considered unreliable. CIs and tests of difference were not calculated for IIS and Internet panel surveys because these are not probability samples and statistical tests are not recommended for opt-in Internet panel samples based on self-selected participation rather than random probability samples (56).
Data Sources
National Health Interview Survey
NHIS is a continuous, cross-sectional national household survey of the civilian, noninstitutionalized population in the United States that is conducted by CDC (38,57). In-person interviews are conducted throughout the year in a probability sample of households. NHIS data are compiled and released annually. The survey objective is to monitor the health of the nation and provide estimates of health indicators, health-care use and access, and health-related behaviors (38,57).
Influenza vaccination status was assessed by asking a sample adult, or knowledgeable parent for a sample child, if the adult and the sample child had received an influenza vaccination during the previous 12 months and which month and year the vaccination was received. Persons were categorized as HCP if they were adults aged ≥18 years who currently volunteered or worked in a hospital, medical clinic, doctor's office, dentist's office, nursing home, or other health-care facility, including those who provided part-time and unpaid work and professional nursing care in the home. NHIS data were used to assess vaccination among children aged 6 months–17 years, adults aged ≥18 years, and HCP. The data were not used to assess vaccination coverage among pregnant women because pregnancy status during the influenza vaccination season could not be determined.
Influenza vaccination coverage was assessed by age group and race/ethnicity. To better estimate season-specific influenza vaccination coverage, the Kaplan-Meier survival analysis procedure was used to estimate data from persons interviewed during September–June to estimate vaccinations received during August–May. Vaccination month and year were imputed for 3%–5% of persons who did not report their month and year of vaccination. Information was imputed from donor pools matched for week of interview, age group, region of residence, and race/ethnicity.
Behavioral Risk Factor Surveillance System
BRFSS is a continuous, random, population-based telephone survey of noninstitutionalized adults aged ≥18 years in all 50 states and the District of Columbia (DC). Data are collected monthly by state health departments in collaboration with CDC. The objective of BRFSS is to collect uniform, state-specific data on self-reported preventive health practices and risk behaviors that are linked to preventable infectious diseases, chronic diseases, and injuries. Data are weighted by age, sex, and, in some areas, race/ethnicity, to reflect each area's estimated adult population (58). Beginning in 2011, surveys included landline and cellular telephone households and used a new method for weighting (59).
Influenza vaccination status was assessed by asking respondents whether they had received an influenza vaccine during the previous 12 months and which month and year the vaccination was received. Influenza vaccination was assessed by age group and race/ethnicity. BRFSS data were used to assess national and state-specific vaccination, place of vaccination among adults aged ≥18 years, and coverage among pregnant women.
Season-specific influenza vaccination coverage was estimated as described for NHIS. Estimates for the 2011–12 season were based on the landline and cellular telephone samples and new weighting methods. Therefore, BRFSS estimates for the 2011–12 season are not directly comparable to estimates from previous seasons. To provide more timely season-specific estimates, CDC produced interim monthly or quarterly weighted BRFSS data sets.
Pregnancy status was assessed among women aged 18–44 years by asking whether, to their knowledge, they were pregnant at the time of interview. To better approximate women who were pregnant during an influenza season, analyses were restricted to pregnant women interviewed during December–February of a given season; for example, for the 2011–2012 season, analysis was restricted to respondents interviewed during December 2011–February 2012 (43). Vaccination month and year were imputed for 3.5%–7.3% persons who did not report their month and year of vaccination. Information was imputed from donor pools matched for week of interview, age group, region of residence, and race/ethnicity.
National Immunization Survey
NIS is an ongoing, national, list-assisted, random-digit–dialed, dual-frame landline and cellular telephone survey of households with children aged 19–35 months or 13–17 years (NIS-Teen) at the time of interview. The NIS objective is to monitor vaccination coverage among children and teenagers in the United States. For children aged 6–18 months and 3–12 years identified during screening households for NIS and NIS-Teen, an influenza vaccination module was added in fall of 2009. Data were weighted to represent the population of children in the United States (60,61). In October 2010, NIS began using a dual-frame telephone survey; before October 2010, NIS used a landline telephone survey only.
Influenza vaccination status was assessed by asking respondents aged ≥18 years if their child had received an influenza vaccination since July 1, and if so, in which month and year. Interviews during September–June were used for analyses and included influenza vaccinations received during August–May, with estimation based on the Kaplan-Meier survival analysis procedure. Influenza vaccination was assessed by age groups and race/ethnicity. NIS data were used to assess national and state-specific vaccination coverage and place of vaccination among children aged 6 months–17 years. NIS data collected for children aged 19–35 months and 13–17 years were followed by a mail survey of all of the children's vaccination providers (identified by the household respondent) to obtain vaccination histories, including influenza vaccination since birth. For the subset of children aged 6–23 months during the influenza season (62) in NIS for which adequate provider data were obtained, these provider data were used to determine full vaccination coverage based on the ACIP recommendation for children to receive either 1 or 2 doses based on their age and history of vaccination in previous influenza seasons (62).
National Flu Survey
NFS was conducted four times to rapidly assess influenza vaccination coverage in the United States: in November and March of the 2010–11 and 2011–12 influenza seasons. The November surveys provided early-season influenza vaccination estimates and intent to get vaccinated, and the March surveys provided late-season influenza vaccination estimates and detailed data regarding knowledge, attitudes, and beliefs. NFS was conducted using a list-assisted random-digit–dialed sample of landline and cellular telephones. Data were weighted to represent the population in the United States. Respondents were asked about current influenza season vaccination status, place of vaccination, and opinions related to influenza vaccination (63).
Influenza vaccination was assessed by age group and race/ethnicity. NFS data are used to assess vaccination coverage and place of vaccination among persons aged ≥6 months and knowledge, attitudes, and beliefs related to influenza vaccine among adults aged ≥18 years. This report includes results from the March 2011 and 2012 NFS.
Immunization Information Systems Sentinel Site Project
IIS is a confidential, computerized, population-based system that collects and consolidates vaccination data from participating vaccination providers. The objective is to provide a tool for clinical decision-making at the level of the health-care provider and data to help vaccination programs identify populations at high risk for vaccine-preventable diseases and target interventions and resources efficiently. IIS sentinel site results are not intended to be representative of or generalizable to vaccination practices in the United States; however, IIS contain timely, provider-verified data, and sentinel site data are complementary to other sources of influenza vaccination coverage, such as NIS.
For the 2008–2012 IIS sentinel site project period, CDC awarded supplemental funds to eight IIS to enhance data quality at the sites and to analyze data routinely to monitor vaccination practices and coverage among persons aged <19 years in the sentinel site geographic regions (46). Among these eight sentinel sites, six sites in Arizona, Colorado, Michigan, Minnesota, Oregon, and Wisconsin were subsets of the entire state; the other two sentinel sites were of the entire state of North Dakota and all of New York City, New York.
For this report, IIS sentinel site data were used to examine the percentage of children aged 6 months–8 years who were fully vaccinated in each influenza season from the 2007–08 through 2011–12 seasons.
HCP Internet Panel Survey
The HCP Internet panel survey was initiated as part of the influenza A(H1N1) pdm09 (pH1N1) pandemic response. The objective is to provide rapid national influenza vaccination coverage and information on knowledge, attitudes, and beliefs related to vaccination and nonvaccination among HCP. For each influenza season, the survey is administered twice to different respondents: an early-season survey (conducted in November) and late-season survey (conducted in April). The sampling method has been described previously (42,64).
Influenza vaccination status was assessed by asking respondents if they had received an influenza vaccination since August. Influenza vaccination was assessed by occupation, work setting, availability of an employer vaccination policy, and major demographic variables. The Internet panel survey is used to assess vaccination coverage; knowledge, attitudes, and behaviors related to vaccination; and reasons for not receiving a vaccination. Samples were weighted based on each occupational group by age, sex, race/ethnicity, health-care setting, and census region to be more generalizable to the U.S. population of HCP (42).
Internet Panel Survey of Pregnant Women
The Internet panel survey of pregnant women has been conducted since the 2010–11 influenza season. The objective is to provide rapid national influenza vaccination coverage and information on knowledge, attitudes, and beliefs related to vaccination and nonvaccination among pregnant women. For each influenza season, the survey is administered twice to different respondents: an early-season survey (conducted in November) and late-season survey (conducted in April). Women aged 18–49 years who were pregnant at any time since August 1 of the given influenza season were recruited for participation; the sampling method has been described previously (43–45).
Influenza vaccination status was assessed by asking respondents if they had received an influenza vaccination since August 1. Pregnancy status questions included whether respondents were currently pregnant or pregnant at any time since August 1. All respondents were asked if they had seen a doctor or other medical professional since August; those answering "yes" were asked if their doctor or another medical professional had recommended or offered them an influenza vaccination since August. This report includes results from the April 2011 and 2012 surveys. Analysis of the April 2012 survey was restricted to women who reported that they were pregnant at any time from October 1, 2011, through January 31, 2012 (43,44). Influenza vaccination was assessed by stage of pregnancy, age, race/ethnicity, and health-care provider recommendation for and offer of vaccination. Samples were weighted to reflect the age, race/ethnicity, and geographic distribution of the total U.S. population of pregnant women (43,44).
Pregnancy Risk Assessment Monitoring System
PRAMS is an ongoing population-based survey. Data on a wide range of maternal behaviors and experiences before, during, and after pregnancy among women who recently delivered a live-born infant are used to monitor and improve the health of mothers and infants. PRAMS surveys are administered by 40 states and New York City, New York. The surveys consist of monthly stratified random samples of 100–300 women per state/city with recent live-born infants sampled from the state birth certificate registries. The selected mothers are mailed a questionnaire 2–6 months after delivery, and those who do not respond by mail are contacted by telephone. The PRAMS sampling method has been described previously (65).
PRAMS is used to assess national and state-specific vaccination coverage among pregnant women starting with the 2009–10 season. In this report, the analysis was restricted to women who had a live birth during September 2009–May 2010 and September 2010–May 2011. Seasonal influenza vaccination status was determined by asking respondents if they received influenza vaccinations during the current influenza season.
Results
Influenza Vaccination (≥1 Dose) Among Children Aged 6 Months–17 Years
Overall Trends
Influenza vaccination coverage among children aged 6 months–17 years increased significantly from 31.1% in the 2007–08 influenza season to 56.7% in the 2011–12 season as measured by NHIS (test for trend, p<0.05) (Figure 2). Coverage increased from the 2009–10 season to the 2010–11 season but did not increase from the 2010–11 season to the 2011–12 season as measured by NIS. Compared with the 2010–11 season, a significant increase in coverage occurred during the 2011–12 season (NHIS, 9.8 percentage points; NFS, 9.3 percentage points). Vaccination coverage for the 2011–12 season was highest based on NHIS data (56.7%) and NFS data (55.5%), with a lower estimate based on NIS data (51.5%) (Table 2).
Age and Race/Ethnicity, 2011–12 Influenza Season
Vaccination coverage was highest among children aged 6–23 months, with a range of 70.5% (NFS) to 77.1% (NHIS). Coverage decreased with age; the lowest coverage was found among children aged 13–17 years, with a range of 33.7% (NIS) to 43.4% (NHIS) (Table 2).
Vaccination coverage during the 2011–12 season among non-Hispanic blacks for most age groups (6 months–17 years, 5–12 years, and 13–17 years) and Hispanics in all age groups was significantly higher than among non-Hispanic whites as measured by NIS. Vaccination coverage among non-Hispanic blacks and Hispanics was similar compared with non-Hispanic whites as measured by NHIS (Table 2). As measured by NFS, among children overall and for age groups ≤4 years, Hispanics had higher coverage than non-Hispanic whites.
State Variations, 2011–12 Season
Influenza vaccination coverage among children aged 6 months–17 years for the 2011–12 season varied substantially by state. Vaccination coverage ranged from 38.8% in Alaska to 73.8% in Rhode Island, with a median of 50.9% as measured by NIS (Figure 3).
Full Influenza Vaccination with 1 or 2 Recommended Doses Among Children Aged 6 Months–8 Years
As measured by IIS sentinel site data, full vaccination coverage among children aged 6 months–8 years increased from 22.2% in the 2008–09 season to 27.1% in the 2011–12 season and decreased with increasing age (Figure 4). Among children aged 6–23 months, full vaccination coverage based on IIS sentinel site data was 35.9% for 2010–11 and 44.3% for 2011–12 and was 36.0% for the 2010–11 season as measured by NIS (Table 3).
Reported Place of Influenza Vaccination Among Children Aged 6 Months–17 Years
For children aged 6 months–17 years, a doctor's office was the most common place for receipt of influenza vaccine (64.9%, NIS; 64.2%, NFS) with a clinic/health center or other medical place the next most common (18.3%, NIS; 18.9%, NFS) (Table 4). The percentage of vaccinations reported received at school (4.4%) was lower by two percentage points in 2011–12 compared with the 2010–11 season (NIS). A doctor's office was the most common place for receipt of influenza vaccine for children aged 6–23 months (73.6%, NIS; 71.7%, NFS), 2–4 years (69.7%, NIS; 72.4%, NFS), 5–12 years (63.2%, NIS; 64.1%, NFS), and 13–17 years (58.3%, NIS; 53.4%, NFS). The percentage of vaccinated children receiving vaccination at pharmacies or schools was higher among children aged 5–17 years than among younger children (Table 4).
Influenza Vaccination Coverage Among Adults Aged ≥18 Years
Trends Overall and by Age Group
Overall, influenza vaccination coverage among adults aged ≥18 years increased from 33.0% in the 2007–08 season to 38.3% in the 2011–12 season as measured by NHIS (test for trend, p<0.05) (Figure 5). As measured by BRFSS, coverage among adults aged ≥18 years was 37.2% in 2007–08 and 38.8% in 2011–12. Compared with the 2010–11 season, a significant increase in coverage in the 2011–12 season occurred as measured by NFS data (4.4 percentage points), whereas a significant decrease occurred as measured by BRFSS data (1.7 percentage points) (Table 5).
Influenza vaccination coverage in 2011–12 increased with increasing age as measured by all three data sources (e.g., NHIS, ranging from 26.1% among adults aged 18–49 years, to 44.0% for adults aged 50–64 years, to 69.4% for adults aged ≥65 years). Compared with the 2010–11 season, coverage in the 2011–12 season was about two percentage points lower for each of these age groups as measured by BRFSS and similar for each age group as measured by NHIS. As measured by NFS, coverage among adults 18–49 years increased 7.2 percentage points from 2010–11 to 2011–12.
Vaccination coverage for the 2011–12 season as measured by BRFSS was less than 5 percentage points different from NHIS estimates by age group (Table 5). NFS estimates by age group were 6–8 percentage points higher than BRFSS estimates.
Race/Ethnicity, 2011–12 Influenza Season
Vaccination coverage among non-Hispanic blacks and Hispanics was significantly lower than among non-Hispanic whites as measured by NHIS and BRFSS for most age groups (NHIS: ≥18 years, 18–64 years, and ≥65 years for non-Hispanic blacks, all age groups for Hispanics; BRFSS: all age groups for non-Hispanic blacks, all age groups for Hispanics except for ≥65 years). Vaccination coverage among non-Hispanic blacks for all age groups and Hispanics for two age groups (≥18 years and 18–64 years) was significantly lower compared with non-Hispanic whites as measured by NFS (Table 5).
State Variations, 2011–12 Influenza Season
Influenza vaccination coverage among adults aged ≥18 years varied substantially by state as measured by BRFSS. Vaccination coverage ranged from 28.3% in Nevada to 48.9% in South Dakota, with a median of 40.8% (Figure 6).
Place of Influenza Vaccination Among Adults Aged ≥18 Years
Among adults aged ≥18 years for the 2011–12 season, a doctor's office was the most common place of vaccination reported in BRFSS (38.4%) and NFS (32.5%), followed by a pharmacy (20.1%, BRFSS; 19.7%, NFS) (Table 6). The third most common place was at a workplace (17.6%, BRFSS; 13.8%, NFS). Among vaccinated adults aged 18–49 years, reported vaccination at a doctor's office, at a workplace, or at a pharmacy was 30.1%, 28.0%, and 14.6% as measured by BRFSS and was 27.4%, 17.2%, and 15.6% as measured by NFS, respectively. The most commons places for adults aged 50–64 years to report receiving a vaccination were at a doctor's office (38.2%, BRFSS; 32.4%, NFS), at a workplace (20.3%, BRFSS; 19.6%, NFS), and at a pharmacy (18.8%, BRFSS; 17.9%, NFS). Among adults aged ≥65 years, the most common place was a doctor's office (49.1%, BRFSS; 41.4%, NFS); the second most common place was a pharmacy (28.4%, BRFSS; 28.7%, NFS).
Adult Knowledge and Attitudes Related to Influenza Vaccination, 2011–12 Influenza Season
Overall, as measured by NFS, 86.8% adults aged ≥18 years rated the influenza vaccine as very or somewhat effective, 46.5% believed their risk for getting influenza if unvaccinated was high or somewhat high, 89.3% rated the influenza vaccine as very or somewhat safe, and 29.6% worried about getting the influenza illness from the influenza vaccination (Table 7).
The percentages of adults aged ≥18 years who rated influenza vaccine as very or somewhat effective, believed their risk for getting ill with influenza if unvaccinated was high or somewhat high, and rated the influenza vaccine as very or somewhat safe were significantly higher among those who were vaccinated than among those who were unvaccinated. The percentage of adults aged ≥18 years who worried about getting influenza illness from the influenza vaccination was significantly lower among those who were vaccinated than among those who were unvaccinated.
A total of 46.8% of adults correctly reported being in the groups recommended to receive an influenza vaccination; knowledge was higher among those who were vaccinated (66.4%) than among those who were not vaccinated (30.4%) (Table 7). Among adults, 72.8% had visited a physician during the influenza season; vaccinated adults were more likely to have visited a physician (82.9%) than those who were not vaccinated (64.4%). Among adults with a physician visit, 43.8% reported receiving a recommendation for an influenza vaccination at the visit; vaccinated adults were more likely to have received a recommendation (60.3%) than those who were not vaccinated (26.2%). Prevalence of the belief that influenza vaccine was very or somewhat effective, the risk for getting ill with influenza if unvaccinated was high or somewhat high, influenza vaccine was very or somewhat safe, and being very or somewhat worried that influenza vaccination can cause influenza illness varied by demographic characteristics. Influenza vaccination coverage was typically higher among adults with those beliefs compared with those without (except for the belief that vaccine caused influenza illness) (Table 8, Table 9, and Table 10).
Influenza Vaccination Among HCP
Overall, 66.9% of HCP reported having been vaccinated in the 2011–12 influenza season as measured by an Internet panel survey. Coverage was 62.4% in the 2011–12 season among HCP as measured by NHIS (Figure 7). Overall, influenza vaccination coverage among HCP increased significantly from 47.6% in the 2007–08 season to 62.4% in the 2011–12 season as measured by NHIS (test for trend, p<0.05). Coverage among HCP did not substantially increase from 2009–10 through 2011–12 as measured by the Internet panel surveys.
As measured by Internet panel surveys, vaccination coverage in the 2011–12 season was 76.9% among HCP working in hospitals, 67.7% among those in physician offices, and 52.4% among those in long-term care facilities (Table 11). By occupation, vaccination coverage was 85.6% among physicians, 81.5% among nurse practitioners and physician assistants, 77.9% among nurses, 64.8% among other clinical personnel, and 59.3% among nonclinical staff members. Coverage among HCP aged ≥65 years (74.7%) was higher than coverage for other age groups. Among racial/ethnic groups, coverage did not differ by more than 5 percentage points.
As measured by Internet panel surveys, approximately 44% of HCP reported that their employers had a vaccination policy requiring (21%) or recommending (23%) influenza vaccination. Vaccination coverage was higher among HCP whose employer had a vaccination policy (84.3%) compared with those whose employers did not (52.7%) (Table 11). Among HCP with an employer policy, vaccination coverage was 91.0% among physicians, 87.7% among nurse practitioners and physician assistants, 85.0% among other clinical personnel, 83.6% among nurses, and 83.2% among nonclinical personnel, which were higher than HCP without an employer policy (79.8% for physicians, 75.6% for nurse practitioners and physician assistants, 68.1% for nurses, 52.7% for other clinical personnel, and 41.7% for nonclinical personnel). A higher percentage of facilities with an employer vaccination policy offered vaccination at no cost (63.2%) than did facilities without an employer's policy (36.8%) (Table 11).
Vaccination coverage among HCP varied according to knowledge, attitudes, and beliefs by occupation and work setting (Table 12 and Table 13). Among various occupational groups and work settings, influenza vaccination was higher among HCP who believed that influenza was a serious threat to their own health, that getting a vaccination would better protect persons around them, and that vaccination was safe. Among the occupations and work settings, coverage was lowest (47.5%) among HCP who believed the vaccination could cause some persons to get influenza.
Influenza Vaccination Among Pregnant Women
Influenza vaccination coverage among pregnant women as measured by BRFSS increased from 26.9% in the 2007–2008 season to 43.0% in the 2011–12 season (test for trend, p<0.05) (Figure 8). Coverage among pregnant women as measured by Internet panel surveys was 49.0% in the 2010–11 season and 47.0% in the 2011–12 season. As measured by PRAMS, the estimated median influenza vaccination coverage was 47.1% in the 2009–10 season (ranging from 26.1% in Florida to 67.9% in Minnesota) and 54.8% in the 2010–11 season (ranging from 32.6% in Georgia to 75.9% in Minnesota).
As measured by the Internet panel survey of the 2011–12 season, 9.9% of pregnant women were vaccinated before pregnancy, 36.5% during pregnancy, and 0.6% after pregnancy (44). Vaccination coverage by trimester of pregnancy was similar among those who reported being vaccinated during pregnancy (10.1% during the first trimester, 12.6% during the second, and 11.8% during the third). Coverage among pregnant women aged 25–49 years was higher (49.4%) than among pregnant women aged 18–24 years (42.3%). Non-Hispanic black women had lower vaccination coverage (39.8%) than Hispanic women (48.8%), non-Hispanic white women (47.9%), and other non-Hispanic women (53.7%) (44). Among 925 (53.6%) women who received a health-care provider recommendation to be vaccinated, 81.6% were offered vaccination during a health-care provider visit, and 73.6% reported receiving an influenza vaccination. The percentage that reported vaccination was substantially higher than that for 181 (9.9%) women whose health-care provider recommended but did not offer vaccination (47.9%) and for the 413 (26.4%) women who did not receive either a health-care provider recommendation or offer (11.1%).
Compared with women whose health-care provider did not offer vaccination, women who reported receiving a vaccination recommendation from a health-care provider were more likely to report positive attitudes about the effectiveness of influenza vaccination (80.8% versus 52.4%), safety of influenza vaccination for pregnant women (80.6% versus 41.8%), and safety of vaccination for their infants (77.2% versus 35.0%) (Table 14). In addition, women who received a recommendation from a health-care provider consistently had higher vaccination levels than those who did not receive a recommendation from a health-care provider, regardless of their perceptions of vaccination safety or effectiveness. Moreover, women with a negative attitude toward vaccination who had received a vaccination recommendation from health-care provider were generally more likely to be vaccinated than women who had a positive attitude but did not receive a health-care provider recommendation (Table 14).
Obstetrician and midwife offices were the most common place for receipt of influenza vaccine among pregnant women (41.3%), followed by nonobstetrical HCP offices (20.7%) and hospitals, clinics, or health centers (17.5%) (Table 15). Other places for vaccination included pharmacies, drug stores, or grocery stores (8.0%); the health department (4.1%); the workplace; school; and other places (8.3%). Women who were vaccinated during pregnancy were more likely to report receiving the vaccination at their obstetrician's or midwife's office (52.9%) than women who reported being vaccinated before or after pregnancy (15.9%).
Among pregnant women who did not receive a vaccination, the two most common reasons were concerns about safety (44.4%) and efficacy of the vaccine (19.1%). Other reasons included health reasons (9.1%), tangible barriers (7.9%, including "not covered by insurance/don't have insurance," "the flu vaccine costs too much," "copay cost too much," "don't have time/don't know where to go/who to call," and "the vaccination was not available"), perceived susceptibility to influenza (7.5%, including those who reported "I do not need the vaccination" and "I don't get very sick or can treat it"), psychosocial reasons (6.4%, including "against religious/spiritual belief" and "I am afraid of needles/shots"), and other reasons (5.4%) (Table 16).
Discussion
Overall, influenza vaccination coverage among children aged 6 months–17 years and adults aged ≥18 years increased significantly during five influenza seasons through 2011–12. Vaccination coverage by age group was highest for adults aged ≥65 years but has not increased over the past five seasons through 2011–12. Influenza vaccination coverage in the 2011–12 season varied by age and risk group and remains suboptimal in all groups. Racial/ethnic differences in influenza vaccination among adults persisted. Considerable variation in vaccination coverage by state also continued. In 2011–12, most children received influenza vaccinations in a doctor's office or clinic/health center, whereas nearly 40% of adults were vaccinated at a pharmacy or their workplace. In 2011–12, most adults (87%) rated influenza vaccine as very or somewhat effective, 47% believed their chance or risk for getting ill with influenza if unvaccinated was high or somewhat high, and 30% were worried they could get influenza from the influenza vaccine.
Children
Vaccination coverage among children aged 6 months–17 years steadily increased from the 2007–08 through 2011–12 seasons, a finding that might reflect expansion of ACIP recommendations for children during this period. In 2006, ACIP expanded the recommendation for annual influenza vaccination to include all children aged 6–59 months. Beginning with the 2008–09 influenza season, the recommendation for annual influenza vaccination was expanded to include all children aged 6 months–17 years (20,66). As measured by available data from IIS sentinel sites data and NIS with vaccination histories from health-care providers, compliance with recommendations for receipt of 2 doses of influenza vaccination among children aged 6 months–8 years (depending on past influenza vaccination history) (62) is low. Health-care providers should remind parents to return their child for the second dose to achieve maximal protection from influenza vaccination.
Overall trends in influenza vaccination coverage among children aged 6 months–17 years were similar as measured by data from NIS and NHIS. Some differences were noted by data source in estimated changes in coverage from one season to the next, suggesting that caution should be used in the interpretation of short-term trends as measured by NIS. Random variation also contributes to difference in coverage estimates generated by each data source. CIs for NIS estimates were smaller than for NHIS. No racial/ethnic disparities with reference to non-Hispanic whites were noted using data from NHIS; however, NIS data indicate that Hispanic and non-Hispanic black children had higher coverage than non-Hispanic white children in 2011–12.
Adults
Although trends in influenza vaccination coverage among adults varied somewhat by data source, coverage remained low and relatively stable from 2007–08 through 2011–12 (33% to 39% as measured by BRFSS and NHIS). Trends in BRFSS estimates are complicated by possible increases in selection (i.e., noncoverage) bias because its sample frame missed more households with only cellular telephones and the switch to a dual landline and cellular telephone frame with improved weighting methods that affected the 2011–12 season influenza vaccination coverage estimates. Thus, the 2 percentage point decrease in BRFSS influenza vaccination coverage estimates from 2010–11 to 2011–12 seasons is difficult to interpret and might be a result, at least partly, of the changes in methods. With this discontinuity in methods, assessment of trends using BRFSS data should start with 2011–12 season estimates and go forward. This change in methods underscores the importance of ongoing comparisons of BRFSS estimates to other surveys without method changes during this time period, such as NHIS. BRFSS estimates were usually ≤5 percentage points higher than NHIS estimates by age group, whereas NFS estimates for 2011–12 were 6–8 percentage points higher than BRFSS.
Vaccination coverage among adults was lowest in the youngest group, with 26%–36% of adults aged 18–49 years receiving a vaccination in the 2011–12 influenza season. Adults aged 18–49 years who are not at increased risk for influenza complications were first recommended to receive vaccination in the 2010–11 season, marking the first year of a universal influenza vaccination recommendation for all persons aged ≥6 months (1). The universal vaccination recommendation eliminates the need to determine whether each person has one or more specific indications for vaccination and emphasizes the importance of preventing influenza among persons of all ages including all adults (1). Primary care physicians, medical subspecialists, and other health-care professionals and vaccination providers, including pharmacists, should work together to ensure that all persons are assessed for their vaccine needs, receive a strong recommendation for vaccination, and are either vaccinated by the recommending health-care provider or referred to another health-care provider if that provider does not provide influenza vaccination services.
Vaccination coverage for adults aged ≥65 years was 65%–70% in 2011–12 and has remained relatively constant since 2007–08 (67). Increased levels of vaccination in alternative settings (e.g., community settings such as senior center, churches, and malls), health department clinics, pharmacies, and educational settings) might help improve influenza vaccination rates; however, at the individual level, persons must be motivated to seek out the vaccination (68,69). Universal recommendations might eventually lead to higher coverage among contacts of older adults, which might contribute to better protection of frail older adult populations in whom the effectiveness of the vaccine is unclear (11,12). In particular, increasing coverage among health-care providers in long-term care facilities is an important strategy to better protect the vulnerable populations in those settings.
Vaccination coverage among most adult age groups of non-Hispanic blacks and Hispanics was significantly lower than among non-Hispanic whites. Broad use of interventions to remove barriers to access and interventions that make it a routine practice to offer vaccinations in health-care and other settings are important components of efforts to reduce these disparities (70,71). Measures to reduce disparities might be most important for adults aged ≥50 years because the racial/ethnic disparities in adults aged 18–49 years and children aged 6 months–17 years are smaller (52,63). Although patterns of racial/ethnic disparities were similar as measured by BRFSS and NHIS, CIs for BRFSS estimates were substantially smaller; therefore, statistically significant disparities are more likely to be identified in the BRFSS data.
Although the majority of adults received influenza vaccinations in medical settings, a substantial proportion were vaccinated in nonmedical settings. The proportion of adults vaccinated in stores (19%–20%) during the 2011–12 season increased compared with the 1998–99 (72) and 2006–07 influenza seasons (National Immunization Survey [NIS-Adult], CDC, unpublished data, 2013). (NIS-Adult was a national telephone survey conducted in 2007 by CDC. The objective of the survey was to provide timely, detailed information regarding adult vaccination coverage.)This increase might result partly from changes in state laws that allow pharmacists to administer influenza vaccinations to adults, and subsequently, more pharmacies offering influenza vaccinations. In 1999, only 22 states allowed pharmacists to administer the influenza vaccinations to adults; by June 2009, all 50 states allowed pharmacists to administer the vaccinations to adults, and some states began allowing vaccination of children; the minimum age for persons who may be vaccinated by pharmacists varies from state to state (68,73).
Opinions about vaccine safety were associated with sociodemographic characteristics, a result that is consistent with previous studies (74–76). Health-care providers, community leaders, and community and faith-based organizations need to use effective strategies, including social media, to improve the accuracy of perceptions of influenza vaccination (77,78). In addition, physician contacts and recommendations play an important role in vaccination rates (35,41,79–81). However, the results in this report indicate that among those who had contact with a physician during the influenza season, only 44% patients received a vaccination recommendation from a health-care provider. Studies have shown that health-care provider recommendations can override a patient's negative opinions about the influenza vaccination (75,80). Health-care providers should be encouraged to take every opportunity to recommend and administer the influenza vaccine to patients.
State Variations
Vaccination coverage among children and adults varied widely by state. Factors that might have contributed to the wide variability in coverage include variations in the way state vaccination programs are implemented; differences in medical-care delivery infrastructure; differences in the effectiveness of specific interventions being implemented by states and other stakeholders (i.e., community campaigns, health-care provider-based strategies, and workplace vaccination); and differences in population attitudes toward influenza and influenza vaccinations (39,82,83). Assessment of programmatic factors that are associated with vaccination coverage are important for improving seasonal influenza vaccination coverage. State immunization programs are encouraged to engage health-care providers and other stakeholders to implement interventions shown to be effective by the Guide to Community Preventive Services (i.e., the Community Guide) (84).
HCP
Influenza vaccination coverage among HCP as measured by NHIS steadily increased from 2007–08 through 2011–12 seasons but remained low (62%) compared with the Healthy People 2020 target of 90% (21). A similar trend was observed as measured by Internet panel surveys during the 2009–10 through 2011–12 seasons, with Internet panel survey estimates of 4–8 percentage points higher.
HCP are exposed to influenza both at work and in the community. Vaccination of this group is especially important given their exposure to many patients at high risk for influenza complications and because HCP often work while ill (85–87). To further improve vaccination coverage among HCP, each medical-care facility can consider developing a comprehensive intervention strategy that includes education and promotion of influenza vaccination to encourage vaccination and free, easy access to the vaccination. Educational programs should emphasize vaccine effectiveness, safety, influenza transmission, and the benefits of HCP vaccination for staff, patients, and families of HCP. The findings in this report suggest that employer vaccination requirements have led to higher vaccination levels. Similar results were found within a sample of U.S. hospitals in which single season influenza vaccination rates increased approximately 15 percentage points after implementation of hospital policies requiring receipt of influenza vaccination (88). The findings of this report indicate that influenza vaccination knowledge and awareness is higher among physicians than among other HCP, indicating that vaccination knowledge and awareness among other HCP such as nurses and other clinical and nonclinical personnel could be further improved.
Pregnant Women
Vaccination coverage among pregnant women increased from the 2007–08 season as measured by BRFSS. Although multiple surveys indicate an increase in coverage, one in two pregnant women is not vaccinated against influenza (43,44). Pregnant women who received a health-care provider recommendation for influenza vaccination were more likely to be vaccinated (40,43). In addition, pregnant women who received both a provider recommendation and an offer for influenza vaccination were more likely to be vaccinated than pregnant women who only received a provider recommendation (44). Additional efforts to increase provider vaccination recommendations and offers to their pregnant patients are likely to have substantial impact on vaccination coverage. Efforts should continue to focus on increasing the number of providers who routinely recommend and offer annual influenza vaccinations to their pregnant patients and offering influenza vaccine when possible.
One of the most common reasons reported by pregnant women for not receiving influenza vaccination was concerns about safety of the vaccine. A study of postpartum women conducted in one health-care facility found similar results (89). Concerns about safety affects vaccine use during pregnancy likely affects willingness of pregnant women to seek vaccination. However, no risk to pregnant women or their unborn children from influenza vaccination has been demonstrated (90,91). To improve vaccine coverage, successful strategies to educate pregnant women about the safety of the vaccine need to be identified.
Evaluating and monitoring influenza vaccination coverage among pregnant women is complex because pregnant women account for only about 1% of the population and because of the need to assess both pregnancy and influenza vaccination status during a given influenza season (92). Opt-in Internet panel surveys provide a cost-effective, rapid way to collect detailed vaccination-related information for women pregnant during a defined vaccination period. Ongoing comparisons to estimates from BRFSS and PRAMS are needed to assess the trade-off between potential bias of estimates from the opt-in panels and their ability to rapidly collect detailed information on a small, rare population.
Limitations
The findings in this report are subject to at least four limitations. First, influenza vaccination status as measured by surveys in this report is self-reported and is not validated with medical records, other than for full vaccination coverage of children 6–23 months from NIS. However, self-reported seasonal influenza vaccination status among adults has been shown to have relatively high agreement with vaccination status ascertained from medical records among older adults, with a range of a 5% to 11% net over reporting bias (93–95). For childhood and adolescent influenza vaccination, other studies showed that parent report has had high sensitivity and specificity but low positive predictive value compared with medical records (96–98). Second, a potential limitation of all surveys used to estimate influenza vaccination coverage during the 2009–10 influenza season is that estimates of vaccination coverage for seasonal influenza might be less reliable than estimates from other years because of the potential for less accurate recall regarding receipt of seasonal versus pH1N1 vaccine. Although IIS sentinel site data are provider verified, vaccination coverage estimates from these sites might underestimate coverage because of lack of information from nonenrolled providers, underreporting by enrolled providers, and unreported vaccinations administered in complementary settings (e.g., schools). Third, the IIS sentinel sites reflect relatively small numbers of children and are not representative of the U.S. population of children. Finally, trends in estimates from ongoing surveys (e.g., NHIS and BRFSS) might be affected by changes in the population totals used to create survey weights (i.e., comparing intercensal estimates before 2010 to actual estimates from the 2010 U.S. census). In addition, changes in sample and weighting methods for BRFSS created a discontinuity in the trend analysis from the 2010–11 to 2011–12 influenza season estimates.
Conclusion
Implications for Public Health Practice
Influenza vaccination coverage remains suboptimal. To further improve vaccination coverage, comprehensive strategies are required and should include those that focus on the following (1,22,23,76,77,84,99):
- Promoting vaccine-seeking behaviors among persons recommended for vaccinations
- Increasing the demand for vaccinations
- Increasing access to vaccinations at nontraditional sites (e.g., schools, workplace, pharmacies, churches, and senior centers)
- Increasing the use of reminder-recall systems
- Increasing targeted media outreach and educational programs
- Expanding the use of standing orders
- Implementing more comprehensive health-care provider-based or system-based interventions
- Reducing barriers to vaccination (e.g., out-of-pocket spending and concerns about vaccine safety and efficacy)
- Increasing awareness among patients and health-care providers about the benefits of influenza vaccination
- Improving communication about personal risk and about the safety and effectiveness of the vaccine
- Emphasizing the benefıts of HCP vaccination for staff and patients
- Considering the level of vaccination coverage among HCP as one measure of patient safety and quality assurance
- Providing easily accessible vaccinations in the workplace
- Electronically tracking coverage levels by ward, unit, and occupation
Implications for Public Health Surveillance
Substantial improvement in annual influenza vaccination coverage is needed to maximally reduce the adverse health effects of influenza. The starting point for improvement in vaccination coverage is improved vaccination assessment data, including timely and extensive data that can help direct immunization program efforts, using limited resources effectively. CDC expanded its influenza vaccination assessment program during and after the pH1N1 vaccination campaign. This expansion was designed to be cost-effective and provide timely information needed for program and policy considerations, with surveillance attributes tailored to the level of accuracy needed for different purposes.
The use of ongoing telephone surveys (NIS and BRFSS), Internet panel surveys for rare populations (HCP and pregnant women), and rapid telephone surveys (NFS) allows for timely vaccination coverage and related estimates to be provided to vaccination programs when they are planning vaccination efforts for the subsequent season. These telephone and Internet panel surveys are also used to assess the impact and safety of influenza vaccination each season. The additional information on place of vaccination and data regarding knowledge, attitudes, and beliefs can help guide development of public communication messages and provider education materials.
A potential trade-off for timely data is lower validity of estimates. Because NHIS covers households with or without any type of telephone service and has higher response rates than telephone surveys, it has lower potential for selection bias because of incomplete sample frame or nonresponse than other surveys. Ongoing comparisons of influenza vaccination coverage estimates from NHIS, NIS, BRFSS, and Internet panel surveys are needed. These comparisons over seasons will allow retroactive assessment of the consistency and possible validity of the vaccination coverage results across data sources. When vaccination coverage results differ across data sources, care is needed when interpreting the varied results and developing recommendations for public health action.
Each data collection system described in this report has individual strengths and limitations; differences in precision of estimates and survey methods (e.g., different sampling frame, survey mode, survey questions, order of survey questions, operations, response rates, and weighting) might lead to different estimates. Examination of results from all surveys is necessary to fully assess different important components of influenza vaccination coverage among different populations in the United States. This requires clear understanding of the attributes of each data source, critical review of findings, and effective communication to translate findings into public health practice.
Acknowledgments
The findings in this report are based, in part, on contributions by Ajay Yesupriya, Carolyn S. Neal, the Research Data Center, National Center for Health Statistics, CDC; William S. Garvin and other members of the CDC Behavioral Surveillance Branch; the National Opinion Research Center, Chicago, Illinois; state BRFSS coordinators; Shannon Stokley and members of the Adult and Flu Vaccine Coverage Monitoring Team, Immunization Service Division, NCIRD, CDC; Abt SRBI, Silver Spring, Maryland; and Abt Associates Inc., Cambridge Massachusetts.
References
- CDC. Prevention and control of influenza: recommendations of the Advisory Committee on Immunization Practices (ACIP), 2010. MMWR 2010;59(No. RR-8).
- CDC. Prevention and control of influenza: recommendations of the Advisory Committee on Immunization Practices—United States, 2012–13 influenza season. MMWR 2012;61:613–8.
- CDC. Estimates of deaths associated with seasonal influenza—United States, 1976–2007. MMWR 2010;59:1057–62.
- Thompson WW, Shay DK, Weintraub E, et al. Influenza-associated hospitalization in the United States JAMA 2004;292:1333–1340.
- Bridges CB, Katz JM, Levandowski RA, et al. Inactivated influenza vaccines. In: Plotkin SA, Orenstein WA, Offit PA, ed. Vaccines, 5th ed. Philadelphia, PA: Elsevier; 2008:259–90.
- Bridges CB, Thompson WW, Meltzer MI, et al. Effectiveness and cost-benefit of influenza vaccination of healthy working adults: a randomized controlled trial. JAMA 2000;284:1655–63.
- Molinari NA, Ortega-Sanchez IR, Messonnier ML, et al. The annual impact of seasonal influenza in the U.S.: measuring disease burden and costs. Vaccine 2007;25:5086–96.
- Meltzer MI, Cox NJ, Fukuda K. The economic impact of pandemic influenza in the United States: priorities for intervention. Emerg Infect Dis 1999;5:659–71.
- Kissling E, Valenciano M. I-MOVE case-control studies team. Early estimates of seasonal influenza vaccine effectiveness in Europe among target groups for vaccination: results from the I-MOVE multicentre case-control study, 2011/12. Euro Surveill 2012;17:20146.
- Jimenez-Jorge S, de Mateo S, Pozo F, et al. Early estimates of the effectiveness of the 2011/12 influenza vaccine in the population targeted for vaccination in Spain, 25 December 2011 to 19 February 2012. Euro Surveill 2012;17:20129.
- Vu T, Farish S, Jenkins M, Kelly H. A meta-analysis of effectiveness of influenza vaccine in persons aged 65 years and over living in the community. Vaccine 2002;20:1831–6.
- Govaert TM, Thijs CT, Masurel N, Sprenger MJ, Dinant GJ, Knottnerus JA. The efficacy of influenza vaccination in elderly individuals. A randomized double-blind placebo-controlled trial. JAMA 1994;272:1661–5.
- Gatwood J, Meltzer MI, Messonnier M, Ortega-Sanchez IR, Balkrishnan R, Prosser LA. Seasonal influenza vaccination of healthy working-age adults: a review of economic evaluations. Drugs 2012;72:35–48.
- Fireman B, Lee J, Lewis N, Bembom O, van der Laan M, Baxter R. Influenza vaccination and mortality: differentiating vaccine effects from bias. Am J Epidemiol 2009;170:650–6.
- Fedson DS, Houck P, Bratzler D. Hospital-based influenza and pneumococcal vaccination: Sutton's law applied to prevention. Infect Control Hosp Epidemiol 2000;21:692–9.
- Ohmit SE, Victor JC, Rotthoff JR, et al. Prevention of antigenically drifted influenza by inactivated and live attenuated vaccines. N Engl J Med 2006;355:2513–22.
- Baguelin M, Jit M, Miller E, Edmunds WJ. Health and economic impact of the seasonal influenza vaccination programme in England. Vaccine 2012;30:3459–62.
- Williams WW. Managed care can improve pneumococcal and influenza vaccination levels. HMO Pract 1997;11:174–5.
- Fedson DS. Adult immunization: summary of the National Vaccine Advisory Committee Report. JAMA 1994;272:1133–7.
- CDC. Prevention and control of influenza: recommendations of the Advisory Committee on Immunization Practices. MMWR 2009;58(No. RR-8).
- CDC. Healthy people 2020. Topics & objectives—immunization and infectious diseases. Atlanta, GA: CDC. Available at http://www.healthypeople.gov/2020/topicsobjectives2020/downloads/HP2020IIDandGHProgressReviewData.xlsx.
- CDC. Immunization of health-care personnel: recommendations of the Advisory Committee on Immunization Practices (ACIP). MMWR 2011;60(No. RR-7).
- CDC. Influenza vaccination of health-care personnel: recommendations of the Healthcare Infection Control Practices Advisory Committee (HICPAC) and the Advisory Committee on Immunization Practices (ACIP). MMWR 2006;55(No. RR-2).
- CDC. Prevention and control of influenza. MMWR 1984;33:253–60, 265–6.
- Siston AM, Rasmussen SA, Honein MA, et al. Pandemic 2009 influenza A (H1N1) virus illness among pregnant women in the United States. JAMA 2010;303:1517–25.
- Rasmussen SA, Jamieson DJ, Bresee JS. Pandemic influenza and pregnant women. Emerg Infect Dis 2008;14:95–100.
- Poehling KA, Szilagyi PG, Staat MA, et al. Impact of maternal immunization on influenza hospitalizations in infants. Am J Obstet Gynecol 2011;204:S141–8.
- Zaman K, Roy E, Arifeen SE, et al. Effectiveness of maternal influenza immunization in mothers and infants. N Engl J Med 2008;359:1555–64.
- Omer SB, Goodman D, Steinhoff MC, et al. Maternal influenza immunization and reduced likelihood of prematurity and small for gestational age births: a retrospective cohort study. PLoS Med 2011;8:e1000441.
- CDC. Prevention and control of influenza: part 1, vaccines: recommendations of the Advisory Committee on Immunization Practices. MMWR 1994;43(No. RR-9).
- CDC. Prevention and control of influenza recommendations of the Advisory Committee on Immunization Practices. MMWR 1995;44(No. RR-3).
- CDC. Prevention and control of influenza: recommendations of the Advisory Committee on Immunization Practices (ACIP). MMWR 1997;46(No. RR-9).
- CDC. Prevention and control of influenza: recommendations of the Advisory Committee on Immunization Practices (ACIP). MMWR 2004;53(No. RR-6).
- Egede LE, Zheng D. Racial/ethnic differences in influenza vaccination coverage in high-risk adults. Am J Public Health 2003;93:2074–8.
- Lu PJ, Singleton JA, Rangel MC, et al. Influenza vaccination trends among adults 65 years or older in the United States, 1989–2002. Arch Intern Med 2005;165:1849–56.
- Singleton JA, Santibanez TA, Wortley PM. Influenza and pneumococcal vaccination of adults aged ≥65: racial/ethnic differences. Am J Prev Med 2005;29:412–20.
- Walker FJ, Singleton JA, Lu PJ, et al. Influenza vaccination of health care workers in the United States, 1989–2002. Infect Control Hosp Epidemiol 2006;27:257–65.
- Lu P, Bridges CB, Euler GL, Singleton JA. Influenza vaccination of recommended adult populations, U.S., 1989–2005. Vaccine 2008;26:1786–93.
- CDC. Interim results: state-specific seasonal influenza vaccination coverage—United States, August 2009–January 2010. MMWR 2010;59:477–84.
- Ding H, Santibanez TA, Jamieson DJ, et al. Influenza vaccination coverage among pregnant women—National 2009 H1N1 Flu Survey (NHFS). Am J Obstet Gynecol 2011;204(Suppl 1):S96–106.
- Lu PJ, Ding D, Black CL. H1N1 and seasonal influenza vaccination of U.S. healthcare personnel, 2010. Am J Prev Med 2012;43:282–92.
- CDC. Influenza vaccination coverage among health-care personnel—the 2011–12 season, United States. MMWR 2012;61:753–7.
- Kennedy ED, Ahluwalia IB, Ding H, Lu PJ, Singleton JA, Bridges CB. Monitoring seasonal influenza vaccination coverage among pregnant women in the United States: surveillance systems used and selected results. Am J Obstet Gynecol 2012;207(Suppl):S9–16.
- CDC. Influenza vaccination among pregnant women—2011–12 influenza season, United States. MMWR 2012;61:758–63.
- CDC. Influenza vaccination among pregnant women—United States, 2010–11 influenza season. MMWR 2011;60:1078–82.
- CDC. Seasonal influenza vaccination coverage among children aged 6 months–18 years—eight immunization information system sentinel sites, United States, 2009–10 influenza season. MMWR 2010;59:1266–9.
- Wise ME, Viray M, Sejvar JJ, et al. Guillain-Barre syndrome during the 2009–2010 H1N1 influenza vaccination campaign: population-based surveillance among 45 million Americans. Am J Epidemiol 2012;175:1110–9.
- Moro PL, Broder K, Zheteyeva Y, et al. Adverse events following administration to pregnant women of influenza A (H1N1) 2009 monovalent vaccine reported to the Vaccine Adverse Event Reporting System. Am J Obstet Gynecol. 2011;205:473.e1–9.
- Vellozzi C, Broder KR, Haber P, et al. Adverse events following influenza A (H1N1) 2009 monovalent vaccines reported to the Vaccine Adverse Event Reporting System, United States, October 1, 2009–January 31, 2010. Vaccine 2010;28:7248–55.
- Borse RH, Shrestha SS, Fiore AE, et al. Effects of vaccine program against pandemic influenza A(H1N1) virus, United States, 2009–2010. Emerg Infect Dis 2013;19:439–48.
- Kostova D, Reed C, Finelli L, et al. Influenza illness and hospitalizations averted by influenza vaccination in the United States, 2005–2011. PLoS ONE 2013;8:e66312.
- CDC. Estimated influenza vaccination coverage among adults and children—United States, September 1, 2004–January 31, 2005 MMWR 2005;54:304–7.
- CDC. State-specific influenza A (H1N1) 2009 monovalent vaccination coverage—United States, October 2009–January 2010. MMWR 2010;59:363–8.
- CDC. Interim results: influenza A (H1N1) 2009 monovalent and seasonal influenza vaccination coverage among health-care personnel—United States, August 2009–January 2010. MMWR 2010;59:357–62.
- Shah B, Barnwell B, Bieier G. SUDAAN user's manual, release 10.1. Research Triangle Park, NC: Research Triangle Institute; 2010.
- American Association for Public Opinion Research (AAPOR). Opt-in surveys and margin of error. Deerfield, IL: AAPOR; 2013. Available at http://www.aapor.org/opt_in_surveys_and_margin_of_error1.htm.
- CDC. National Health Interview Survey. Atlanta, GA: CDC; 2012. Available at ftp://ftp.cdc.gov/pub/Health_Statistics/NCHS/Dataset_Documentation/NHIS/2011/srvydesc.pdf.
- CDC. BRFSS annual survey data. Atlanta, GA: CDC; 2011. Available at http://www.cdc.gov/brfss/technical_infodata/surveydata/2011.htm.
- CDC. Methodologic changes in the Behavioral Risk Factor Surveillance System in 2011 and potential effects on prevalence estimates. Atlanta, GA: CDC. Available at http://www.cdc.gov/surveillancepractice/reports/brfss/brfss.html.
- CDC. Statistical methodology of the National Immunization Survey. Atlanta, GA: CDC; 2005. Available at http://www.cdc.gov/nchs/data/series/sr_02/sr02_138.pdf and ftp://ftp.cdc.gov/pub/health_statistics/nchs/dataset_documentation/nis/nispuf10_dug.pdf.
- CDC. Vaccines and immunizations: adding households with cell phone service to the National Immunization Survey (NIS), 2011. Atlanta, GA: CDC. Available at http://www.cdc.gov/vaccines/stats-surv/nis/dual-frame-sampling-08282012.htm.
- CDC. Influenza vaccination coverage among children aged 6–23 months—United States, 2005–06 influenza season. MMWR 2007;56:959–63.
- CDC. Seasonal influenza (flu). Atlanta, GA: CDC. Available at http://www.cdc.gov/flu/professionals/vaccination/nfs-survey-march2012.htm.
- CDC. Influenza vaccination coverage among health-care personnel—United States, 2010–11 influenza season. MMWR 2011;60:1073–7.
- Ahluwalia IB, Singleton JA, Jamieson DJ, Rasmussen SA, Harrison L. Seasonal influenza vaccine coverage among pregnant women: pregnancy risk assessment monitoring system. J Womens Health (Larchmt) 2011;20:649–51.
- CDC. Prevention and control of influenza. Recommendations of the Advisory Committee on Immunization Practices (ACIP). MMWR 2006;55(Early Release).
- CDC. Recent influenza vaccination trends across influenza seasons. Atlanta, GA: CDC. Available at http://www.cdc.gov/flu/pdf/professionals/vaccination/trends-summary.pdf.
- CDC. Place of influenza vaccination among adults—United States, 2010–2011 influenza season. MMWR 2011;60:781–5.
- Nichol KL, MacDonald R, Hauge M. Factors associated with influenza and pneumococcal vaccination behavior among high-risk adults. J Gen Intern Med 1996;11:673–7.
- Fiscella K. Anatomy of racial disparity in influenza vaccination. Health Serv Res 2005;40:539–49.
- Task Force on Community Prevention Services. The guide to community preventive services. New York, NY: Oxford University Press; 2005. Available at http://www.thecommunityguide.org/library/book/index.html.
- Singleton JA, Poel AJ, Lu P, Nichols KL, Iwane MK. Where adults reported receiving influenza vaccination in the United States. Am J Infect Control 2005;33:563–70.
- American Pharmacists Association. States where pharmacists can immunize. Washington, DC: American Pharmacists Association; 2009. Available at http://www.pharmacist.com/am/template.cfm?section=pharmacist_immunization_center1&template=/cm/contentdisplay.cfm&contentid=21623.
- Santibanez TA, Mootrey GT, Euler GL, Janssen AP. Behavior and beliefs about influenza vaccine among adults aged 50–64 years. Am J Health Behav 2010;34:77–89.
- Lindley MC, Wortley P, Winston CA, Bardenheier B. The role of attitudes in understanding disparities in adult influenza vaccination. Am J Prev Med 2006;31:281–5.
- Santibanez TA, Singleton JA, Santibanez SS, Wortley P, Bell BP. Socio-demographic differences in opinions about 2009 pandemic influenza A (H1N1) and seasonal influenza vaccination and disease among adults during the 2009–2010 influenza season. Influenza Other Respi Viruses 2013;3:383–92.
- Task Force on Community Preventive Services. Recommendations regarding interventions to improve vaccination coverage in children, adolescents, and adults. Am J Prev Med 2000;18(Suppl):92–6.
- Vaughan E, Tinker T. Effective health risk communication about pandemic influenza for vulnerable populations. Am J Public Health 2009;99(Suppl 2):S324–32.
- CDC. Adult immunization: knowledge, attitudes, and practices—DeKalb and Fulton counties, Georgia, 1988. MMWR 1988;37:657–61.
- Schwartz KL, Neale AV, Northrup J, et al. Racial similarities in response to standardized offer of influenza vaccination. A MetroNet study. J Gen Intern Med 2006;21:346–51.
- Chi RC, Neuzil KM. The association of sociodemographic factors and patient attitudes on influenza vaccination rates in older persons. Am J Med Sci 2004;327:113–7.
- Klaiman T, Ibrahim JK. State health department structure and pandemic planning. J Public Health Manag Pract 2010;16:E1–7.
- Nelson DE, Bland S, Powell-Griner E, et al. State trends in health risk factors and receipt of clinical preventive services among US adults during the 1990s. JAMA 2002;287:2659–67.
- CDC. The guide to community preventive services. The community guide. Atlanta, GA: CDC; 2013. Available at http://www.thecommunityguide.org/index.html.
- Salgado CD, Farr BM, Hall KK, et al. Influenza in the acute hospital setting. Lancet Infect Dis 2002;2:145–55.
- Hayward AC, Harling R, Wetten S, et al. Effectiveness of an influenza vaccine programme for care home staff to prevent death, morbidity, and health service use among residents: cluster randomised controlled trial.
- Wilde JA, McMillan JA, Serwint J, Butta J, O'Riordan MA, Steinhoff MC. Effectiveness of influenza vaccine in health care professionals: a randomized trial. JAMA 1999;281:908–13.
- Miller BL, Ahmed F, Lindley MC, Wortley PM. Increases in vaccination coverage of healthcare personnel following institutional requirements for influenza vaccination: a national survey of U.S. hospitals. Vaccine 2011;29:9398–403.
- Panda B, Stiller R, Panda A. Influenza vaccination during pregnancy and factors for lacking compliance with current CDC guidelines. J Matern Fetal Neonatal Med 2011;24:402–6.
- Munoz FM, Greisinger AJ, Wehmanen OA, et al. Safety of influenza vaccination during pregnancy. Am J Obstet Gynecol 2005;192:1098–106.
- Heinonen OP, Shapiro S, Monson RR, et al. Immunization during pregnancy against poliomyelitis and influenza in relation to childhood malignancy. Int J Epidemiol 1973;2:229–35.
- Jamieson DJ, Honein MA, Rasmussen SA, et al. H1N1 2009 influenza virus infection during pregnancy in the USA. Lancet 2009;374:451–8.
- Mac Donald RM, Baken L, Nelson A, Nichol KL. Validation of self-report of influenza and pneumococcal vaccination status in elderly outpatients. Am J Prev Med 1999;16:173–7.
- Zimmerman RK, Raymund M, Janosky JE, Nowalk MP, Fine MJ. Sensitivity and specificity of patient self-report of influenza and pneumococcal polysaccharide vaccinations among elderly outpatients in diverse patient care strata. Vaccine 2003;21:1486–91.
- Mangtani P, Shah A, Roberts JA. Validation of influenza and pneumococcal vaccine status in adults based on self-report. Epidemiol Infect 2007;135:139–43.
- Nowalk MP, Zimmerman RK, Lin CJ, et al. Parental perspectives on influenza immunization of children aged 6 to 23 months. Am J Prev Med 2005;29:210–4.
- Shinall MC Jr, Plosa EJ, Poehling KA. Validity of parental report of influenza vaccination in children 6 to 59 months of age. Pediatrics 2007;120:e783–7.
- Lu PJ, Dorell C, Yankey D, Santibanez TA, Singleton JA. A comparison of parent and provider reported influenza vaccination status of adolescents. Vaccine 2012;30:3278–85.
- Poland GA, Shefer AM, McCauley M, Webster PS, Whitley-Williams PN, Peter G. Standards for adult immunization practices. Am J Prev Med 2003;25:144–50.
FIGURE 1. Influenza vaccination coverage among adults aged ≥18 years, by age group, season-specific vaccination, and vaccination in previous 12 months — Behavioral Risk Factor Surveillance System, United States, 2007–08 through 2011–12 influenza seasons*
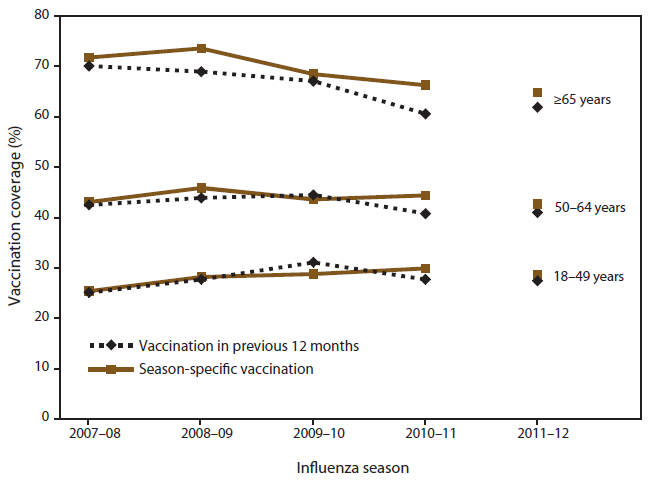
* Beginning in the 2011 BRFSS, surveys included both landline and cellular telephone households, and a new weighting method was used. The trend lines are discontinued from 2010–11 to 2011–12 influenza season to reflect this change.
Alternate Text: Figure 1 is a line graph showing influenza vaccination coverage among adults aged ≥18 years, season-specific vaccination, and vaccination in previous 12 months, according to the Behavioral Risk Factor Surveillance System in the United States during the 2007-08 through 2011-12 influenza seasons. Comparing estimates from BRFSS using the traditional calendar year data with previous 12-month vaccination period and season-specific Kaplan-Meier estimates, the difference in influenza vaccination coverage for adults aged ≥18 years was -0.2 percentage points for the 2007-08 season, -1.4 percentage points for 2008-09, and 1.5 percentage points for 2009-10. Larger differences were observed when stratified by adult age group.
FIGURE 2. Influenza vaccination coverage among children aged 6 months–17 years, by surveillance system — National Health Interview Survey, National Immunization Survey, and National Flu Survey, United States, 2007–08 through 2011–12 influenza seasons*
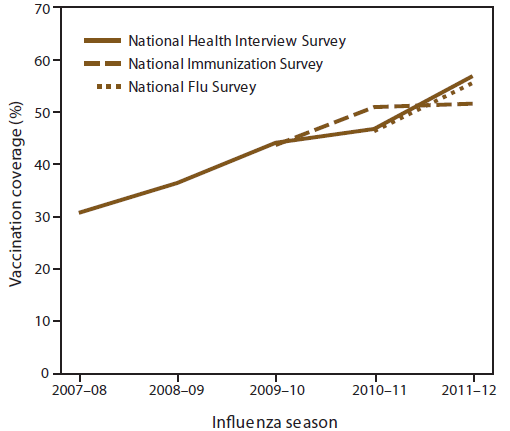
* Vaccination status reported by parent for child.
Alternate Text: Figure 2 is a line graph showing influenza vaccination coverage among children aged 6 months-17 years according to the National Health Interview Survey (NHIS), National Immunization Survey (NIS), and National Flu Survey (NIS) in the United States during the 2007-08 through 2011-12 influenza seasons. Influenza vaccination coverage among children aged 6 months-17 years increased significantly from 31.1% in the 2007-08 influenza season to 56.7% in the 2011-12 season as measured by NHIS. Coverage increased from the 2009-10 season to the 2010-11 season but did not increase from the 2010-11 season to the 2011-12 season as measured by NIS. Compared with the 2010-11 season, a significant increase in coverage occurred during the 2011-12 season (NHIS, 9.8 percentage points; NFS, 9.3 percentage points).
FIGURE 3. Influenza vaccination coverage among children aged 6 months–17 years — National Immunization Survey, United States, 2011–12 influenza season
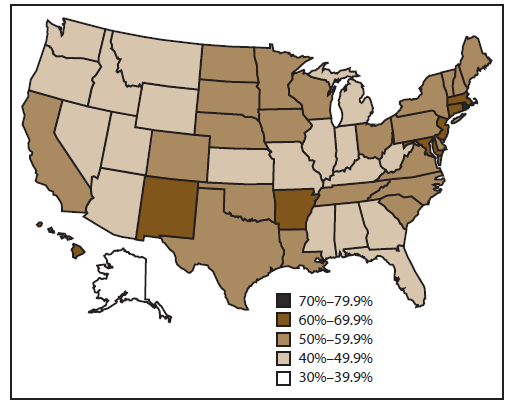
Alternate Text: Figure 3 is a map showing Influenza vaccination coverage among children aged 6 months-17 years according to the National Immunization Survey (NIS) in the United States during the 2011-12 influenza season. Influenza vaccination coverage among children aged 6 months-17 years for the 2011-12 season varied substantially by state. Vaccination coverage ranged from 38.8% in Alaska to 73.8% in Rhode Island, with a median of 50.9% as measured by NIS.
FIGURE 4. Full* influenza vaccination coverage among children aged 6 months–8 years — National Immunization Survey and Immunization Information System, United States, 2007–08 through 2011–12 influenza seasons†
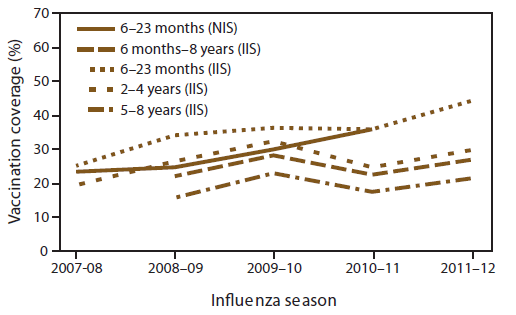
Abbreviations: IIS = Immunization Information Systems; NIS = National Immunization Survey.
* Having either one or two seasonal influenza vaccinations, as recommended by the Advisory Committee for Immunization Practices for each influenza season, based on the child's influenza vaccination history.
† Based on reported vaccination history.
Alternate Text: Figure 4 is a line graph showing full influenza vaccination coverage among children aged 6 months-8 years according to the National Immunization Survey and Immunization Information System in the United States during the 2007-08 through 2011-12 influenza seasons. Full vaccination coverage among children aged 6 months-8 years increased from 22.2% in the 2008-09 season to 27.1% in the 2011-12 season and decreased with increasing age.
FIGURE 5. Influenza vaccination coverage among adults aged ≥18 years — National Health Interview Survey and Behavioral Risk Factor Surveillance System, United States, 2007–08 through 2011–12 influenza seasons*
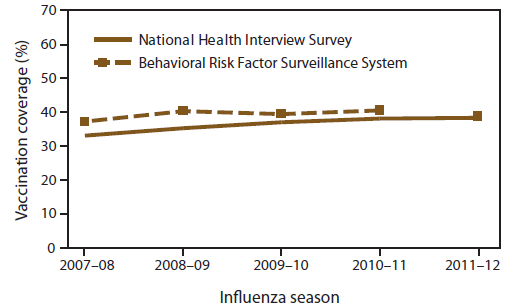
Abbreviation: BRFSS = Behavioral Risk Factor Surveillance System.
* Beginning in the 2011 BRFSS, surveys included both landline and cellular telephone households, and a new weighting method was used. The BRFSS trend line is discontinued from 2010–11 to 2011–12 to reflect this change.
Alternate Text: Figure 5 is a line graph showing Influenza vaccination coverage among adults aged ≥18 years according to the National Health Interview Survey and Behavioral Risk Factor Surveillance System in the United States during the 2007-08 through 2011-12 influenza seasons. Overall, influenza vaccination coverage among adults aged ≥18 years increased from 33.0% in the 2007-08 season to 38.3% in the 2011-12 season as measured by NHIS. As measured by BRFSS, coverage among adults aged ≥18 years was 37.2% in 2007-08 and 38.8% in 2011-12.
FIGURE 6. Influenza vaccination coverage among adults aged ≥18 years — Behavioral Risk Factor Surveillance System, United States, 2011–12 influenza season
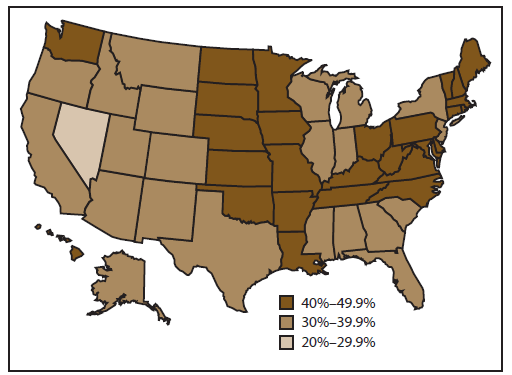
Alternate Text: Figure 6 is a map showing Influenza vaccination coverage among adults aged ≥18 years according to the Behavioral Risk Factor Surveillance System in the United States during the 2011-12 influenza season. Influenza vaccination coverage among adults aged ≥18 years varied substantially by state as measured by BRFSS. Vaccination coverage ranged from 28.3% in Nevada to 48.9% in South Dakota, with a median of 40.8%
FIGURE 7. Influenza vaccination coverage among health-care personnel — Internet panel survey and National Health Interview Survey, United States, 2007–08 through 2011–12 seasons
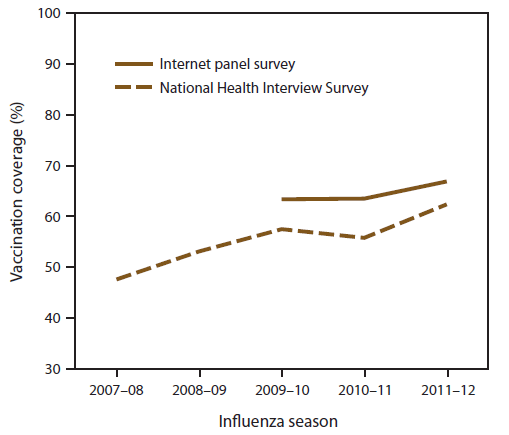
Alternate Text: Figure 7 is a line graph showing Influenza vaccination coverage among health-care personnel (HCP) according to the Internet panel survey and National Health Interview Survey (NHIS) in the United States during the 2007-08 through 2011-12 seasons. Overall, 66.9% of HCP reported having been vaccinated in the 2011-12 influenza season as measured by an Internet panel survey. Coverage was 62.4% in the 2011-12 season among HCP as measured by NHIS. Overall, influenza vaccination coverage among HCP increased significantly from 47.6% in the 2007-08 season to 62.4% in the 2011-12 season as measured by NHIS. Coverage among HCP did not substantially increase from 2009-10 through 2011-12 as measured by the Internet panel surveys.
FIGURE 8. Influenza vaccination coverage among pregnant women aged 18–49 years— Behavioral Risk Factor Surveillance System, Pregnancy Risk Assessment Monitoring System, National 2009 H1N1 Flu Survey, and Internet Panel Survey, United States, 2007–08 through 2011–12 influenza seasons
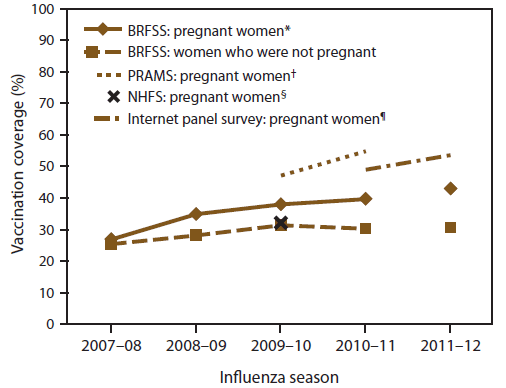
Abbreviations: BRFSS = Behavioral Risk Factor Surveillance System; PRAMS = Pregnancy Risk Assessment Monitoring System; NHFS = National 2009 H1N1 Flu Survey.
* Each year, includes women interviewed during December–February. For example, for the 2010–11 season, analysis was restricted to respondents interviewed during December 2010–February 2011.
† Based on women who had a live birth during Septermber 2009–May 2010 from 29 states and New York City, New York, for the 2009–10 influenza season (N = 27,153) (Source: CDC. Influenza vaccination among pregnant women—29 states and New York City, 2009–10 season. MMWR 2012;61:113–8) and from 21 states and New York City, New York, for the 2010–11 influenza season (N = 18,522).
§ Women who were pregnant any time during October 2009–January 2010 (N = 243)(Source: Ding H, Santibanez TA, Jamieson DJ, et al. Influenza vaccination coverage among pregnant women—National 2009 H1N1 Flu Survey [NHFS]. Am J Obstet Gynecol 2011;204:S96–106).
¶ Women who were pregnant any time time during October–January (N = 1,457 for the 2010–11 influenza season and N = 1,660 for the 2011–12 influenza season).
Alternate Text: Figure 8 is a line graph showing Influenza vaccination coverage among pregnant women aged 18-49 years- Behavioral Risk Factor Surveillance System (BRFSS), Pregnancy Risk Assessment Monitoring System (PRAMS), National 2009 H1N1 Flu Survey, and Internet Panel Survey in the United States during the 2007-08 through 2011-12 influenza seasons. Influenza vaccination coverage among pregnant women as measured by BRFSS increased from 26.9% in the 2007-2008 season to 43.0% in the 2011-12 season. Coverage among pregnant women as measured by Internet panel surveys was 49.0% in the 2010-11 season and 47.0% in the 2011-12 season. As measured by PRAMS, the estimated median influenza vaccination coverage was 47.1% in the 2009-10 season (ranging from 26.1% in Florida to 67.9% in Minnesota) and 54.8% in the 2010-11 season (ranging from 32.6% in Georgia to 75.9% in Minnesota). As measured by the Internet panel survey of the 2011-12 season, 9.9% of pregnant women were vaccinated before pregnancy, 36.5% during pregnancy, and 0.6% after pregnancy.
|
TABLE 16. Reported primary reason for not receiving influenza vaccination among unvaccinated women aged 18–49 years who were pregnant anytime during August 2011–April 2012 — Internet panel survey, United States, 2011–12 influenza season |
||||||
|---|---|---|---|---|---|---|
|
Main reason |
Total |
White |
Non-white |
|||
|
No. |
(%)* |
No. |
(%)* |
No. |
(%)* |
|
|
Total |
815 |
(100.0) |
579 |
(100.0) |
236 |
(100.0) |
|
Safety concern† |
356 |
(44.4) |
247 |
(43.0) |
109 |
(46.0) |
|
Efficacy of vaccine§ |
159 |
(19.1) |
122 |
(21.4) |
37 |
(16.4) |
|
Perceived susceptibility to influenza¶ |
61 |
(7.5) |
39 |
(6.3) |
22 |
(9.1) |
|
Health reasons** |
76 |
(9.1) |
54 |
(9.4) |
22 |
(8.9) |
|
Psychosocial reasons†† |
45 |
(6.4) |
28 |
(5.0) |
17 |
(8.1) |
|
Tangible barrier§§ |
66 |
(7.9) |
44 |
(7.4) |
22 |
(8.6) |
|
Other reasons |
52 |
(5.4) |
45 |
(7.5) |
7 |
(2.9) |
|
* Weighted percentage † Safety concern is defined as any of the following responses: "concern about safety risk to the unborn baby," "concern vaccination would give me the flu," "concern about safety risk to myself," "I don't trust the vaccine because it is too new and not enough research has been done," and "concern about side effects of the vaccination." § Efficacy of vaccine is defined as any of the following responses: "Don't think the vaccine is effective in preventing flu." ¶ Perceived susceptibility to influenza is defined as the following response: "I do not need the vaccination" and "I don't get very sick or can treat it." ** Health reason is defined as any of the following responses: "I get sick when I get the vaccination" and "I am allergic, on medication, or the vaccination is not recommended to me." †† Psychosocial reason is defined as any of the following responses: "against religious/spiritual belief" and "I am afraid of needles/shots." §§ Tangible barrier is defined as any of the following responses: "not covered by insurance/don't have insurance," "the flu vaccine costs too much," "copay cost too much," "don't have time/don't know where to go/who to call," and "the vaccination was not available." |
||||||
Use of trade names and commercial sources is for identification only and does not imply endorsement by the U.S. Department of
Health and Human Services.
References to non-CDC sites on the Internet are
provided as a service to MMWR readers and do not constitute or imply
endorsement of these organizations or their programs by CDC or the U.S.
Department of Health and Human Services. CDC is not responsible for the content
of pages found at these sites. URL addresses listed in MMWR were current as of
the date of publication.
All MMWR HTML versions of articles are electronic conversions from typeset documents.
This conversion might result in character translation or format errors in the HTML version.
Users are referred to the electronic PDF version (http://www.cdc.gov/mmwr)
and/or the original MMWR paper copy for printable versions of official text, figures, and tables.
An original paper copy of this issue can be obtained from the Superintendent of Documents, U.S.
Government Printing Office (GPO), Washington, DC 20402-9371;
telephone: (202) 512-1800. Contact GPO for current prices.
**Questions or messages regarding errors in formatting should be addressed to
mmwrq@cdc.gov.
