Persons using assistive technology might not be able to fully access information in this file. For assistance, please send e-mail to: mmwrq@cdc.gov. Type 508 Accommodation and the title of the report in the subject line of e-mail.
Update: Influenza Activity — United States, October 2, 2011–February 11, 2012
This report summarizes U.S. influenza activity* since the beginning of the 2011–12 influenza season (October 2, 2011) and updates the previous report (1). From October through early January, influenza activity remained low throughout the United States. Activity increased slightly in early February 2012, but remains low. Influenza A (H1N1)pdm09 (pH1N1), influenza A (H3N2), and influenza B viruses all have been identified thus far this influenza season, and the majority of viruses in circulation are antigenically similar to strains included in the 2011–12 vaccine.
Viral Surveillance
During October 2, 2011–February 11, 2012, approximately 140 World Health Organization (WHO) and National Respiratory and Enteric Virus Surveillance System (NREVSS) collaborating laboratories in the United States tested 78,783 respiratory specimens for influenza viruses; 3,120 (4%) were positive for influenza (Figure 1). Of these, 2,807 (90%) were influenza A viruses, and 313 (10%) were influenza B viruses. A total of 1,934 (69%) of the influenza A viruses were subtyped; 1,624 (84%) were influenza A (H3N2) viruses, and 310 (16%) were pH1N1 viruses.
Influenza virus-positive test results have been reported from all 50 states. Influenza activity slowly began to increase in December 2011. Although influenza activity is monitored in many ways, influenza season is considered to have begun when >10% of respiratory specimens tested by participating laboratories are positive for influenza. The weekly percentage of specimens testing positive for influenza did not exceed 10% until the week ending February 4, 2012. During the week ending February 11, 2012, 15% of specimens tested positive for influenza.
Influenza A (H3N2) viruses have predominated this season, although pH1N1 and influenza B viruses also have been detected. The relative proportion of each type or subtype has varied by date and U.S. Department of Health and Human Services (HHS) region.† Although influenza A (H3N2) viruses have been reported more frequently throughout the season, pH1N1 viruses have been increasing in recent weeks, especially in Regions 4, 6, and 9 (southern regions).
Outpatient Illness Surveillance
Since October 2, 2011, the weekly percentage of outpatient visits for influenza-like illness (ILI)§ reported by approximately 1,800 U.S. Outpatient ILI Surveillance Network (ILINet) providers in 50 states, New York City, Chicago, and the District of Columbia that comprise ILINet, has ranged from 1.1% to 2.1%. The percentage has not exceeded the national baseline of 2.4% (Figure 2). Peak weekly percentages of outpatient visits for ILI ranged from 3.1% to 7.6% from the 1997–98 through 2010–11 seasons, excluding the 2009–10 pandemic. On a regional level,¶ the percentage of outpatient visits for ILI ranged from 0.7% to 3.0% during the week ending February 11, 2012. As of the week ending February 11, 2012, Region 7 (Midwest) was the only HHS region with sustained increases in ILI activity above region-specific baseline levels for ≥2 consecutive weeks since October 2, 2011. Data collected in ILINet are used to produce a measure of ILI activity** by state. During the week ending February 11, 2012, one state (Missouri) experienced high ILI activity, six states (Alabama, Illinois, Mississippi, Nevada, South Dakota, and Utah) experienced low ILI activity, and minimal ILI activity was seen in the remaining 43 states and New York City; data from the District of Columbia were insufficient to calculate an ILI activity level.
State-Specific Spread of Influenza Activity
For the week ending February 11, 2012, the geographic spread of influenza†† was reported as widespread in one state (California), regional in 12 states, local in 17 states, and sporadic in 20 states, Guam, and the District of Columbia. The U.S. Virgin Islands reported having no influenza activity, and Puerto Rico did not report. Widespread activity was first reported to CDC for the 2011–12 season for the week ending February 4, 2012.
Influenza-Associated Hospitalizations
CDC monitors hospitalizations associated with laboratory-confirmed influenza infections using the FluSurv-NET surveillance system. FluSurv-NET§§ is a population-based surveillance network that for the 2011–12 season includes sites in the 10 Emerging Infections Program (EIP) states and four additional sites. Based on FluSurv-NET data, the cumulative hospitalization rate per 100,000 from October 2, 2011, through February 11, 2012, was 2.2 among children aged 0–4 years, 0.4 among children aged 5–17 years, 0.4 among adults aged 18–49 years, 1.0 among adults aged 50–64 years, and 3.2 among adults aged ≥65 years. The cumulative incidence for all age groups since October 2, 2011, was 1.0 per 100,000. The end of season cumulative hospitalization rate for the 2010–11 season was 21.6 per 100,000 population.
As of February 11, 2012, among the 68 FluSurv-NET adult patients for whom data were available for analysis, the most commonly reported underlying medical conditions were chronic lung diseases (40%), metabolic disorders (34%), and obesity (32%). The most common underlying medical conditions among the 30 children for whom data were available were chronic lung diseases (33%), asthma (27%), neurologic disorders (20%), and obesity (17%); 37% of children did not have any underlying conditions.
Pneumonia and Influenza-Related Mortality
For the week ending February 11, 2012, pneumonia and influenza (P&I) was reported as an underlying or contributing cause of death for 6.7% of all deaths reported to the 122 Cities Mortality Reporting System. This percentage is below the epidemic threshold of 7.9% for that week.¶¶ Since October 2, 2011, the weekly percentage of deaths attributed to P&I ranged from 5.9% to 7.9%, and has not exceeded the epidemic threshold for more than 1 week this season (Figure 3). Peak weekly percentages of deaths attributed to P&I in previous seasons were 9.1% for the week ending February 12, 2011, during the 2010–11 season; 8.2% for the week ending January 23, 2010, during the 2009–10 season; 7.9% for the week ending April 11, 2009, during the 2008–09 season; 9.1% for the week ending March 15, 2008, during the 2007–08 season; and 7.7% for the week ending February 24, 2007, during the 2006–07 season.
Influenza-Related Pediatric Mortality
As of February 11, 2012, three influenza-related pediatric deaths had been reported to CDC for the 2011–12 season; two were associated with influenza B viruses, and one was associated with an influenza A virus that was not subtyped. During the 2010–11 season, a total of 122 influenza-related pediatric deaths were reported to CDC. During the 2009 pandemic, 348 pediatric deaths were reported from April 15, 2009, through October 2, 2010. Before the 2009 pandemic, 67 influenza-related pediatric deaths were reported for the 2008–09 season (through April 14, 2009), 88 pediatric deaths were reported for the 2007–08 season, and 77 pediatric deaths were reported for the 2006–07 season.
Antigenic Characterization
WHO collaborating laboratories in the United States are requested to submit a subset of their influenza-positive respiratory specimens to CDC for further antigenic characterization. Since October 1, 2011, CDC has antigenically characterized 369 influenza viruses submitted by U.S. laboratories: 58 pH1N1, 263 influenza A (H3N2), and 48 influenza B viruses. Of the 58 pH1N1 viruses, 56 (97%) were characterized as A/California/7/2009-like, the influenza A (H1N1) component of the 2011–12 influenza vaccine for the Northern Hemisphere. Two viruses (3%) tested showed reduced titers with antiserum produced against A/California/7/2009. Of the 263 influenza A (H3N2) viruses, 257 (98%) were characterized as A/Perth/16/2009-like, the influenza A (H3N2) component of the 2011–12 influenza vaccine for the Northern Hemisphere. Six viruses (2%) tested showed reduced titers with antiserum produced against A/Perth/16/2009. Of the 48 influenza B viruses tested, 22 (46%) belonged to the B/Victoria lineage of viruses and were characterized as B/Brisbane/60/2008-like, the influenza B component of the 2011–12 Northern Hemisphere influenza vaccine. The other 26 (54%) influenza B viruses tested belong to the B/Yamagata lineage of viruses. The proportion of influenza B viruses belonging to the B/Yamagata lineage has been increasing since the beginning of the season, but the total amount of circulating influenza B viruses remains low.
Novel Influenza A Viruses
Since the last influenza activity update, four cases of human infection with a novel influenza A virus have been reported (1). Two cases of infection with an influenza A (H3N2)v virus were reported in West Virginia, one case of infection with an influenza A (H1N2)v virus was reported in Minnesota, and one case of infection with an influenza A (H1N1)v virus was reported in Wisconsin; all four patients have recovered.
Antiviral Resistance of Influenza Virus Specimens
Since October 1, 2011, a total of 426 influenza virus specimens have been tested for antiviral resistance. Of the 309 influenza A (H3N2), 71 pH1N1, and 46 influenza B virus specimens tested, 100% were sensitive to both oseltamivir and zanamivir. High levels of resistance to the adamantanes (amantadine and rimantadine) persist among pH1N1 and influenza A (H3N2) viruses currently circulating.
Reported by
World Health Organization Collaborating Center for Surveillance, Epidemiology, and Control of Influenza. Lynnette Brammer, MPH, Scott Epperson, MPH, Krista Kniss, MPH, Desiree Mustaquim, MPH, Amber Bishop, MPH, Rosaline Dhara, MPH, Michael Jhung, MD, Lenee Blanton, MPH, Teresa Wallis, MS, Sandra S. Chaves, MD, Lyn Finelli, DrPH, Larisa Gubareva, PhD, Joseph Bresee, MD, Alexander Klimov, PhD, Nancy Cox, PhD, Influenza Div, National Center for Immunization and Respiratory Diseases; Adena Greenbaum, MD, EIS Officer, CDC. Corresponding contributor: Adena Greenbaum, agreenbaum@cdc.gov, 404-639-3747.
Editorial Note
Influenza activity, as measured across all CDC influenza surveillance systems in the United States, has remained low this season, but began to increase in early February 2012. Although the timing of influenza activity is not predictable, peak activity in the United States most commonly occurs in February; however, substantial activity can occur as late as May (2). Vaccination remains the most effective method to prevent influenza and its complications. Health-care providers should continue to offer vaccine to all unvaccinated persons aged ≥6 months throughout the influenza season.
Influenza A (H3N2), pH1N1, and influenza B viruses have cocirculated this influenza season, but influenza A (H3N2) has predominated overall. Thus far this season, the majority of pH1N1 and influenza A (H3N2) viruses in circulation that were tested are closely related to components included in the 2011–12 Northern Hemisphere influenza vaccine. Although the proportion of influenza B viruses in the Yamagata lineage characterized by CDC, which is not included in the 2011–12 influenza vaccine, is increasing, it makes up a small proportion of circulating viruses. It is too early in the influenza season to determine how well the circulating influenza viruses will match the influenza vaccine.
Since August 2011, CDC has received reports of 14 U.S. cases of human infection with novel influenza A viruses from seven states, including 12 cases of influenza A (H3N2)v infection. Although limited human-to-human transmission was identified among some cases of influenza A (H3N2)v, no cases of novel influenza A have been identified in the United States since November 2011 (3,4).
One notable aspect of this influenza season to date has been the late increase in influenza activity. Influenza season is considered to have begun when >10% of respiratory specimens test positive for influenza. In the past 29 years, the 1987–88 season, in which influenza A (H3N2) was also predominant, is the only other season in which the percentage of respiratory specimens testing positive for influenza first exceeded the 10% threshold as late as February.
Efforts to vaccinate should be ongoing while activity is still low. According to 2011 recommendations of the Advisory Committee on Immunization Practices (ACIP), health-care providers should offer influenza vaccination to all persons aged ≥6 months throughout the influenza season (5). Although influenza vaccine strains for the 2011–12 season are the same as those in the 2010–11 vaccine, annual vaccination is recommended, even for those who were vaccinated last season. All children aged 6 months–8 years who receive a seasonal influenza vaccine for the first time should receive 2 doses. In the past, ACIP recommended that children who received only 1 dose of a seasonal influenza vaccine in the first influenza season that they were vaccinated should receive 2 doses in the following influenza season. However, because the 2011–12 vaccine strains are the same as the 2010–11 vaccine, children in this age group who received at least 1 dose of the 2010–11 seasonal vaccine will require only 1 dose of the 2011–12 vaccine (5).
Higher overall and age-specific rates of hospitalization often are observed during influenza A (H3N2)–predominant seasons (6). Based on FluSurv-NET surveillance data thus far, rates of hospitalization among patients with laboratory-confirmed influenza are low compared with previous seasons, but increasing.
Antiviral medications continue to be an important adjunct to vaccination for reducing the health impact of influenza. On January 21, 2011, new ACIP recommendations on use of antiviral agents for treatment and chemoprophylaxis of influenza were released (7). Antiviral treatment is recommended as soon as possible for patients with confirmed or suspected influenza who have severe, complicated, or progressive illness; who require hospitalization; or who are at higher risk for influenza complications (7–10). Antiviral treatment also may be considered for outpatients with confirmed or suspected influenza who do not have known risk factors for severe illness, if treatment can be initiated within 48 hours of illness onset. Recommended antiviral medications include oseltamivir and zanamivir. All samples tested for the 2011–12 season since October 1, 2011, have been susceptible to these medications. Amantadine and rimantadine should not be used because of the high levels of resistance to these drugs among circulating influenza A viruses (7). Influenza B viruses are not susceptible to amantadine or rimantadine.
Influenza surveillance reports for the United States are posted online weekly during October–May and are available at http://www.cdc.gov/flu/weekly/fluactivitysurv.htm. Additional information regarding influenza viruses, influenza surveillance, influenza vaccine, influenza antiviral medications, and novel influenza A infections in humans is available at http://www.cdc.gov/flu.
Acknowledgments
Participating state and territorial health departments and state public health laboratories; World Health Organization collaborating laboratories; National Respiratory and Enteric Virus Surveillance System collaborating laboratories; US Outpatient ILI Surveillance Network; FluSurv-NET; Influenza Associated Pediatric Mortality Surveillance System; 122 Cities Mortality Reporting System.
References
- CDC. Update: influenza activity—United States, October 2–November 26, 2011.MMWR 2011;60:1646–9.
- CDC. Prevention and control of influenza with vaccines: recommendations of the Advisory Committee on Immunization Practices (ACIP). MMWR 2010;59(No. RR-8).
- CDC. Limited human-to-human transmission of novel influenza A (H3N2) virus—Iowa, November 2011. MMWR 2011;60:1615–7.
- CDC. Update: influenza A (H3N2)v transmission and guidelines—five states, 2011. MMWR 2011;60:1741–4.
- CDC. Prevention and control of influenza with vaccines: recommendations of the Advisory Committee on Immunization Practices (ACIP), 2011. MMWR 2011;60:1128–32.
- Dao CN, Kamimoto L, Nowell M, et al. Adult hospitalizations for laboratory-positive influenza during the 2005–2006 through 2007–2008 seasons in the United States. J Infect Dis 2010;202:881–8.
- CDC. Antiviral agents for the treatment and chemoprophylaxis of influenza: recommendations of the Advisory Committee on Immunization Practices (ACIP). MMWR 2011;60(No. RR-1).
- CDC. Deaths related to 2009 pandemic influenza A (H1N1) among American Indian/Alaska Natives—12 states, 2009. MMWR 2009;58:1341–4.
- Jain S, Kamimoto L, Bramley AM, et al. Hospitalized patients with 2009 H1N1 influenza in the United States, April–June 2009. N Engl J Med 2009;361:1935–44.
- Morgan OW, Bramley A, Fowlkes A, et al. Morbid obesity as a risk factor for hospitalization and death due to 2009 pandemic influenza A(H1N1) disease. PLoS ONE 2010;5:e9694.
* The CDC influenza surveillance system collects five categories of information from eight data sources: 1) viral surveillance (World Health Organization collaborating U.S. laboratories, the National Respiratory and Enteric Virus Surveillance System, and novel influenza A virus case reporting), 2) outpatient illness surveillance (U.S. Outpatient ILI Surveillance Network), 3) mortality (122 Cities Mortality Reporting System and influenza-associated pediatric mortality reports), 4) hospitalizations (FluSurv-NET), and 5) summary of geographic spread of influenza (state and territorial epidemiologist reports).
† The 10 regions include the following states and territories: Region 1: Connecticut, Maine, Massachusetts, New Hampshire, Rhode Island, and Vermont; Region 2: New Jersey, New York, Puerto Rico, and the U.S. Virgin Islands; Region 3: Delaware, District of Columbia, Maryland, Pennsylvania, Virginia, and West Virginia; Region 4: Alabama, Florida, Georgia, Kentucky, Mississippi, North Carolina, South Carolina, and Tennessee; Region 5: Illinois, Indiana, Michigan, Minnesota, Ohio, and Wisconsin; Region 6: Arkansas, Louisiana, New Mexico, Oklahoma, and Texas; Region 7: Iowa, Kansas, Missouri, and Nebraska; Region 8: Colorado, Montana, North Dakota, South Dakota, Utah, and Wyoming; Region 9: Arizona, California, Hawaii, Nevada, American Samoa, Commonwealth of the Northern Mariana Islands, Federated States of Micronesia, Guam, Marshall Islands, and Republic of Palau; Region 10: Alaska, Idaho, Oregon, and Washington.
§ Defined as a temperature of ≥100.0°F (≥37.8°C), oral or equivalent, and cough or sore throat, in the absence of a known cause other than influenza.
¶ The national and regional baselines are the mean percentage of visits for ILI during noninfluenza weeks for the previous three seasons plus two standard deviations. A noninfluenza week is a week during which <10% of specimens tested positive for influenza. National and regional percentages of patient visits for ILI are weighted on the basis of state population. Use of the national baseline for regional data is not appropriate.
** Activity levels are based on the percentage of outpatient visits in a state attributed to ILI and are compared with the average percentage of ILI visits that occur during spring and fall weeks with little or no influenza virus circulation. Activity levels range from minimal, which would correspond to ILI activity from outpatient clinics being at or below the average, to high, which would correspond to ILI activity from outpatient clinics being much higher than the average. Because the clinical definition of ILI is general, not all ILI is caused by influenza; however, when combined with laboratory data, the information on ILI activity provides a clearer picture of influenza activity in the United States.
†† Levels of activity are 1) no activity; 2) sporadic: isolated laboratory-confirmed influenza cases or a laboratory-confirmed outbreak in one institution, with no increase in activity; 3) local: increased ILI, or at least two institutional outbreaks (ILI or laboratory-confirmed influenza) in one region of the state, with recent laboratory evidence of influenza in that region; virus activity no greater than sporadic in other regions; 4) regional: increased ILI activity or institutional outbreaks (ILI or laboratory-confirmed influenza) in at least two but less than half of the regions in the state with recent laboratory evidence of influenza in those regions; and 5) widespread: increased ILI activity or institutional outbreaks (ILI or laboratory-confirmed influenza) in at least half the regions in the state, with recent laboratory evidence of influenza in the state.
§§ FluSurv-NET conducts population-based surveillance at sites in 10 Emerging Infections Program states (California, Colorado, Connecticut, Georgia, Maryland, Minnesota, New Mexico, New York, Oregon, and Tennessee), and at sites in Michigan, Ohio, Rhode Island, and Utah.
¶¶ The seasonal baseline proportion of P&I deaths is projected using a robust regression procedure in which a periodic regression model is applied to the observed percentage of deaths from P&I that were reported by the 122 Cities Mortality Reporting System during the preceding 5 years. The epidemic threshold is set at 1.645 standard deviations above the seasonal baseline.
What is already known on this topic?
Percentages of outpatient visits for influenza-like illness and rates of influenza-associated hospitalizations have remained low this season. Influenza A (H3N2), influenza A (H1N1)pdm09, and influenza B viruses have cocirculated this season. Most circulating influenza viruses are closely related to components included in the 2011–12 influenza vaccine.
What is added by this report?
The percentage of respiratory specimens reported by CDC that have tested positive for influenza started to increase in February 2012. Rates of influenza-associated hospitalization this season have been highest in children aged 0–4 years and adults aged ≥65 years, as observed in the 2010–11 season.
What are the implications for public health practice?
Health-care providers should continue to offer vaccine to all unvaccinated persons aged ≥6 months throughout the influenza season and provide timely empiric antiviral treatment for patients with severe, complicated, or progressive influenza illness, or at higher risk for influenza complications.
FIGURE 1. Number and percentage of respiratory specimens testing positive for influenza, by type, surveillance week, and year— World Health Organization and National Respiratory and Enteric Virus Surveillance System collaborating laboratories, United States, October 2, 2011–February 11, 2012
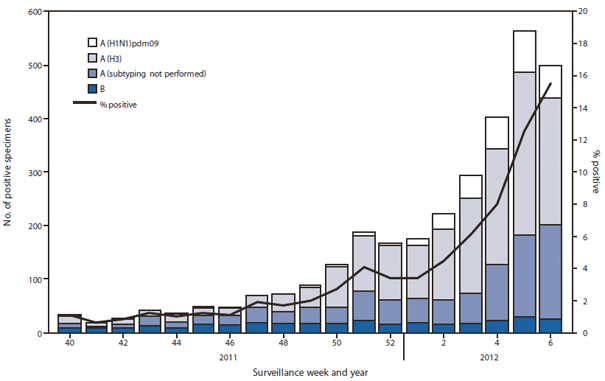
Alternate Text: The figure above shows the number and percentage of respiratory specimens testing positive for influenza, by type, surveillance week, and year in the United States during 2011-2012, according to the World Health Organization and National Respiratory and Enteric Virus Surveillance System collaborating laboratories. During October 2, 2011-February 11, 2012, approximately 140 World Health Organization and National Respiratory and Enteric Virus Surveillance System collaborating laboratories in the United States tested 78,783 respiratory specimens for influenza viruses; 3,120 (4%) were positive for influenza. Of these, 2,807 (90%) were influenza A viruses, and 313 (10%) were influenza B viruses. A total of 1,934 (69%) of the influenza A viruses were subtyped; 1,624 (84%) were influenza A (H3N2) viruses, and 310 (16%) were influenza A (H1N1)pdm09 viruses.
FIGURE 2. Percentage of visits for influenza-like illness (ILI) reported by surveillance week and year — U.S. Outpatient Influenza-Like Illness Surveillance Network (ILINet), United States, September 28, 2008–February 11, 2012
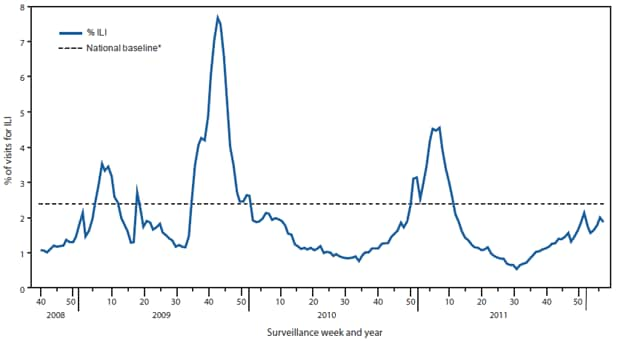
Alternate Text: The figure above shows the percentage of visits for influenza-like illness (ILI) reported by surveillance week and year in the United States during September 28, 2008 - February 11, 2012, according to the U.S. Outpatient Influenza-Like Illness Surveillance Network (ILINet). Since October 2, 2011, the weekly percentage of outpatient visits for influenza-like illness (ILI) reported by approximately 1,800 U.S. Outpatient ILI Surveillance Network (ILINet) pro¬viders in 50 states, New York City, Chicago, and the District of Columbia that comprise ILINet, has ranged from 1.1% to 2.1%. The percentage has not exceeded the national baseline of 2.4%. Peak weekly percentages of outpatient visits for ILI ranged from 3.1% to 7.6% from the 1997-98 through 2010-11 seasons, excluding the 2009-10 pandemic. On a regional level, the percentage of outpatient visits for ILI ranged from 0.7% to 3.0% during the week ending February 11, 2012. As of the week ending February 11, 2012, Region 7 (Midwest) is the only U.S. Department of Health and Human Services region with sustained increases in ILI activity above region-specific baseline levels for ≥2 consecutive weeks since October 2, 2011. Data collected in ILINet are used to produce a measure of ILI activity by state.
FIGURE 3. Percentage of all deaths attributable to pneumonia and influenza (P&I), by surveillance week and year — 122 U.S. Cities Mortality Reporting System, United States, 2007–2012*
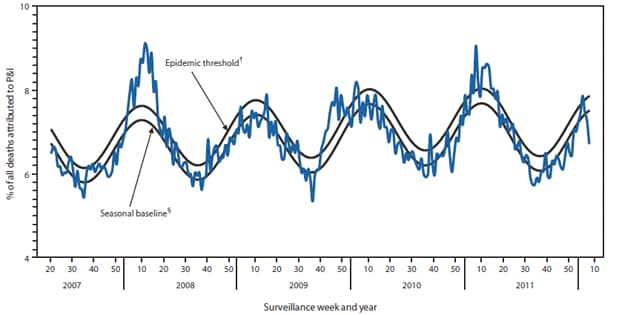
* For the reporting week ending February 11, 2012.
† The epidemic threshold is 1.645 standard deviations above the seasonal baseline.
§ The seasonal baseline is projected using a robust regression procedure that applies a periodic regression model to the observed percentage of deaths from P&I during the preceding 5 years.
Alternate Text: The figure above shows the percentage of all deaths attributable to pneumonia and influenza (P&I), by surveillance week and year for 122 U.S. Cities during 2007-2012, according to the Cities Mortality Reporting System. Since October 2, 2011, the weekly percentage of deaths attributed to P&I ranged from 5.9% to 7.9%, and has not exceeded the epidemic threshold for more than 1 week this season. Peak weekly percentages of deaths attributed to P&I in previous seasons were 9.1% for the week ending February 12, 2011, during the 2010-11 season; 8.2% for the week ending January 23, 2010, during the 2009-10 season; 7.9% for the week ending April 11, 2009, during the 2008-09 season; 9.1% for the week ending March 15, 2008, during the 2007-08 season; and 7.7% for the week ending February 24, 2007, during the 2006-07 season.
Use of trade names and commercial sources is for identification only and does not imply endorsement by the U.S. Department of
Health and Human Services.
References to non-CDC sites on the Internet are
provided as a service to MMWR readers and do not constitute or imply
endorsement of these organizations or their programs by CDC or the U.S.
Department of Health and Human Services. CDC is not responsible for the content
of pages found at these sites. URL addresses listed in MMWR were current as of
the date of publication.
All MMWR HTML versions of articles are electronic conversions from typeset documents.
This conversion might result in character translation or format errors in the HTML version.
Users are referred to the electronic PDF version (http://www.cdc.gov/mmwr)
and/or the original MMWR paper copy for printable versions of official text, figures, and tables.
An original paper copy of this issue can be obtained from the Superintendent of Documents, U.S.
Government Printing Office (GPO), Washington, DC 20402-9371;
telephone: (202) 512-1800. Contact GPO for current prices.
**Questions or messages regarding errors in formatting should be addressed to
mmwrq@cdc.gov.
