Persons using assistive technology might not be able to fully access information in this file. For assistance, please send e-mail to: mmwrq@cdc.gov. Type 508 Accommodation and the title of the report in the subject line of e-mail.
Interim Results: State-Specific Influenza Vaccination Coverage --- United States, August 2010--February 2011
The 2010--11 influenza season was unusual because it followed the 2009 influenza A pandemic (H1N1) season and it was the first season the Advisory Committee on Immunization Practices (ACIP) recommended influenza vaccination of all persons aged ≥6 months (1). The season also was notable because a record number of seasonal influenza vaccine doses (approximately 163 million) were distributed in the United States (2). To provide preliminary state-specific influenza vaccination coverage estimates, CDC analyzed Behavioral Risk Factor Surveillance System (BRFSS) data for adults aged ≥18 years and National Immunization Survey (NIS) data for children aged 6 months--17 years collected September 2010 through March 2011. By February 28, the preliminary national vaccination coverage estimate was 49.0% for children aged 6 months--17 years; among 43 states and the District of Columbia (DC), coverage ranged from 30.2% for adults aged 18--49 years to 68.6% for adults aged ≥65 years. The record high seasonal vaccination coverage achieved during 2009--10 (41.3%) among persons aged ≥6 months in 43 states and DC was sustained during the 2010--11 season (42.8%). Coverage for Hispanic and non-Hispanic black children increased by 11--12 percentage points from 2009--10 levels. Opportunity exists to improve coverage in all age groups, particularly among adults. To accomplish that, health departments and other nonoffice-based vaccination providers can increase access to vaccination at work and school locations, pharmacies and stores, and other nonmedical sites. In addition, physicians and clinics should implement proven strategies for improving vaccination coverage (e.g., office-based protocols, including reminder/recall notification and standing orders) (3).
CDC analyzed data collected September 2010--March 2011 from 43 states and DC for BRFSS and from all 50 states and DC for NIS. BRFSS respondents aged ≥18 years were asked if they had received an influenza vaccination in the past 12 months, and if so, in which month.* NIS respondents aged ≥18 years were asked whether their children had received an influenza vaccination since August, and if so, in which month.† The median state Council of American Survey and Research Organizations (CASRO) BRFSS response rate was 54.4% during the data collection timeframe. The NIS CASRO quarterly response rates ranged from 51.5% to 73.6% for landline and from 28.5% to 38.2% for cellular telephones.
To improve precision, Kaplan-Meier survival analysis of monthly interview data collected during September 2010--March 2011 was used to determine the cumulative proportion of persons vaccinated with ≥1 dose during August 2010--February 2011. BRFSS data were used to estimate coverage for adults aged ≥18 years (n = 199,452) and NIS data were used to estimate coverage for children aged 6 months--17 years (n = 88,580). Coverage for all persons aged ≥6 months was determined using combined child and adult state-level estimates weighted by the age-specific populations of each state.§ CDC performed Pearson correlations among children and among adults to determine whether state-specific coverage during 2010--11 was associated with coverage during the 2009--10 season. CDC also performed a Pearson correlation between 2010--11 child and adult estimates to determine whether coverage was associated between the two age groups. For children, estimated national seasonal coverage for 2010--11 was compared with 2009--10 national seasonal coverage (4,5). For adults and persons aged ≥6 months, to make valid comparisons across years, coverage for 2009--10 was restricted to the 43 states and DC with available data in 2010--11. Student t tests were used to determine statistical significance in differences between groups and between the 2009--10 and 2010--11 vaccination seasons.
Coverage by Age Group
Among children aged 6 months--17 years, estimated national coverage was 49.0%, 6.7 percentage points higher than 2009--10 national seasonal coverage (42.3%) (Table 1) (4). State-specific coverage for children ranged from 33.2% (Montana) to 85.4% (Hawaii). Coverage among the 43 states and DC for adults aged ≥18 years was 40.9%, similar to 2009--10 seasonal coverage (40.5%); state-specific coverage ranged from 31.6% (Alaska) to 50.5% (Iowa). State-specific child and adult coverage levels had a correlation of 0.39, and coverage levels among children were more variable than those among adults. State-specific coverage in 2010--11 was positively correlated with 2009--10 seasonal coverage for children (r = 0.79) and for adults (r = 0.79).
Among the 43 states and DC, coverage for adults aged 18--49 years for the 2010--11 season was 30.2%, similar to coverage for the 2009--10 season (30.3%); state-specific coverage ranged from 22.1% (Florida) to 43.6% (North Dakota). Coverage for adults aged 50--64 years was 45.6%, comparable to 2009--10 coverage (44.8%); state-specific coverage ranged from 33.2% (Alaska) to 54.2% (Minnesota). Coverage for adults aged ≥65 years was 68.6%, comparable to 2009--10 coverage (68.9%); state-specific coverage ranged from 54.0% (Alaska) to 79.5% (North Carolina). Coverage for adults aged 18--64 years with a medical condition that increased their risk for severe influenza was 48.4% and state-specific coverage ranged from 28.2% (Alaska) to 71.9% (North Dakota).¶
Coverage by Race/Ethnicity
Among all persons aged ≥6 months, coverage among the 43 states and DC was higher for non-Hispanic whites (44.0%) compared with non-Hispanic blacks (38.8%) and Hispanics (40.6%) and similar to coverage for non-Hispanic others (42.8%) (Table 2). Among adults, non-Hispanic whites (43.3%; 95% confidence interval [CI] = 42.7--43.9) had the highest coverage, followed by non-Hispanic others (39.0%; CI = 35.9--42.1), and non-Hispanic blacks (34.9%; CI = 32.5--37.3) and Hispanics (32.4%; CI = 29.7--35.1). Adult coverage for non-Hispanic whites, Hispanics, and non-Hispanic others in 2010--11 was comparable to 2009--10 seasonal levels (43.8%, 30.6%, 37.8%, respectively), but was 3.6 percentage points higher in 2010--11 for non-Hispanic blacks. Among children, national coverage was higher for Hispanics (55.3%; CI = 51.7--58.9) and non-Hispanic others (53.6%; CI = 49.6--57.6) compared with non-Hispanic whites (46.3%; CI = 45.0--47.6), and Hispanics also had higher coverage than non-Hispanic blacks (47.9%; CI = 43.3--52.5). Among children, 2010--11 coverage for non-Hispanic others was comparable to 2009--10 national seasonal levels (51.8%), but was 3.8, 11.4, and 12.4 percentage points higher for non-Hispanic whites (42.5%), Hispanics (43.9%), and non-Hispanic blacks (35.5%), respectively.
Coverage by Month
Of the two age groups with recent ACIP recommendations to receive annual influenza vaccination, coverage levels among children aged 6 months--17 years were higher for all months of the 2010--11 season compared with monthly estimates from the 2009--10 season (Figure). Adults aged 18--49 years had monthly vaccination coverage estimates that were comparable for all vaccination months of the 2009--10 season, except for September and October.
Reported by
Carolyn Furlow, PhD, Amparo G. Gonzalez-Feliciano, MPH, Leah N. Bryan, MS, Gary L. Euler, DrPH, Helen Ding, MD, James A. Singleton, MS, Immunization Svc Div; Lina S. Balluz, ScD, Div of Behavioral Science, Office of Surveillance, Epidemiology, and Laboratory Svcs, CDC. Corresponding contributor: Carolyn Furlow, cfurlow@cdc.gov, 404-639-8407.
Editorial Note
For the 2010--11 season, ACIP recommendations for annual vaccination for all persons aged ≥6 months went into effect, memories of the 2009 H1N1 pandemic were fresh in the public's mind, and approximately 48 million more seasonal vaccine doses were distributed than for the 2009--10 season. A moderate increase in child vaccination coverage was observed compared with coverage for the 2009--10 season, although the increase was not as large as that observed from 2008--09 to 2009--10 among 19 states (5). School-located H1N1 vaccination was used in many communities (6), and that strategy might have found greater use in some areas during the 2010--11 season. Higher coverage in children also might reflect the second full year since expansion of ACIP influenza vaccination recommendations to include all children aged 6 months--18 years, with increased offering by vaccination providers and acceptance by parents (7). Although 2010--11 was the first season the ACIP expanded recommendations to include all adults aged 19--49 years to receive annual influenza vaccination, no significant increase in coverage occurred, underscoring the challenges associated with increasing coverage in this group.
Influenza vaccination coverage between states varied widely, particularly for children and for adults aged 18--64 years with high-risk conditions. In addition, state-level seasonal coverage levels for 2010--11 correlated positively with levels achieved in 2009--10. Lessons learned from states with high vaccination coverage should be imparted to states with lower coverage.
The 2010--11 estimates of national coverage levels and monthly vaccination for children aged 6 months--17 years indicated that children began receiving their vaccinations slightly earlier in the season and received more vaccine overall compared with 2009--10 seasonal levels; for adults aged 18--49 years, coverage levels and monthly vaccination closely mirrored those from 2009--10. During the vaccination period, coverage among children increased more rapidly compared with adults aged 18--49 years. National Influenza Vaccination Week, December 5--11, 2010 (8), was established to highlight the importance of continuing vaccination through December and beyond; its campaign efforts might have contributed to increased coverage levels into December and January, as observed for children in particular.
The pattern of lower influenza vaccination coverage for Hispanics and non-Hispanic blacks compared with non-Hispanic whites among persons aged ≥6 months also has been observed in previous seasons overall (5) and among adults (9). Although racial/ethnic disparities in vaccination coverage among adults persisted, the gap in coverage decreased somewhat. Improved coverage among non-Hispanic black and Hispanic children eliminated racial/ethnic disparities in child coverage during the 2010--11 season. This increase in coverage might be attributed partly to the Vaccines for Children program, which provides vaccines at no cost to children from low-income homes.**
The findings in this report are subject to at least six limitations. First, influenza vaccination status was based on self or parental report, was not validated with medical records, and thus is subject to recall bias. Second, BRFSS and NIS are telephone-based surveys that do not include households without telephone service, and BRFSS data analyzed do not include households with cellular telephone service only. Third, response rates for both surveys were low, and nonresponse bias might remain, even after weighting adjustments to reflect the national population subgroup distribution and nonresponse. Fourth, combining BRFSS and NIS estimates allowed estimation of coverage for all persons aged ≥6 months; however, differences in survey methodology (e.g., different sampling frame, survey design, exact survey question wording, response rates, and weighting) might result in different levels of bias that are averaged for this group. Fifth, BRFSS adult interview data through March were not available for seven states, thus creating potential bias in comparisons between child and adult estimates. Only small differences (range: 0.0--2.9 percentage points) were observed, however, when comparisons between 2009--10 coverage among the 43 states and DC were made with 2009--10 national coverage by age and race/ethnicity group. This suggests that coverage for the seven missing states together did not differ substantially from the nation. Finally, vaccination coverage comparisons of the trivalent formulations between 2010--11 and 2009--10 do not account for persons who received only H1N1 vaccination during 2009--10.
Record high vaccination coverage was sustained during 2010--11, a nonpandemic year, with increases in national coverage observed for children compared with 2009--10 seasonal coverage. Racial/ethnic disparities were not observed among children because of large gains in coverage for non-Hispanic black and Hispanic children compared with 2009--10 levels. In spite of these gains, further work remains to reduce racial/ethnic disparities among adults and to bring annual seasonal vaccination coverage levels up to Healthy People 2020 targets of 80% for persons aged 6 months--64 years, and 90% for adults aged 18--64 years with high-risk conditions and adults aged ≥65 years (10). With universal vaccination recommendations and consistent vaccine availability, substantial opportunities remain to increase coverage further. Expanded access through greater use of pharmacy, workplace, and school venues for vaccination, and better use of evidence-based practices at medical sites (e.g., standing orders, and reminder/recall notification) are important to building on these gains in vaccination coverage.
Acknowledgments
Kennon R. Copeland, PhD, Margrethe Montgomery, MA, Nicholas Davis, MS, Lin Liu, MS, National Opinion Research Center, Chicago, Illinois. State BRFSS coordinators.
References
- CDC. Prevention and control of influenza with vaccines: recommendations of the Advisory Committee on Immunization Practices (ACIP), 2010. MMWR 2010;59(No. RR-8).
- CDC. Seasonal influenza vaccine--total doses distributed. Available at http://www.cdc.gov/flu/professionals/vaccination/vaccinesupply.htm. Accessed April 25, 2011.
- CDC. Vaccinations to prevent diseases: universally recommended vaccinations. In: Guide to community preventive services. Atlanta, GA: US Department of Health and Human Services, CDC; 2011. Available at http://www.thecommunityguide.org/vaccines/universally/index.html. Accessed April 28, 2011.
- CDC. Influenza vaccination coverage, 2009--10 influenza season. Available at http://www.cdc.gov/flu/professionals/vaccination/vaccinecoverage.htm. Accessed April 20, 2011.
- CDC. Interim results: state-specific seasonal influenza vaccination coverage---United States, August 2009--January 2010. MMWR 2010;59:477--84.
- Singleton, JA. Who got H1N1 vaccine? Findings from the U.S. 2009--2010 Influenza Vaccination Surveillance Systems. 44th National Immunization Conference. Atlanta, GA. Available at http://cdc.confex.com/cdc/nic2010/webprogram/Paper23190.html. Accessed June 3, 2011.
- CDC. Prevention and control of influenza with vaccines: recommendations of the Advisory Committee on Immunization Practices (ACIP), 2009. MMWR 2009;58(No. RR-8).
- CDC. National Influenza Vaccination Week---December 5--11, 2010. MMWR 2011;59:1556.
- CDC. Influenza vaccination coverage among children and adults---United States, 2008--09 influenza season. MMWR 2009;58:1091--5.
- US Department of Health and Human Services. Increase the percentage of children and adults who are vaccinated annually against seasonal influenza. Objective IID-12. Healthy people 2020. Washington, DC: US Department of Health and Human Services; 2010; Available at http://www.healthypeople.gov/2020/topicsobjectives2020/objectiveslist.aspx?topicId=23. Accessed June 7, 2011.
* Respondents were asked, "Now I will ask you questions about seasonal flu. A flu shot is an influenza vaccine injected into your arm. During the past 12 months, have you had a seasonal flu shot? During what month and year did you receive your most recent seasonal flu shot? The seasonal flu vaccine sprayed in the nose is also called FluMist. During the past 12 months, have you had a seasonal flu vaccine that was sprayed in your nose? During what month and year did you receive your most recent seasonal flu vaccine that was sprayed in your nose?" BRFSS is an ongoing, state-based, monthly telephone survey that collects information on health conditions and risk behaviors from approximately 400,000 randomly selected persons aged ≥18 years among the noninstitutionalized, U.S. civilian population. Interview data through March 2011 for seven states (California, Louisiana, Michigan, Nevada, Oklahoma, Oregon, and South Dakota) were not reported at the time of this publication and thus were not included. Additional information about BRFSS is available at http://www.cdc.gov/brfss.
† Respondents were asked, "Since August, 2010, has [child] had a flu vaccination? There are two types of flu vaccinations. One is a shot and the other is a spray, mist, or drop in the nose. During what month and year did [child] receive his/her flu vaccine? Was this a shot or the spray in the nose?" NIS is an ongoing, national landline list-assisted random-digit--dialed telephone survey of households with children aged 19--35 months or 13--17 years (NIS-Teen) at the time of interview. A supplemental cellular telephone sample was surveyed as part of the NIS. For children aged 6--18 months and 3--12 years identified during screening households for NIS and NIS-Teen, a short influenza vaccination module was added. Additional information about NIS is available at http://www.cdc.gov/nis.
§ For participants who indicated they had been vaccinated but had a missing month and year of vaccination, this information was imputed from donor pools matched for week of interview, age group, state of residence, and race/ethnicity.
¶ Available monthly 2010--11 vaccination coverage estimates for all states and for additional age groups are available at http://www.cdc.gov/flu/professionals/vaccination/vaccinecoverage.htm.
** More information about the Vaccines for Children program is available at http://www.cdc.gov/vaccines/programs/vfc.
|
TABLE 1. (Continued) Estimated influenza vaccination coverage, by U.S. Department of Health and Human Services (HHS) region, state, and selected age and risk groups --- Behavioral Risk Factor Surveillance System (BRFSS) and National Immunization Survey (NIS), United States, end of February 2011* |
||||||||
|---|---|---|---|---|---|---|---|---|
|
HHS region and state |
Persons aged 18−49 yrs |
Persons aged 50−64 yrs |
Persons aged ≥65 yrs |
Persons aged 18−64 yrs at high risk† |
||||
|
%§ |
(95% CI¶) |
% |
(95% CI) |
% |
(95% CI) |
% |
(95% CI) |
|
|
United States** |
30.2 |
(±1.0) |
45.6 |
(±1.0) |
68.6 |
(±0.8) |
48.4 |
(±2.2) |
|
Region 1 |
36.5 |
(±2.2) |
50.1 |
(±2.0) |
71.6 |
(±1.8) |
54.3 |
(±4.7) |
|
Connecticut |
35.0 |
(±5.1) |
46.3 |
(±4.3) |
70.4 |
(±4.1) |
56.3 |
(±12.0)†† |
|
Maine |
32.4 |
(±3.5) |
47.7 |
(±3.3) |
67.0 |
(±3.1) |
48.7 |
(±6.9) |
|
Massachusetts |
38.9 |
(±3.7) |
52.8 |
(±3.3) |
73.5 |
(±3.1) |
54.2 |
(±7.6) |
|
New Hampshire |
32.8 |
(±4.9) |
47.5 |
(±4.5) |
73.4 |
(±4.3) |
52.3 |
(±11.6)†† |
|
Rhode Island |
36.7 |
(±4.3) |
52.4 |
(±4.7) |
68.2 |
(±3.9) |
57.0 |
(±8.2) |
|
Vermont |
34.3 |
(±4.7) |
51.1 |
(±5.3) |
71.3 |
(±3.7) |
51.3 |
(±11.6)†† |
|
Region 2 |
30.9 |
(±3.9) |
45.4 |
(±2.9) |
69.2 |
(±2.9) |
52.5 |
(±8.6) |
|
New Jersey |
25.8 |
(±2.9) |
43.3 |
(±4.1) |
67.9 |
(±3.5) |
44.8 |
(±6.9) |
|
New York |
34.1 |
(±6.1) |
46.2 |
(±3.9) |
69.8 |
(±4.1) |
56.8 |
(±12.5)†† |
|
Region 3 |
31.3 |
(±2.4) |
48.5 |
(±2.4) |
70.6 |
(±2.2) |
50.5 |
(±5.1) |
|
Delaware |
30.4 |
(±5.9) |
51.1 |
(±6.5) |
70.7 |
(±5.3) |
48.1 |
(±15.7)†† |
|
District of Columbia |
34.1 |
(±7.1) |
47.1 |
(±7.1) |
60.9 |
(±6.1) |
64.4 |
(±19.2)†† |
|
Maryland |
35.2 |
(±4.5) |
52.5 |
(±4.5) |
70.9 |
(±4.1) |
48.2 |
(±9.8) |
|
Pennsylvania |
25.1 |
(±3.7) |
43.2 |
(±3.9) |
68.7 |
(±3.3) |
44.2 |
(±7.8) |
|
Virginia |
36.7 |
(±5.5) |
51.7 |
(±5.3) |
73.1 |
(±4.9) |
58.1 |
(±11.4)†† |
|
West Virginia |
30.2 |
(±4.7) |
51.4 |
(±5.1) |
74.9 |
(±5.1) |
57.8 |
(±10.4)†† |
|
Region 4 |
28.6 |
(±1.8) |
44.4 |
(±2.0) |
70.9 |
(±1.6) |
44.7 |
(±3.9) |
|
Alabama |
27.2 |
(±5.1) |
42.2 |
(±4.5) |
70.4 |
(±4.1) |
47.1 |
(±9.4) |
|
Florida |
22.1 |
(±3.9) |
38.8 |
(±4.7) |
68.7 |
(±3.1) |
35.4 |
(±8.6) |
|
Georgia |
30.7 |
(±4.9) |
44.1 |
(±5.1) |
65.1 |
(±4.9) |
50.5 |
(±11.0)†† |
|
Kentucky |
30.5 |
(±4.7) |
50.2 |
(±4.5) |
71.5 |
(±3.9) |
36.9 |
(±6.5) |
|
Mississippi |
23.4 |
(±3.3) |
44.3 |
(±3.9) |
70.0 |
(±3.1) |
49.0 |
(±9.4) |
|
North Carolina |
30.6 |
(±5.1) |
49.7 |
(±5.9) |
79.5 |
(±5.3) |
40.9 |
(±8.0) |
|
South Carolina |
37.9 |
(±6.3) |
47.7 |
(±5.1) |
72.6 |
(±4.1) |
58.2 |
(±10.2)†† |
|
Tennessee |
33.5 |
(±6.3) |
47.2 |
(±5.3) |
73.2 |
(±4.5) |
55.9 |
(±12.3)†† |
|
Region 5** |
28.5 |
(±2.4) |
44.2 |
(±2.2) |
66.4 |
(±2.2) |
44.9 |
(±4.5) |
|
Illinois |
25.4 |
(±4.7) |
41.2 |
(±4.7) |
63.2 |
(±4.3) |
38.9 |
(±9.2) |
|
Indiana |
27.2 |
(±4.1) |
43.7 |
(±4.3) |
67.4 |
(±4.1) |
48.2 |
(±9.8) |
|
Michigan§§ |
--- |
--- |
--- |
--- |
--- |
--- |
--- |
--- |
|
Minnesota |
39.5 |
(±4.3) |
54.2 |
(±5.1) |
77.6 |
(±4.1) |
59.3 |
(±8.8) |
|
Ohio |
30.1 |
(±3.5) |
47.3 |
(±3.7) |
65.9 |
(±3.7) |
45.4 |
(±7.1) |
|
Wisconsin |
25.4 |
(±4.3) |
39.7 |
(±4.5) |
66.7 |
(±5.5) |
48.8 |
(±11.4)†† |
|
Region 6** |
28.0 |
(±3.7) |
45.9 |
(±3.9) |
64.0 |
(±3.5) |
51.2 |
(±9.0) |
|
Arkansas |
29.5 |
(±6.9) |
42.7 |
(±6.5) |
67.4 |
(±5.1) |
49.8 |
(±13.1)†† |
|
Louisiana§§ |
--- |
--- |
--- |
--- |
--- |
--- |
--- |
--- |
|
New Mexico |
35.4 |
(±6.5) |
45.3 |
(±5.5) |
57.8 |
(±5.7) |
49.0 |
(±14.3)†† |
|
Oklahoma§§ |
--- |
--- |
--- |
--- |
--- |
--- |
--- |
--- |
|
Texas |
27.4 |
(±4.1) |
46.4 |
(±4.5) |
64.1 |
(±4.1) |
52.1 |
(±11.4)†† |
|
Region 7 |
35.5 |
(±2.7) |
46.9 |
(±2.7) |
71.0 |
(±2.4) |
52.0 |
(±6.1) |
|
Iowa |
40.1 |
(±5.3) |
52.1 |
(±4.7) |
77.6 |
(±4.9) |
60.9 |
(±13.7)†† |
|
Kansas |
35.8 |
(±3.5) |
47.8 |
(±3.1) |
72.6 |
(±2.7) |
41.3 |
(±7.1) |
|
Missouri |
32.7 |
(±5.5) |
42.9 |
(±5.7) |
68.9 |
(±4.5) |
56.7 |
(±11.2)†† |
|
Nebraska |
36.7 |
(±3.9) |
50.3 |
(±3.7) |
66.2 |
(±2.7) |
44.4 |
(±7.4) |
|
Region 8** |
33.6 |
(±2.7) |
44.9 |
(±2.4) |
67.4 |
(±2.4) |
49.0 |
(±6.3) |
|
Colorado |
31.6 |
(±4.5) |
42.9 |
(±3.7) |
69.5 |
(±3.9) |
49.0 |
(±10.8)†† |
|
Montana |
25.0 |
(±4.1) |
43.5 |
(±3.9) |
61.8 |
(±3.7) |
41.4 |
(±8.4) |
|
North Dakota |
43.6 |
(±7.1) |
49.8 |
(±5.3) |
64.8 |
(±4.5) |
71.9 |
(±15.3)†† |
|
South Dakota§§ |
--- |
--- |
--- |
--- |
--- |
--- |
--- |
--- |
|
Utah |
39.7 |
(±4.7) |
49.9 |
(±4.7) |
66.6 |
(±4.1) |
50.4 |
(±9.2) |
|
Wyoming |
27.1 |
(±4.9) |
44.2 |
(±5.1) |
63.6 |
(±4.3) |
41.4 |
(±11.2)†† |
|
Region 9** |
30.2 |
(±5.3) |
42.9 |
(±6.9) |
68.0 |
(±3.9) |
48.1 |
(±12.0)†† |
|
Arizona |
29.2 |
(±6.3) |
42.8 |
(±8.4) |
67.3 |
(±4.5) |
46.6 |
(±13.7)†† |
|
California§§ |
--- |
--- |
--- |
--- |
--- |
--- |
--- |
--- |
|
Hawaii |
35.5 |
(±7.3) |
43.5 |
(±5.7) |
69.9 |
(±6.3) |
55.2 |
(±15.5)†† |
|
Nevada§§ |
--- |
--- |
--- |
--- |
--- |
--- |
--- |
--- |
|
Region 10** |
31.0 |
(±2.4) |
42.7 |
(±2.2) |
64.6 |
(±2.4) |
46.0 |
(±5.9) |
|
Alaska |
27.3 |
(±6.1) |
33.2 |
(±6.3) |
54.0 |
(±11.8)†† |
28.2 |
(±13.9)†† |
|
Idaho |
26.9 |
(±4.9) |
39.5 |
(±5.1) |
61.3 |
(±5.1) |
46.2 |
(±10.6)†† |
|
Oregon§§ |
--- |
--- |
--- |
--- |
--- |
--- |
--- |
--- |
|
Washington |
32.4 |
(±2.9) |
44.9 |
(±2.7) |
66.1 |
(±2.5) |
47.8 |
(±7.3) |
|
Median |
32.0 |
46.4 |
68.7 |
49.0 |
||||
|
Range |
22.1--43.6 |
33.2--54.2 |
54.0--79.5 |
28.2−71.9 |
||||
|
* Coverage estimates are for persons interviewed during September 2010--March 2011, with reported vaccination during August 2010--February 2011. † Includes persons with asthma, diabetes, or heart disease. § Percentages are weighted to the noninstitutionalized, U.S. civilian population. Month of vaccination was imputed for respondents with a reported vaccination and a missing vaccination month. ¶ Confidence interval. ** National and corresponding regional estimates for all age subgroups that include adults exclude California, Louisiana, Michigan, Nevada, Oklahoma, Oregon, and South Dakota because March interview data were unavailable. †† Estimates might be unreliable because confidence interval half-width is >10. §§ Data for adults were not available because of missing March interviews. Sample size corresponds to children aged 6 months--17 years only. |
||||||||
|
TABLE 2. (Continued) Estimated influenza vaccination coverage, by U.S. Department of Health and Human Services (HHS) region, state, and selected race/ethnicity --- Behavioral Risk Factor Surveillance System (BRFSS) and National Immunization Survey (NIS), United States, end of February 2011* | ||||||||||||
|---|---|---|---|---|---|---|---|---|---|---|---|---|
|
HHS region and state |
White, non-Hispanic persons aged ≥6 mos |
Black, non-Hispanic persons aged ≥6 mos |
Hispanic persons aged ≥6 mos |
Persons of other race/ethnicity aged ≥6 mos | ||||||||
|
No.† |
%§ |
(95% CI¶) |
No. |
% |
(95% CI) |
No. |
% |
(95% CI) |
No. |
% |
(95% CI) |
|
|
Region 7 |
25,283 |
46.6 |
(±1.7) |
990 |
29.2 |
(±6.7) |
1,177 |
41.1 |
(±6.7) |
981 |
49.4 |
(±8.6) |
|
Iowa |
4,602 |
51.0 |
(±3.1) |
87 |
38.6 |
(±21.1)†† |
173 |
46.7 |
(±14.1)†† |
108 |
42.3 |
(±18.2)†† |
|
Kansas |
6,531 |
47.3 |
(±2.4) |
285 |
33.1 |
(±10.8)†† |
403 |
39.5 |
(±12.9)†† |
310 |
52.2 |
(±11.6)†† |
|
Missouri |
3,665 |
44.6 |
(±3.4) |
433 |
23.8 |
(±7.6) |
141 |
34.4 |
(±12.6)†† |
253 |
52.6 |
(±13.4)†† |
|
Nebraska |
10,485 |
44.8 |
(±2.4) |
185 |
54.0 |
(±15.7)†† |
460 |
48.3 |
(±11.7)†† |
310 |
37.9 |
(±12.6)†† |
|
Region 8** |
23,661 |
43.4 |
(±1.7) |
194 |
35.9 |
(±14.7)†† |
1,660 |
48.7 |
(±7.1) |
1,603 |
43.5 |
(±8.1) |
|
Colorado |
5,070 |
43.0 |
(±2.8) |
107 |
34.1 |
(±16.4)†† |
785 |
49.1 |
(±8.7) |
311 |
44.0 |
(±12.9)†† |
|
Montana |
5,100 |
36.0 |
(±2.8) |
---§§ |
---§§ |
---§§ |
128 |
51.2 |
(±22.1)†† |
630 |
36.8 |
(±9.5) |
|
North Dakota |
3,719 |
49.9 |
(±3.7) |
---§§ |
---§§ |
---§§ |
71 |
44.0 |
(±21.4)†† |
227 |
43.3 |
(±18.2)†† |
|
South Dakota*** |
--- |
--- |
--- |
--- |
--- |
--- |
--- |
--- |
--- |
--- |
--- |
--- |
|
Utah |
5,577 |
46.2 |
(±3.3) |
---§§ |
---§§ |
---§§ |
394 |
48.2 |
(±11.8)†† |
252 |
50.7 |
(±12.2)†† |
|
Wyoming |
4,195 |
40.1 |
(±3.5) |
---§§ |
---§§ |
---§§ |
282 |
46.6 |
(±21.4)†† |
183 |
35.1 |
(±16.2)†† |
|
Region 9** |
4,556 |
42.2 |
(±4.1) |
154 |
---¶¶ |
---¶¶ |
1,452 |
45.6 |
(±9.3) |
2,738 |
49.0 |
(±5.2) |
|
Arizona |
3,503 |
41.4 |
(±4.4) |
111 |
---¶¶ |
---¶¶ |
1,090 |
41.5 |
(±7.9) |
449 |
45.6 |
(±9.8) |
|
California*** |
--- |
--- |
--- |
--- |
--- |
--- |
--- |
--- |
--- |
--- |
--- |
--- |
|
Hawaii |
1,053 |
50.7 |
(±7.5) |
43 |
71.4 |
(±25.0)†† |
362 |
46.5 |
(±6.9) |
2,289 |
52.1 |
(±5.4) |
|
Nevada*** |
--- |
--- |
--- |
--- |
--- |
--- |
--- |
--- |
--- |
--- |
--- |
--- |
|
Region 10** |
16,790 |
39.8 |
(±1.6) |
243 |
49.3 |
(±17.0)†† |
1,247 |
48.2 |
(±11.0)†† |
1,894 |
39.2 |
(±5.0) |
|
Alaska |
1,588 |
30.2 |
(±4.4) |
55 |
---¶¶ |
---¶¶ |
129 |
59.4 |
(±15.4)†† |
701 |
39.1 |
(±8.7) |
|
Idaho |
3,994 |
37.2 |
(±3.3) |
---§§ |
---§§ |
---§§ |
325 |
51.0 |
(±19.7)†† |
165 |
21.0 |
(±9.9) |
|
Oregon*** |
--- |
--- |
--- |
--- |
--- |
--- |
--- |
--- |
--- |
--- |
--- |
--- |
|
Washington |
11,208 |
41.7 |
(±2.0) |
173 |
53.3 |
(±21.9)†† |
793 |
48.0 |
(±12.7)†† |
1,028 |
39.4 |
(±6.0) |
|
Median |
4,240 |
44.8 |
487 |
40.6 |
277 |
46.5 |
266 |
43.6 |
||||
|
Range |
1,053--11,208 |
30.2--52.2 |
35−2,066 |
23.8--79.3 |
56--4,243 |
25.1--61.6 |
90--2,289 |
21--63.8 |
||||
|
* Coverage estimates are for persons interviewed during September 2010--March 2011 with reported vaccination during August 2010−February 2011. † Unweighted sample size. § Percentages are weighted to the noninstitutionalized, U.S. civilian population. Month of vaccination was imputed for respondents with a reported vaccination and a missing vaccination month. ¶ Confidence interval. ** National and corresponding regional estimates exclude California, Louisiana, Michigan, Nevada, Oklahoma, Oregon, and South Dakota because March interview data were unavailable. †† Estimates might be unreliable because confidence interval half-width is >10. §§ Estimates not reliable because sample size is <30. ¶¶ Estimates not reliable because relative standard error is >0.3. *** Data for adults were not available because of missing March interviews. |
||||||||||||
FIGURE. Estimated cumulative seasonal influenza vaccination coverage for children aged 6 months--17 years and adults aged 18--49 years, by month --- Behavioral Risk Factor Surveillance System (BRFSS) and National Immunization Survey (NIS), United States, 2009--2011*
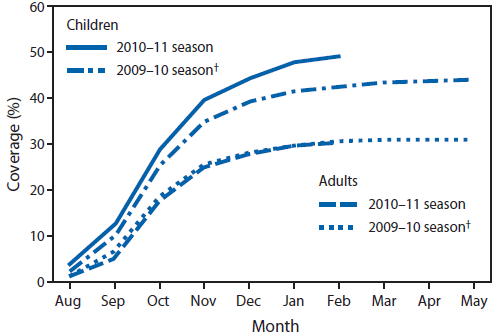
* Coverage estimates for children are from NIS and include all 50 states and the District of Columbia. Coverage estimates for adults are from BRFSS and include 43 states and the District of Columbia.
† Does not account for persons who received only influenza A (H1N1) vaccine.
Alternate Text: The figure above shows estimated cumulative seasonal influenza vaccination coverage for children aged 6 months–17 years and adults aged 18–49 years, by month, in the United States from 2009–2011, according to Behavioral Risk Factor Surveillance System (BRFSS) and National Immunization Survey (NIS). Of the two age groups with recent ACIP recommendations to receive annual influenza vaccination, coverage levels among children aged 6 months–17 years were higher for all months of the 2010–11 season compared with monthly estimates from the 2009–10 season.
What is already known on this topic?
The 2010--11 influenza season was distinct in that it followed the 2009 influenza A pandemic (H1N1) season and it was the first season in which the Advisory Committee on Immunization Practices (ACIP) recommended influenza vaccination of all persons aged ≥6 months. The season also was notable because a record number of influenza vaccine doses (approximately 163 million) were distributed in the United States for the season.
What is added by this report?
Vaccination coverage among 43 states and the District of Columbia for persons aged ≥6 months during 2010--11 suggests that the record high national vaccination coverage observed in 2009--10 was sustained during this nonpandemic season, although more improvement is needed to reach Healthy People 2020 coverage targets. Improved coverage among non-Hispanic black and Hispanic children eliminated racial/ethnic disparities in child coverage during the 2010--11 season.
What are the implications for public health practice?
Vaccination providers should implement proven strategies for improving vaccination coverage, such as office-based protocols that include reminder/recall notification and standing orders, and health departments should adopt best practices to facilitate effective vaccination services and increase opportunities for vaccination at schools, pharmacies and stores, workplaces, and other nonmedical sites.
Use of trade names and commercial sources is for identification only and does not imply endorsement by the U.S. Department of Health and Human Services. |
All MMWR HTML versions of articles are electronic conversions from typeset documents. This conversion might result in character translation or format errors in the HTML version. Users are referred to the electronic PDF version (http://www.cdc.gov/mmwr)
and/or the original MMWR paper copy for printable versions of official text, figures, and tables. An original paper copy of this issue can be obtained from the Superintendent of Documents, U.S. Government Printing Office (GPO), Washington, DC 20402-9371; telephone: (202) 512-1800. Contact GPO for current prices.
**Questions or messages regarding errors in formatting should be addressed to mmwrq@cdc.gov.
