Persons using assistive technology might not be able to fully access information in this file. For assistance, please send e-mail to: mmwrq@cdc.gov. Type 508 Accommodation and the title of the report in the subject line of e-mail.
Tobacco Use Among Middle and High School Students --- United States, 2000--2009
Tobacco use continues to be the single leading preventable cause of death and disease in the United States (1). More than 80% of established adult smokers begin smoking before age 18 years (2). To monitor trends in tobacco use among middle and high school students, CDC analyzed 2000--2009 data from the National Youth Tobacco Survey (NYTS), a school-based survey that collects information on tobacco use and related behaviors and attitudes from middle school (grades 6--8) and high school (grades 9--12) students. This analysis indicated that in 2009, 8.2% of middle school students and 23.9% of high school students reported current use of any tobacco product; 5.2% of middle school students and 17.2% of high school students reported current use of cigarettes. Overall prevalence did not decrease from 2006 to 2009 for use of any tobacco product among either group. During 2000--2009, the prevalence of current tobacco use among middle school students declined (15.1% to 8.2%), as did current cigarette use (11.0% to 5.2%) and cigarette smoking experimentation (29.8% to 15.0%). Similar trends were observed for high school students (current tobacco use: 34.5% to 23.9%; current cigarette use: 28.0% to 17.2%; cigarette smoking experimentation: 39.4% to 30.1%). Overall, no change in susceptibility to initiate cigarette smoking was observed for either group. To further decrease tobacco use and susceptibility to use among youths, restrictions on advertising, promotion, and availability of tobacco products to youths should be combined with full implementation of evidence-based, communitywide, comprehensive tobacco control policies (3--5).
NYTS includes measures on prevalence of youth tobacco use, smoking cessation, tobacco-related knowledge and attitudes, access to tobacco, media and advertising, and secondhand smoke exposure and has been conducted approximately every 2 years since 2000 (6). The 2009 NYTS used a three-stage cluster sampling procedure to generate a cross-sectional, nationally representative sample of students in grades 6--12 from all 50 states and the District of Columbia. Of 222 randomly selected schools, 205 (92.3%) participated; of 24,666 students randomly selected at the participating schools, 22,679 (91.9%) participated, yielding an overall response rate of 84.8% (school response rate × student participation rate). During 2000--2009, overall response rates ranged from 74.2% in 2002 to 84.8% in 2009. In all years, middle and high school students were asked to complete a self-administered, pencil and paper questionnaire in a classroom setting.
Respondents were asked about their use of cigarettes, cigars, smokeless tobacco, pipes, bidis (small brown cigarettes wrapped in a leaf), and kreteks (clove cigarettes) within the last 30 days. Each type of tobacco was asked about individually. For each substance, current use was defined as use on at least 1 of the past 30 days. Cigarette smoking experimentation was defined as having ever smoked any cigarettes, even one or two puffs, but fewer than 100 cigarettes (7). Cigarette smoking experimentation and current cigarette use are not mutually exclusive. A person who is an experimenter might or might not be classified as a current smoker. Those who were susceptible to initiate cigarette smoking were defined as never smokers (never tried smoking cigarettes, even one or two puffs) who reported being open to trying cigarette smoking* (7).
Data were adjusted for nonresponse and weighted to provide national prevalence estimates while accounting for the complex survey design; 95% confidence intervals were calculated. Differences in point estimates between the 2006 NYTS† and the 2009 survey were assessed using a two-tailed t-test at a p<0.05 significance level. Logistic regression was used to analyze temporal changes during 2000--2009 for middle and high school students. For this 10-year trend analysis, results were adjusted for grade, race/ethnicity, and sex to control for any changes in population composition during this period. Results were assessed for the presence of linear trends; p<0.05 was used to determine statistical significance. A test for linear trend will be significant if an overall decrease or increase occurs during the study period. If a linear trend was detected, data also were assessed for the presence of a quadratic trend; a significant quadratic trend indicates that the rate of change accelerates or decelerates across the study period.
In 2009, 8.2% of middle school students and 23.9% of high school students reported current use of any tobacco product, and 5.2% of middle school students and 17.2% of high school students reported current use of cigarettes (Table). Among middle school students, the most commonly used forms of tobacco other than cigarettes were cigars (3.9%), smokeless tobacco (2.6%), pipes (2.3%), bidis (1.6%), and kreteks (1.2%). Among high school students, the most commonly used other forms of tobacco were cigars (10.9%), smokeless tobacco (6.7%), pipes (3.9%), kreteks (2.4%), and bidis (2.4%). Susceptibility to initiate cigarette smoking was 21.2% in middle school students and 24.0% in high school students.
Prevalence did not change from 2006 to 2009 for any of these measures for either middle school students of high school students overall. Decreases were noted only among middle school students for current cigarette use in females (6.4% to 4.7%) and in non-Hispanic whites (6.5% to 4.3%) (Table). Among high school students, declines were observed only in females for current tobacco use (21.3% to 18.2%) and current cigarette use (18.4% to 14.8%); and in non-Hispanic whites for current bidi use (2.6% to 1.7%).
From 2000 to 2009, among middle school students, declines were observed for current tobacco use (15.1% to 8.2%), current cigarette use (11.0% to 5.2%), and cigarette smoking experimentation (29.8% to 15.0%). For these three measures, after adjusting for grade, race/ethnicity, and sex, the overall declines remained. The quadratic analyses did not show changes in the rates of decline within the study period (Figure 1). No overall decline in susceptibility to smoking among middle school students was observed for the study period. Similarly, from 2000 to 2009, among high school students, declines were observed for current tobacco use (34.5% to 23.9%), current cigarette use (28.0% to 17.2%), and experimentation (39.4% to 30.1%). After adjusting for grade, race/ethnicity and sex, the overall declines remained. The quadratic analyses did not show changes in the rates of decline within the study period (Figure 2). During this same period, no overall decline in prevalence of susceptibility to smoking among high school students was observed.
Reported by
RA Arrazola, MPH, SR Dube, PhD, RB Kaufmann, PhD, RS Caraballo, PhD, T Pechacek, PhD, Office on Smoking and Health, National Center for Chronic Disease Prevention and Health Promotion, CDC.
Editorial Note
The findings in this report indicate that, from 2000 to 2009, prevalences of current tobacco and cigarette use and experimentation with smoking cigarettes declined for middle school and high school students, but no overall declines were noted for the 2006--2009 period. Declines were seen only for a few measures within a few population subgroups. The general lack of significant change during the shorter period indicates that the current rate of decline in tobacco use is relatively slow. These findings are consistent with the findings from the national Youth Risk Behavior Survey (YRBS) for recent years (8). Although NYTS was not administered before 2000, YRBS results indicate that the rate of decline in youth smoking was slower during 2003--2009 than during 1997--2003, and that these declines follow years of increase in prevalence of youth cigarette use in the 1990s (8). Cigarette use among high school students remains above the Healthy People 2010 target of ≤16% prevalence, and overall tobacco use remains above the target of no more than 21% prevalence.§
The overall point prevalence estimates for current high school smoking differed slightly between the NYTS (17.2%) and the national YRBS (19.5%) (8) in 2009, the only year in which both surveys were conducted. The observed differences might be the result of variation between the samples of schools selected for the survey, differences in response rates, or student reactions to the single topic context of NYTS versus the multiple-topic context of YRBS. The two surveys are complementary. The national YRBS measures other youth risk behaviors that are public health priorities and that are used to track Healthy People 2010 objectives, whereas the NYTS focuses specifically on tobacco related indicators and includes additional measures not included on the national YRBS: use of pipes, bidis, and kreteks, access to products, exposure to advertisements, and susceptibility to initiation of cigarette smoking.
The lack of change in susceptibility to try cigarette smoking might help explain the recent slowing in decline in current smoking (8). Susceptibility indicates the proportion of youths who are willing to experiment with cigarette use (9) and is an important indicator of the effectiveness of tobacco control policies. The findings from this report suggest further efforts are needed to counter tobacco industry influences on youths. New Food and Drug Administration (FDA) regulations which prohibit the distribution of free samples of cigarettes and restrict the distribution of free samples of smokeless tobacco to youths, and prohibit tobacco brand name sponsorship of any athletic, musical or other social or cultural events, are designed to help prevent tobacco use among youths.¶ Broader tobacco-control policies, such as tobacco-free policies, tobacco tax increases, and advertisement restrictions are needed to further reduce youth and adult tobacco use (4).
The findings in this report are subject to at least three limitations. First, because NYTS began in 2000, trend analyses cannot capture the increases in youth cigarette use that occurred in the early 1990s nor the faster rate of decline that was observed by YRBS for the late 1990s compared with more recent years. Second, the data were collected from youths who attended middle or high schools and might not be representative of all youths in the United States; youths who have dropped out of school are more likely to smoke than are youths who are in school (10). Finally, response and recall bias might have been introduced because the data are self-reported; however, similar questions on YRBS showed good test-retest reliability (8).
Although comprehensive tobacco control programs are effective in decreasing tobacco use in the United States, they remain underfunded.** Based on estimates obtained from the Campaign for Tobacco Free Kids for fiscal year 2010, only one state (North Dakota) achieved the funding level recommended by CDC in 2007.†† The more states spend on sustained comprehensive tobacco control programs, the greater the reductions in youth and adult smoking rates (3,4). Comprehensive tobacco control programs should be fully funded and implemented, as recommended by CDC (3,4). In addition, enforcement of the new FDA regulations and the Family Smoking Prevention and Tobacco Control Act§§ provisions, which require larger, graphic health warnings on cigarette packages and in advertisements, restrict access to tobacco by youths, and restrict certain other forms of advertising and promotion attractive to youths, could change social norms concerning cigarette and other tobacco use (4). Changes in social norms might help reduce youth susceptibility to try cigarettes and other tobacco products and accelerate the decline in tobacco use among youths.
Acknowledgment
The findings in this report are based, in part, on contributions by R Lowry, MS, Div of Adolescent and School Health, CDC.
References
- US Department of Health and Human Services. The health consequences of smoking: a report of the Surgeon General. Atlanta, GA: US Department of Health and Human Services, CDC; 2004. Available at http://www.cdc.gov/tobacco/data_statistics/sgr/2004/index.htm. Accessed March 11, 2010.
- Substance Abuse and Mental Health Services Administration. Results from the 2008 National Survey on Drug Use and Health: national findings. Rockville, MD: US Department of Health and Human Services, Substance Abuse and Mental Health Services Administration; 2009. Available at http://www.oas.samhsa.gov/nsduh/2k8nsduh/2k8results.pdf. Accessed August 20, 2010.
- CDC. Best practices for comprehensive tobacco control programs--2007. Atlanta, GA: US Department of Health and Human Services, CDC; 2007. Available at http://www.cdc.gov/tobacco/tobacco_control_programs/stateandcommunity/best_practices/index.htm. Accessed May 3, 2010.
- CDC. CDC Grand Rounds: current opportunities in tobacco control. MMWR 2010;59:487--92.
- National Cancer Institute. The role of the media in promoting and reducing tobacco use. Tobacco Control Monograph No. 19. Bethesda, MD: US Department of Health and Human Services, National Institutes of Health, National Cancer Institute; 2008. Available at http://cancercontrol.cancer.gov/tcrb/monographs/19/index.html. Accessed August 20, 2010.
- CDC. Youth tobacco surveillance---United States, 2000. MMWR 2001;50(No. SS-4).
- Mowery PD, Farrelly MC, Haviland ML, Gable JM, Wells HE. Progression to established smoking among U.S. youth. Am J Public Health 2004;94:331--7.
- CDC. Cigarette use among high school students---United States, 1991--2009. MMWR 2010;59:797--801.
- CDC. Key outcome indicators for evaluating comprehensive tobacco control programs. Atlanta, GA: US Department of Health and Human Services, CDC; 2005.
- Townsend L, Flisher A, King G. A systematic review of the relationship between high school dropout and substance use. Clin Child Fam Psychol Rev 2007;10:295--317.
* Susceptibility to initiate cigarette smoking among never smokers was defined as providing any response other than "no" to the question, "Do you think that you will try a cigarette soon?" and any response other than "definitely not" to the questions, "Do you think you will smoke a cigarette anytime during the next year?" and "If one of your best friends offered you a cigarette, would you smoke it?"
† Available at http://www.cdc.gov/tobacco/data_statistics/surveys/nyts/pdfs/indicators.pdf, http://www.cdc.gov/tobacco/data_statistics/surveys/nyts/pdfs/table_1_06.pdf, and http://www.cdc.gov/tobacco/data_statistics/surveys/nyts/pdfs/table_2_06.pdf.
§ Objective 27-2. Reduce tobacco use by adolescents. Data available at http://wonder.cdc.gov/data2010/obj.htm.
¶ Additional information available at http://www.fda.gov/tobaccoproducts/protectingkidsfromtobacco/default.htm.
** Additional information available at http://tobaccofreekids.org/reports/settlements/2009/fullreport.pdf.
†† Additional information available at http://www.tobaccofreekids.org/research/factsheets/pdf/0219.pdf.
§§ Available at http://www.gpo.gov/fdsys/pkg/PLAW-111publ31/html/PLAW-111publ31.htm.
What is already known on this topic?
Smoking continues to be the leading preventable cause of death and disability in the United States; and among adult established smokers in the United States, more than 80% began smoking before age 18 years.
What is added by this report?
From 2000 to 2009, prevalences of current tobacco and cigarette use and experimentation with smoking cigarettes have declined for middle school and high schools students but no overall significant declines were noted from 2006--2009. The proportions of middle school and high school students who have never tried cigarette smoking but are open to trying cigarette smoking have not changed significantly in the past 9 years.
What are the implications for public health practice?
To further decrease tobacco use and susceptibility to use among youths, restrictions in advertising, promotions, and the commercial availability of tobacco products should be combined with full implementation of evidence-based, communitywide, comprehensive tobacco control policies.
|
TABLE. (Continued) Percentage of middle and high school students who currently use* tobacco, by product, school level, sex, and race/ethnicity --- National Youth Tobacco Survey, United States, 2006 and 2009 |
||||||||
|---|---|---|---|---|---|---|---|---|
|
Smokeless tobacco |
Pipes |
Bidis |
Kreteks |
|||||
|
2006 |
2009 |
2006 |
2009 |
2006 |
2009 |
2006 |
2009 |
|
|
% |
% |
% |
% |
% |
% |
% |
% |
|
|
Characteristic |
(95% CI§) |
(95% CI) |
(95% CI) |
(95% CI) |
(95% CI) |
(95% CI) |
(95% CI) |
(95% CI) |
|
Middle school |
||||||||
|
Sex |
||||||||
|
Female |
1.2 |
1.4 |
1.3 |
1.7 |
1.5 |
1.2 |
1.0 |
0.7 |
|
(0.8--1.6) |
(0.9--1.9) |
(0.9--1.7) |
(1.1--2.3) |
(1.2--1.8) |
(0.7--1.7) |
(0.6--1.4) |
(0.4--1.0) |
|
|
Male |
4.1 |
3.7 |
3.0 |
2.7 |
1.9 |
2.0 |
1.7 |
1.6 |
|
(3.1--5.1) |
(2.6--4.8) |
(2.4--3.6) |
(2.0--3.4) |
(1.4--2.4) |
(1.4--2.6) |
(1.3--2.1) |
(1.1--2.1) |
|
|
Race/Ethnicity |
||||||||
|
White, non-Hispanic |
2.8 |
2.5 |
1.9 |
1.5 |
1.2 |
1.1 |
1.1 |
0.8 |
|
(2.0--3.6) |
(1.8--3.2) |
(1.3--2.5) |
(1.1--1.9) |
(0.8--1.6) |
(0.7--1.5) |
(0.8--1.4) |
(0.5--1.1) |
|
|
Black, non-Hispanic |
1.7 |
1.7 |
1.5 |
1.9 |
2.3 |
1.9 |
1.7 |
1.4 |
|
(1.0--2.4) |
(1.0--2.4) |
(0.9--2.1) |
(1.1--2.7) |
(1.4--3.2) |
(1.0--2.8) |
(1.0--2.4) |
(0.7--2.1) |
|
|
Hispanic |
3.4 |
2.5 |
4.3 |
4.5 |
3.3 |
2.6 |
2.6 |
1.8 |
|
(2.6--4.2) |
(1.8--3.2) |
(3.5--5.1) |
(3.1--5.9) |
(2.6--4.0) |
(1.7--3.5) |
(1.9--3.3) |
(1.1--2.5) |
|
|
Asian, non-Hispanic |
2.0 |
1.7 |
2.2 |
1.4 |
1.9 |
1.6 |
1.2 |
0.9 |
|
(0.7--3.3) |
(0.2--3.2) |
(0.9--3.5) |
(0.2--2.6) |
(0.3--3.2) |
(0.3--2.9) |
(0.4--2.0) |
(-0.1--1.9) |
|
|
Total |
2.6 |
2.6 |
2.2 |
2.3 |
1.7 |
1.6 |
1.4 |
1.2 |
|
(2.0--3.2) |
(2.0--3.2) |
(1.8--2.6) |
(1.8--2.8) |
(1.4--2.0) |
(1.2--2.0) |
(1.2--1.6) |
(0.9--1.5) |
|
|
High school |
||||||||
|
Sex |
||||||||
|
Female |
1.5 |
1.8 |
1.8 |
2.5 |
2.4 |
2.1 |
2.0 |
1.9 |
|
(1.1--1.9) |
(1.2--2.4) |
(1.3--2.3) |
(1.8--3.2) |
(2.0--2.8) |
(1.6--2.6) |
(1.5--2.5) |
(1.1--2.7) |
|
|
Male |
11.0 |
11.6 |
5.6 |
5.3 |
3.3 |
2.7 |
3.6 |
2.9 |
|
(9.1--12.9) |
(7.8--15.4) |
(4.8--6.4) |
(4.4--6.2) |
(2.8--3.8) |
(2.0--3.4) |
(2.9--4.3) |
(2.3--3.5) |
|
|
Race/Ethnicity |
||||||||
|
White, non-Hispanic |
7.5 |
8.5 |
3.6 |
3.3 |
2.6 |
1.7¶ |
3.0 |
2.4 |
|
(6.1--8.9) |
(6.0--11.0) |
(3.0--4.2) |
(2.5--4.1) |
(2.2--3.0) |
(1.2--2.2) |
(2.3--3.7) |
(1.8--3.0) |
|
|
Black, non-Hispanic |
1.8 |
1.7 |
2.2 |
3.6 |
2.7 |
3.7 |
1.8 |
1.8 |
|
(1.2--2.4) |
(0.2--3.2) |
(1.5--2.9) |
(2.4--4.8) |
(2.0--3.4) |
(1.7--5.7) |
(1.2--2.4) |
(0.9--2.7) |
|
|
Hispanic |
4.6 |
4.8 |
5.3 |
6.8 |
4.6 |
3.7 |
3.2 |
2.9 |
|
(3.3--5.9) |
(3.2--6.4) |
(4.2--6.4) |
(4.1--9.5) |
(3.8--5.4) |
(2.6--4.8) |
(2.4--4.0) |
(1.9--3.9) |
|
|
Asian, non-Hispanic |
1.5 |
4.9 |
1.5 |
3.4 |
1.2 |
3.1 |
1.4 |
2.0 |
|
(0.3--2.7) |
(0.0--9.8) |
(0.5--2.5) |
(0.8--6.0) |
(0.1--2.3) |
(-1.1--7.3) |
(0.4--2.4) |
(-0.2--4.2) |
|
|
Total |
6.1 |
6.7 |
3.7 |
3.9 |
2.9 |
2.4 |
2.8 |
2.4 |
|
(5.0--7.2) |
(4.6--8.8) |
(3.2--4.2) |
(3.3--4.5) |
(2.5--3.3) |
(1.9--2.9) |
(2.3--3.3) |
(2.0--2.8) |
|
|
* Current use of cigarettes was determined by asking, "During the past 30 days, on how many days did you smoke cigarettes?"; Current use of cigars was determined by asking, "During the past 30 days, on how many days did you smoke cigars, cigarillos, or little cigars?; Current use of smokeless tobacco was determined by asking, "During the past 30 days, on how many days did you use chewing tobacco, snuff, or dip?"; Current use of pipe was determined by asking, "During the past 30 days, on how many days did you smoke tobacco in a pipe?"; Current use of bidis was determined by asking, "During the past 30 days, on how many days did you smoke bidis?"; Current use of kreteks was determined by asking, "During the past 30 days, on how many days did you smoke kreteks?" Current use was use on ≥1 day. † Any tobacco is use of cigarettes or cigars or smokeless tobacco or tobacco pipes or bidis or kreteks on at least 1 day in the past 30 days. § Confidence interval. ¶ Result significant, p-value for difference between 2006 and 2009 prevalences <0.05. |
||||||||
FIGURE 1. Susceptibility to initiate cigarette smoking among never smokers,* cigarette smoking experimentation,† current cigarette use,§ and current tobacco use¶ among adolescents in middle school --- National Youth Tobacco Survey, United States, 2000--2009
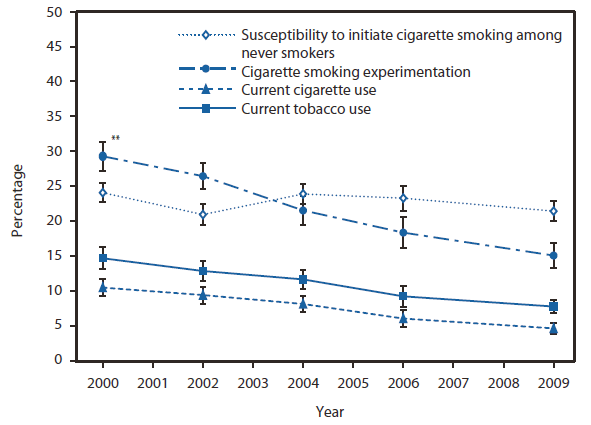
* Susceptibility to initiate cigarette smoking among never smokers was defined as providing any response other than "no" to the question, "Do you think that you will try a cigarette soon?" and any response other than "definitely not" to the questions, "Do you think you will smoke a cigarette anytime during the next year?" and "If one of your best friends offered you a cigarette, would you smoke it?"
† Cigarette smoking experimentation and current cigarette use are not mutually exclusive, meaning that a person who is an experimenter might or might not be classified as a current smokers or a current smoker might or might not be classified as an experimenter.
§ Current cigarette use was defined as having used cigarettes on at least 1 day during the past 30 days.
¶ Current tobacco use was defined as having used cigarettes, smokeless tobacco, cigars, pipes, bidis, or kreteks on at least 1 day during the past 30 days.
** 95% confidence interval.
Alternate Text: The above figure shows the susceptibility to initiate cigarette smoking among never smokers, cigarette smoking experimentation, current cigarette use, and current tobacco use among adolescents in middle school in the United States during 2000-2009, based on results from the National Youth Tobacco Survey. From 2000 to 2009, among middle school students, declines were observed for current tobacco use (15.1% to 8.2%), current cigarette use (11.0% to 5.2%), and cigarette smoking experimentation (29.8% to 15.0%). For these three measures, after adjusting for grade, race/ethnicity, and sex, the overall declines remained. The quadratic analyses did not show changes in the rates of decline during the study period.
FIGURE 2. Susceptibility to initiate cigarette smoking among never smokers,* cigarette smoking experimentation,† current cigarette use,§ and current tobacco use¶ among adolescents in high school --- National Youth Tobacco Survey, United States, 2000--2009
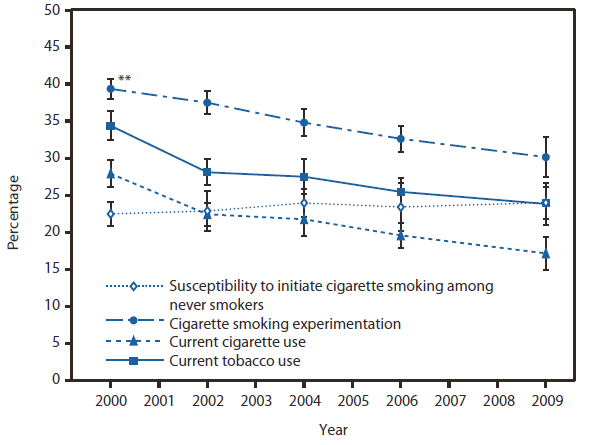
* Susceptibility to initiate cigarette smoking among never smokers was defined as providing any response other than "no" to the question, "Do you think that you will try a cigarette soon?" and any response other than "definitely not" to the questions, "Do you think you will smoke a cigarette anytime during the next year?" and "If one of your best friends offered you a cigarette, would you smoke it?"
† Cigarette smoking experimentation and current cigarette use are not mutually exclusive, meaning that a person who is an experimenter might or might not be classified as a current smokers or a current smoker might or might not be classified as an experimenter.
§ Current cigarette use was defined as having used cigarettes on at least 1 day during the past 30 days.
¶ Current tobacco use was defined as having used cigarettes, smokeless tobacco, cigars, pipes, bidis, or kreteks on at least 1 day during the past 30 days.
** 95% confidence interval.
Alternate Text: The figure above shows the susceptibility to initiate cigarette smoking among never smokers, cigarette smoking experimentation, current cigarette use, and current tobacco use among adolescents in high school in the United States during 2000-2009, based on results from the National Youth Tobacco Survey. From 2000 to 2009, among high school students, declines were observed for current tobacco use (34.5% to 23.9%), current cigarette use (28.0% to 17.2%), and experimentation (39.4% to 30.1%). After adjusting for grade, race/ethnicity and sex, the overall declines remained. During this same period, no overall decline in prevalence of susceptibility to smoking among high school students was observed.
Use of trade names and commercial sources is for identification only and does not imply endorsement by the U.S. Department of
Health and Human Services.
References to non-CDC sites on the Internet are
provided as a service to MMWR readers and do not constitute or imply
endorsement of these organizations or their programs by CDC or the U.S.
Department of Health and Human Services. CDC is not responsible for the content
of pages found at these sites. URL addresses listed in MMWR were current as of
the date of publication.
All MMWR HTML versions of articles are electronic conversions from typeset documents.
This conversion might result in character translation or format errors in the HTML version.
Users are referred to the electronic PDF version (http://www.cdc.gov/mmwr)
and/or the original MMWR paper copy for printable versions of official text, figures, and tables.
An original paper copy of this issue can be obtained from the Superintendent of Documents, U.S.
Government Printing Office (GPO), Washington, DC 20402-9371;
telephone: (202) 512-1800. Contact GPO for current prices.
**Questions or messages regarding errors in formatting should be addressed to
mmwrq@cdc.gov.
