 |
|
|
|
|
|
|
| ||||||||||
|
|
|
|
|
|
|
||||
| ||||||||||
|
|
|
|
|
Persons using assistive technology might not be able to fully access information in this file. For assistance, please send e-mail to: mmwrq@cdc.gov. Type 508 Accommodation and the title of the report in the subject line of e-mail. Youth Tobacco Surveillance --- United States, 2000Please note: An erratum has been published for this article. To view the erratum, please click here. Office on Smoking and Health AbstractProblem/Condition: Tobacco use is the single leading preventable cause of death in the United States, accounting for approximately 430,000 deaths each year. The prevalence of cigarette smoking nationwide among high school students increased during the 1990s, peaking during 1996--1997, then began a gradual decline. Approximately 80% of tobacco users initiate use before age 18 years. If the trend in early initiation of cigarette smoking continues, approximately 5 million children aged <18 years who are living today will die prematurely because they began to smoke cigarettes during adolescence. The economic costs associated with tobacco use ranges from $53 billion to $73 billion per year in medical expenses and $47 billion in lost productivity. Because of these health and economic consequences, CDC has recommended that states establish and maintain comprehensive tobacco-control programs to reduce tobacco use among youth. Reporting Period: January 2000 through December 2000. Description of the System: To assist states in developing and maintaining their state-based comprehensive tobacco prevention and control programs, CDC developed the Youth Tobacco Surveillance and Evaluation System, which includes international, national, and state school-based surveys of middle school and high school students. Two components of this system are discussed in this report --- the National Youth Tobacco Survey and the state Youth Tobacco Surveys. The national survey is representative of students in the 50 states and the District of Columbia; 35,828 students in 324 schools completed questionnaires in the spring of 2000. Twenty-nine state surveys were conducted in the spring and fall of 2000; state sample sizes ranged from 583 to 33,586 students. This report summarizes data from the 2000 national survey and state surveys. Results and Interpretation: Findings from the National Youth Tobacco Survey indicate that current tobacco use ranges from 15.1% among middle school students to 34.5% among high school students. Cigarette smoking is the most prevalent form of tobacco use, followed by cigar smoking and smokeless tobacco use. Approximately one half of current cigarette smokers in middle school and high school report that they usually smoke Marlboro® cigarettes. Black students are more likely to smoke Newport® cigarettes than any other brand. More than one half of current cigarette smokers in middle school and high school report that they want to stop smoking. Nearly one fourth of middle school and high school students who have never smoked cigarettes are susceptible to initiating cigarette smoking in the next year. Exposure to secondhand smoke (e.g., environmental tobacco smoke) is substantially higher among both middle school and high school students. During the week before the survey, approximately 9 out of 10 current cigarette smokers and one half of never cigarette smokers were in the same room with someone who was smoking cigarettes; and 8 out of 10 current cigarette smokers and 3 out of 10 never cigarette smokers rode in a car with someone who was smoking cigarettes. Approximately 70% of middle school and 57% of high school students who currently smoke cigarettes live in a home where someone smokes cigarettes. Among never cigarette smokers, approximately 3 out of 10 live in a home where someone smokes cigarettes. Approximately 69% of middle school and 58% of high school students aged <18 years who currently smoke cigarettes were not asked to show proof of age when they bought or tried to buy cigarettes. Approximately 8 out of 10 middle school and high school students have seen antismoking commercials. Eight out of 10 middle school students report having seen actors using tobacco on television or in the movies, and approximately 11% of middle school and 16% of high school students who had never used tobacco would wear or use something with a tobacco company name or picture on it. This rate increases to nearly 60% for current tobacco users. Public Health Actions: Youth Tobacco Survey data are used by health and education officials to improve national and state programs to prevent and control youth tobacco use. Several states use the data in presentations to their state legislators to demonstrate the need for funding smoking cessation and prevention programs for youth. INTRODUCTIONTobacco use is the single leading preventable cause of death in the United States (1), accounting for approximately 430,000 deaths each year (2). The prevalence of cigarette smoking nationwide among high school students increased during the 1990s (3), peaking during 1996--1997, then began a gradual decline (4). Approximately 80% of tobacco users initiate use before age 18 years (5). If this trend in early initiation of cigarette smoking continues, approximately 5 million children aged <18 years who are living today will die prematurely as adults because they began to smoke cigarettes during adolescence (2). The economic costs associated with tobacco use ranges from $50 billion to $73 billion per year in medical expenses (6,7) and $47 billion in lost productivity (8). CDC recommends that states establish and maintain comprehensive tobacco-control programs to reduce tobacco use among youth (9). Surveillance and evaluation are among primary components of a comprehensive tobacco-control program. To assist states in developing and maintaining their state-based comprehensive tobacco prevention and control programs, CDC developed the Youth Tobacco Surveillance and Evaluation System, which includes international, national, and state school-based surveys of middle school and high school students. Data in this report are presented from two components of this system: the National Youth Tobacco Survey (NYTS) and the state Youth Tobacco Surveys (YTS). The NYTS and the YTS were developed to provide states with the data necessary to support the design, implementation, and evaluation of a comprehensive tobacco- control program. Several states have data regarding the prevalence of selected tobacco use behaviors among high schools students from the Youth Risk Behavior Surveillance System (YRBSS). The YTS supplements the YRBSS by providing more comprehensive data regarding tobacco use (bidis*, cigarettes, cigars, kreteks*, pipes, and smokeless tobacco); exposure to secondhand smoke; smoking cessation; school curriculum; minors' ability to purchase or obtain tobacco products; knowledge and attitudes about tobacco and familiarity with protobacco and antitobacco media messages; and by providing information regarding both middle school and high school students. The YTS and YRBSS use identical sampling methodologies and the same wording for questions about tobacco use to enable states to use the high school data regarding tobacco use collected by both surveys. The NYTS was first conducted during fall 1999 then again during spring 2000 (10) and is representative of all students in the 50 states and the District of Columbia. Funding for the NYTS was provided by the American Legacy Foundation (Washington, DC), and the survey was conducted by the CDC Foundation (Atlanta, Georgia). The NYTS will be conducted every other year. State Youth Tobacco Surveys were first conducted in 1998, when three states participated; in 1999, when 13 states participated; and in 2000, when 29 states participated. Some states conduct the YTS annually, whereas others conduct the survey every other year. This report summarizes data from the 2000 NYTS and 2000 state surveys. METHODSSamplingNational Youth Tobacco Survey The 2000 NYTS employed a three-stage cluster sample design to produce a nationally representative sample of public and private school students in grades 6--12. The first-stage sampling frame contained 1,307 primary sampling units (PSUs) consisting of large counties or groups of smaller, adjacent counties. Of these, 148 PSUs were selected from eight strata formed on the basis of the degree of urbanization and the relative percentage of Asian, black, and Hispanic students in the PSU. The PSUs were selected with a probability proportional to weighted school enrollment. At the second sampling stage, 360 schools from the 148 PSUs were selected with a probability proportional to weighted school enrollment. Schools with substantial numbers of Asian, black, and Hispanic students were sampled at higher rates than all other schools through the use of a weighted measure of size. The third stage of sampling consisted of randomly selecting approximately five intact classes of a required subject (e.g., English or social studies) across grades 6--12 at each participating school. All students in the selected classes were eligible to participate in the survey. A weighting factor was applied to each student record to adjust for nonresponse and for the varying probabilities of selection, including those resulting from the oversampling of Asian, black, and Hispanic students. The number of students in other racial and ethnic groups were too low for meaningful analysis in this report.** The weights were scaled so that a) the weighted count of students was equal to the total sample size, and b) the weighted proportions of students in each grade matched national population proportions. SUDAAN (11) was used to compute 95% confidence intervals, which were used to determine the differences between subgroups at the p<0.05 level. Differences between prevalence estimates were considered statistically significant if the 95% confidence intervals did not overlap. Only subgroup comparisons that were statistically significant are mentioned in this report. The NYTS is representative of students in grades 6--12 in public and private schools in all 50 states and the District of Columbia. For the NYTS, 35,828 questionnaires were completed in 324 schools. The school response rate was 90.0%, and the student response rate was 93.4%, resulting in an overall response rate of 84.1%. State Youth Tobacco Surveys The state YTS employed a two-stage cluster sample design to produce representative samples of students in middle schools (grades 6--8) and high schools (grades 9--12). The first-stage sampling frame included separate lists for middle schools and high schools. In all except four states, private schools were excluded, and the list consisted of all public schools containing the appropriate grades (e.g., either 6--8 or 9--12). Schools were selected with a probability proportional to the school enrollment size. At the second sampling stage, classes were randomly selected from the list of classes obtained from each participating school. All students in the selected classes were eligible to participate in the survey. In 2000, the sample sizes for the YTS ranged from 583 to 33,586. School response rates ranged from 56.8% to 100.0%; student response rates ranged from 54.1% to 96.4%; and overall response rates ranged from 45.8% to 91.8%. All except four state surveys had overall response rates of at least 60%; these data were weighted and are considered representative of the respective population (Table 1). Data for Hawaii middle schools and Arizona, Maine, and Vermont high schools were not representative (overall response rates <60%) and therefore are not included in this report. Data Collection The survey was administered during one class period. Procedures were designed to protect students' privacy by assuring that student participation was anonymous and voluntary. Students completed a self-administered questionnaire in the classroom, recording their responses on an answer sheet. The core questionnaire contained 63 questions; to meet their individual needs, some states added questions. Before the survey was administered, local parental permission was obtained and institutional review board criteria were followed. The core questionnaire included questions about tobacco use (bidis, cigarettes, cigars, kreteks, pipes, and smokeless tobacco), exposure to secondhand smoke, smoking cessation, school curriculum, minors' ability to purchase or obtain tobacco products, knowledge and attitudes about tobacco, and familiarity with protobacco and antitobacco media messages. RESULTS***Prevalence of UseLifetime Tobacco Use**** Middle school and high school students were asked about their lifetime use of cigarettes, cigars, smokeless tobacco, pipes, bidis, or kreteks. Cigarettes were the most prevalent form of tobacco used, followed by cigars and smokeless tobacco. Middle School. Nationally, 36.3% of students had ever smoked cigarettes (Figure 1). White (33.8%), black (44.0%), and Hispanic (40.0%) students were significantly more likely than Asian students (20.8%) to have ever smoked cigarettes (Table 2). Black students were significantly more likely than white students to have ever smoked cigarettes. Cigars were the second most prevalent form of tobacco used (19.3%), with male students (24.7%) significantly more likely than female students (14.1%) to have ever smoked cigars. White (18.5%), black (21.8%), and Hispanic (22.5%) students were significantly more likely than Asian students (9.2%) to have ever smoked cigars. Smokeless tobacco was the third most prevalent form of tobacco used by students (9.5%), with male students (14.8%) significantly more likely than female students (4.2%) to have used smokeless tobacco. White students (10.7%) were significantly more likely than black (6.1%) or Asian (4.1%) students to have ever used smokeless tobacco. Hispanic (7.5%) students were significantly more likely than Asian students to have ever used smokeless tobacco. Tobacco in a pipe was the fourth most prevalent form of tobacco used by students (6.7%), with male students (9.2%) significantly more likely than female students (4.3%) to have smoked tobacco in a pipe. White students (6.5%) were significantly more likely than black students (4.4%) to have ever smoked tobacco in a pipe. Hispanic students (9.7%) were significantly more likely than white, black, or Asian (4.7%) students to have ever smoked tobacco in a pipe. Bidis were the fifth most prevalent form of tobacco used, with 4.4% of students having reported that they had ever smoked these cigarettes. Male students (5.9%) were significantly more likely than female students (3.0%) to have ever smoked bidis. Black (5.7%) and Hispanic (6.4%) students were significantly more likely than white students (3.5%) to have ever smoked bidis. Kreteks were the sixth most prevalent form of tobacco used, with 3.6% of students having reported that they had ever smoked these cigarettes. Male students (4.6%) were significantly more likely than female students (2.6%) to have ever smoked kreteks. Twenty-six states asked students if they had ever smoked cigarettes, cigars, or used smokeless tobacco. Among these 26 states, the percentage of students who had ever smoked cigarettes ranged from 26.3% in Maryland to 53.4% in Mississippi (public schools) (median: 38.3%) (Table 3). The percentage of students who had ever smoked cigars ranged from 14.3% in New York to 31.8% in Mississippi (public schools) (median: 20.6%). The percentage of students who had ever used smokeless tobacco ranged from 3.8% in New York to 24.7% in Wyoming (median: 10.8%). Among the 24 states that asked students if they had ever smoked bidis, the percentage of students who answered "yes" to this question ranged from 4.1% in Maine to 10.1% in Arizona (median: 6.2%). Among the 22 states that asked students if they had ever smoked kreteks, the percentage of students who answered "yes" to this question ranged from 2.3% in Minnesota to 5.1% in Arizona, Tennessee, and Wyoming (median: 3.9%). High School. Nationally, 64.0% of students had ever smoked cigarettes (Figure 1). White (64.3%), black (62.5%), and Hispanic (66.4%) students were significantly more likely than Asian students (52.4%) to have ever smoked cigarettes (Table 2). Cigars were the second most prevalent form of tobacco used (41.7%), with male students (52.2%) significantly more likely than female students (30.9%) to have ever smoked cigars. White students (44.1%) were significantly more likely than black (35.8%) or Asian (24.3%) students to have ever smoked cigars. Black and Hispanic (39.5%) students were significantly more likely than Asian students to have ever smoked cigars. Smokeless tobacco was the third most prevalent form of tobacco used by students (18.0%), with male students (29.0%) significantly more likely than female students (6.8%) to have ever used smokeless tobacco. White students (22.1%) were significantly more likely than black (7.6%), Hispanic (11.0%), or Asian (6.8%) students to have ever used smokeless tobacco. Hispanic students were significantly more likely than Asian students to have ever used smokeless tobacco. Bidis were the fourth most prevalent form of tobacco used (12.9%), with male students (15.7%) significantly more likely than female students (9.9%) to have ever smoked these cigarettes. Black (15.7%) and Hispanic (15.2%) students were significantly more likely than white (11.6%) or Asian (10.1%) students to have ever smoked bidis. Kreteks were the fifth most prevalent form of tobacco used by students (12.1%), with male students (14.0%) significantly more likely than female students (10.2%) to have ever smoked these cigarettes. White students (14.4%) were significantly more likely than black (4.2%), Hispanic (9.6%), or Asian (7.5%) students to have ever smoked kreteks. Hispanic students were significantly more likely than black students to have ever smoked these cigarettes. Tobacco in a pipe was the sixth most prevalent form of tobacco used, with 11.0% of students having reported that they had ever used this form of tobacco. Male students (16.7%) were significantly more likely than female students (5.0%) to have ever smoked tobacco in a pipe. White (12.3%) and Hispanic (10.3%) students were significantly more likely than black (5.3%) or Asian students (6.3%) to have ever smoked tobacco in a pipe. Twenty-four states asked students if they had ever smoked cigarettes, cigars, used smokeless tobacco, or smoked bidis. Among these 24 states, the percentage of students who had ever smoked cigarettes ranged from 56.9% in Florida to 74.3% in Kentucky and West Virginia (median: 64.7%) (Table 3). The percentage of students who had ever smoked cigars ranged from 24.0% in the District of Columbia to 54.4% in Kentucky (median: 45.1%). The percentage of students who had ever used smokeless tobacco ranged from 9.9% in the District of Columbia to 38.0% in Mississippi (private schools) (median: 24.7%). The percentage of students who had ever smoked bidis ranged from 7.0% in Nebraska to 24.0% in Delaware (median: 10.5%). Among the 20 states that asked students if they had ever smoked kreteks, the percentage of students who answered "yes" to this question ranged from 3.6% in Kentucky to 13.7% in Colorado (median: 7.0%). Current Tobacco Use Students were asked if they had used cigarettes, cigars, smokeless tobacco, tobacco in pipes, bidis, or kreteks on >1 of the 30 days preceding the survey. Current use of any tobacco product is defined as use of cigarettes or cigars or smokeless tobacco or tobacco in a pipe or bidis or kreteks on >1 of the 30 days preceding the survey. Middle School. Nationally, 15.1% of students were current users of any tobacco product (Figure 2), with male students (17.6%) significantly more likely than female students (12.7%) to be current users of any tobacco product (Table 4). White (14.3%), black (17.5%), and Hispanic (16.0%) students were significantly more likely than Asian (7.5%) students to currently use any tobacco product. Among current users, cigarettes were the most prevalent form of tobacco used (11.0%), with white (10.8%), black (11.2%), and Hispanic (11.4%) students significantly more likely than Asian (5.3%) students to currently smoke cigarettes. Cigars were the second most prevalent form of tobacco used (7.1%), with male students (9.7%) significantly more likely than female students (4.6%) to currently smoke cigars. Black (9.8%) and Hispanic (8.8%) students were significantly more likely than white (6.1%) or Asian (4.1%) students to currently smoke cigars. Smokeless tobacco was the third most prevalent form of tobacco used (3.6%), with male students (5.7%) significantly more likely than female students (1.5%) to currently use smokeless tobacco. Tobacco in a pipe was the fourth most prevalent form of tobacco used (3.0%), with male students (4.3%) significantly more likely than female students (1.8%) to currently smoke tobacco in a pipe. Bidis were the fifth most prevalent form of tobacco used, with 2.4% of students reporting that they currently were smoking these cigarettes. Male students (3.4%) were significantly more likely than female students (1.4%) to currently smoke bidis, and Hispanic students (3.6%) were significantly more likely than white students (1.9%) to currently smoke bidis. Kreteks were the sixth most prevalent form of tobacco used, with 2.1% of students reporting that they currently smoke these cigarettes. Male students (2.7%) were significantly more likely than female students (1.5%) to currently smoke kreteks. Twenty-six states asked students if they were current users of any tobacco product. Among these 26 states, the percentage of students who were current users of any form of tobacco ranged from 10.0% in California to 28.3% in Kentucky (median: 16.1%) (Table 5). The percentage of students who currently smoke cigarettes ranged from 6.7% in California to 21.5% in Kentucky (median: 12.0%). The percentage of students who currently smoke cigars ranged from 3.7% in Minnesota to 12.4% in Alabama (median: 6.1%). Current users of smokeless tobacco ranged from 1.5% in New York to 10.1% in Mississippi (private schools) (median: 3.6%). Twenty-three states asked students if they currently smoke tobacco in a pipe or bidis. Among these 23 states, the percentage of students who reported they currently smoke tobacco in a pipe ranged from 1.7% in Kansas to 4.8% in Tennessee (median: 3.4%). The percentage of students who reported they currently smoke bidis ranged from 2.2% in New York to 5.0% in the District of Columbia and West Virginia (median: 3.5%). High School. Nationally, 34.5% of students were current users of any tobacco product (Figure 2), with white students (38.0%) significantly more likely than black (26.5%), Hispanic (28.4%), or Asian (22.9%) students to currently use any tobacco product (Table 4). Among current users, the most prevalent form of tobacco used were cigarettes (28.0%), with white students (31.8%) significantly more likely than black (16.8%), Hispanic (22.6%), or Asian (20.6%) students to currently smoke cigarettes. Hispanic students were significantly more likely than black students to currently smoke cigarettes. Cigars were the second most prevalent form of tobacco used (14.8%), with male students (22.0%) significantly more likely than female students (7.3%) to currently smoke cigars. White (15.1%), black (15.3%), and Hispanic (13.6%) students were significantly more likely than Asian students (7.4%) to currently smoke cigars. Smokeless tobacco was the third most prevalent form of tobacco used (6.6%), with male students (11.8%) significantly more likely than female students (1.4%) to currently use smokeless tobacco. White students (8.2%) were significantly more likely than black (2.6%), Hispanic (4.0%), or Asian (1.9%) students to currently use smokeless tobacco. Kreteks were the fourth most prevalent form of tobacco used (4.2%), with male students (5.3%) significantly more likely than female students (3.0%) to currently smoke these cigarettes. White (4.5%) and Hispanic (4.0%) students were significantly more likely than black students (2.2%) to currently smoke kreteks. Bidis were the fifth most prevalent form of tobacco used (4.1%), with male students (5.4%) significantly more likely than female students (2.8%) to currently smoke these cigarettes. Hispanic students (5.7%) were significantly more likely than white (3.6%) or Asian (3.0%) students to currently smoke bidis. Tobacco in a pipe was the sixth most prevalent form of tobacco used (3.3%). Male students (5.2%) were significantly more likely than female students (1.4%) to report that they currently smoke tobacco in a pipe, and Hispanic students (4.2%) were significantly more likely than black students (2.2%) to currently smoke tobacco in a pipe. Twenty-six states asked students if they were current users of any tobacco product. Among these 26 states, the percentage of students who were current users of any form of tobacco ranged from 21.0% in the District of Columbia to 50.4% in Mississippi (private schools) (median: 36.9%) (Table 5). The percentage of students who currently smoke cigarettes ranged from 14.7% in the District of Columbia to 41.7% in Mississippi (private schools) (median: 29.2%). The percentage of students who currently smoke cigars ranged from 4.9% in Hawaii to 20.0% in Arkansas (median: 15.1%). Current users of smokeless tobacco ranged from 3.3% in California and the District of Columbia to 19.3% in Mississippi (private schools) (median: 9.1%). Twenty-five states asked students if they currently smoke tobacco in a pipe or bidis. Among these states, the percentage of students who reported that they currently smoke tobacco in a pipe ranged from 2.4% in Delaware to 5.6% in Mississippi (private schools) (median: 4.2%). The percentage of students who reported that they currently smoke bidis ranged from 3.4% in Alabama and Kansas to 8.5% in West Virginia (median: 5.2%). Ever Daily Cigarette Use***** Middle School. Nationally, 5.5% of students had ever smoked cigarettes daily (Figure 3). White students (6.0%) were significantly more likely than black (3.7%) or Asian (2.9%) students to have ever smoked cigarettes daily (Table 6). Among the 26 states that asked this question, the percentage of students who had ever smoked cigarettes daily ranged from 2.7% in the District of Columbia to 14.0% in Kentucky (median: 7.5%) (Table 7). High School. Nationally, 20.6% of students had ever smoked cigarettes daily (Figure 3). White students (23.8%) were significantly more likely than black (11.7%), Hispanic (14.1%), or Asian (15.3%) students to have ever smoked cigarettes daily (Table 6). Among the 24 states that asked this question, the percentage of students who had ever smoked cigarettes daily ranged from 8.7% in the District of Columbia to 33.4% in West Virginia (median: 22.3%) (Table 7). Number of Cigarettes Smoked Per Day Among Current Smokers Middle School. Nationally, 16.1% of current cigarette smokers had smoked >6 cigarettes per day on the days they smoked (Figure 3). White smokers (18.6%) were significantly more likely than Hispanic smokers (11.3%) to smoke >6 cigarettes per day on the days they smoked (Table 6). Among the 26 states that asked this question, the percentage who smoked >6 cigarettes per day on the days they smoked ranged from 11.1% in Texas to 27.9% in West Virginia (median: 14.8%) (Table 7). High School. Nationally, 31.7% of current cigarette smokers had smoked >6 cigarettes per day on the days they smoked (Figure 3). White students (34.4%) were significantly more likely than black (22.6%) or Hispanic (19.0%) students to smoke >6 cigarettes per day on the days they smoked (Table 6). Among the 24 states that asked this question, the percentage of current smokers who smoked >6 cigarettes per day on the days they smoked ranged from 18.5% in the District of Columbia to 42.0% in West Virginia (median: 30.6%) (Table 7). Age of Initiation of Tobacco Use****** Cigarettes Middle School. Nationally, 8.4% of students first smoked a cigarette before age 11 years (Figure 4), with male students (10.0%) significantly more likely than female students (6.8%) to have first smoked a cigarette before age 11 years (Table 8). Among the 25 states that asked this question, the percentage of students who initiated cigarette smoking before age 11 years ranged from 5.7% in New York to 19.1% in Kentucky (median: 10.7%) (Table 9). High School. Nationally, 6.7% of students first smoked a cigarette before the age of 11 years (Figure 4), with male students (8.3%) significantly more likely than female students (5.1%) to have first smoked a cigarette before age 11 years (Table 8). Among the 23 states that asked this question, the percentage who started smoking cigarettes before age 11 years ranged from 5.8% in the District of Columbia to 14.4% in West Virginia (median: 14.3%) (Table 9). Cigars Middle School. Nationally, 5.2% of students smoked a cigar before age 11 years (Figure 4), with male students (6.9%) significantly more likely than female students (3.5%) to have first smoked a cigar before age 11 years (Table 8). Among the 25 states that asked this question, the percentage of students who first smoked a cigar before the age of 11 years ranged from 3.0% in Delaware to 9.3% in Wyoming (median: 5.9%) (Table 9). High School. Nationally, 3.1% of students first smoked a cigar before the age of 11 years (Figure 4), with male students (4.5%) significantly more likely than female students (1.7%) to report initiating cigar smoking before the age of 11 years (Table 8). White students (3.1%) were significantly more likely than Asian students (1.6%) to have initiated cigar smoking before the age of 11 years. Hispanic students (4.0%) were significantly more likely than black (2.1%) or Asian students to have initiated cigar smoking before the age of 11 years. Among the 23 states that asked this question, the percentage of students who first smoked a cigar before age 11 years ranged from 2.6% in Delaware to 6.9% in West Virginia (median: 4.6%) (Table 9). Smokeless Tobacco Middle School. Nationally, 3.7% of students reported that they first used smokeless tobacco before age 11 years (Figure 4), with male students (6.0%) significantly more likely than female students (1.6%) to have first used smokeless tobacco before age 11 years (Table 8). White students (4.2%) were significantly more likely than Asian students (1.5%) to have first used smokeless tobacco before age 11 years. Among the 25 states that asked this question, the percentage of students who initiated the use of smokeless tobacco before age 11 years ranged from 1.6% in the District of Columbia to 11.1% in Kentucky (median: 4.2%) (Table 9). High School. Nationally, 2.9% of students reported first using smokeless tobacco before the age of 11 years (Figure 4), with male students (4.7%) significantly more likely than female students (1.0%) to report using smokeless tobacco before the age of 11 years (Table 8). White students (3.3%) were significantly more likely than black (1.8%), Hispanic (1.7%), or Asian (1.0%) students to have first used smokeless tobacco before the age of 11 years. Among the 23 states that asked this question, the percentage ranged from 2.0% in California and Connecticut to 10.9% in Mississippi (private schools) (median: 4.5%) (Table 9). Established Use of Tobacco Products Smoked >100 Cigarettes in Lifetime Middle School. Nationally, 4.1% of ever cigarette smokers had smoked >100 cigarettes during their lifetime (Figure 5), with male students (5.0%) significantly more likely than female students (3.2%) to have smoked >100 cigarettes during their lifetime. White students (4.8%) were significantly more likely than black (2.2%), Hispanic (2.7%), or Asian (2.4%) students to have smoked >100 cigarettes during their lifetime (Table 10). Among the 24 states that asked this question, the percentage of ever cigarette smokers who smoked >100 cigarettes in their lifetime ranged from 3.5% in the District of Columbia to 21.6% in Maine (median: 13.5%) (Table 11). High School. Nationally, 20.7% of ever cigarette smokers had smoked >100 cigarettes in their lifetime (Figure 5). White students (24.9%) were significantly more likely than black (8.6%), Hispanic (13.4%), or Asian (14.9%) students to have smoked >100 cigarettes in their lifetime (Table 10). Hispanic and Asian students were significantly more likely than black students to have smoked >100 cigarettes in their lifetime. Among the 22 states that asked this question, the percentage of ever cigarette smokers ranged from 8.4% in the District of Columbia to 45.6% in Mississippi (private schools) (median: 34.5%) (Table 11). Frequent Use******* of Tobacco Middle School. Nationally, 2.7% of students had frequently smoked cigarettes (Figure 5). White students (3.1%) were significantly more likely than Hispanic students (1.5%) to be frequent cigarette smokers (Table 10). Students who were frequent users of cigars, smokeless tobacco, pipes, bidis, and kreteks accounted for <1% of students. Among the 26 states that asked this question, the percentage of students who were frequent cigarette smokers ranged from 0.8% in the District of Columbia to 7.4% in West Virginia (median: 3.5%) (Table 11). The percentage of students who were frequent cigar smokers ranged from 0.2% in Colorado, Minnesota, Vermont, and Wisconsin to 1.7% in Maine (median: 0.9%), though some confidence intervals overlapped. The percentage of students who frequently used smokeless tobacco ranged from 0.4% in Connecticut and the District of Columbia to 3.1% in Kentucky (median: 0.8%). The percentage of students who smoked tobacco in a pipe ranged from 0.2% in Kansas, Kentucky, Minnesota, and Wisconsin to 1.2% in Maine and Texas (median: 0.6%), though some confidence intervals overlapped. The percentage of students who frequently smoked bidis ranged from 0.1% in Vermont to 1.6% in Maine (median: 0.5%). High School. Nationally, 13.6% of students had frequently smoked cigarettes (Figure 5). White students (16.4%) were significantly more likely than black (6.1%), Hispanic (7.4%), or Asian (9.9%) students to have frequently smoked cigarettes (Table 10). Students who were frequent users of cigars, smokeless tobacco, pipes, bidis, and kreteks, accounted for <2% of students. Among the 24 states that asked this question, the percentage of students who were frequent cigarette smokers ranged from 3.5% in the District of Columbia to 22.1% in West Virginia (median: 14.2%) (Table 11). The percentage of students who were frequent cigar smokers ranged from 0.5% in Connecticut to 2.1% in Mississippi (public schools) (median: 1.4%). The percentage of students who frequently used smokeless tobacco ranged from 0.5% in Connecticut to 8.0% in Mississippi (private schools) (median: 2.8%). The percentage of students who frequently smoked tobacco in a pipe ranged from 0.3% in South Dakota to 1.6% in New York (median: 0.8%), though their confidence intervals overlapped. The percentage of students who frequently smoked bidis ranged from 0.3% in the District of Columbia to 1.3% in Maryland, Mississippi (private schools), and New York (median: 0.7%), though some confidence intervals overlapped. Brand of Cigarettes Usually Smoked Current cigarette smokers were asked to identify the brand of cigarettes they usually smoked. Brand preferences were similar among current smokers in middle and high schools. Middle School. Nationally, 47.1% of current cigarette smokers in middle school identified Marlboro® as the brand they usually smoked, followed by Newport ® (22.4%), other brands (12.3%), and Camel® (6.3%) (Figure 6). Marlboro® was the brand most often smoked by white (55.6%), Hispanic (53.9%), and Asian (37.3%) students, whereas Newport® was the brand most often smoked by black students (64.1%) (Table 12). Among the 25 states that asked this question, the percentage of current cigarette smokers who most often smoked Marlboro® ranged from 9.2% in the District of Columbia to 66.5% in Mississippi (private schools) (median: 54.6%) (Table 13). The percentage of current cigarette smokers who preferred Newport® ranged from 3.7% in Wyoming to 65.9% in the District of Columbia (median: 10.7%). High School. Nationally, 53.3% of current cigarette smokers in high school identified Marlboro® as the brand they usually smoked, followed by Newport® (20.8%) and Camel® (11.0%) (Figure 6). Marlboro® was the brand most often smoked by white (59.4%), Hispanic (49.1%), and Asian (54.2%) students, whereas Newport® was the favored brand among black students (74.0%) (Table 12). Among the 25 states that asked this question, the percentage of current cigarette smokers who preferred Marlboro® ranged from 5.8% in the District of Columbia to 75.7% in Mississippi (private schools) (median: 58.3%) (Table 13). The percentage of current cigarette smokers who preferred Newport® ranged from 5.4% in Hawaii to 76.3% in the District of Columbia (median: 13.2%). Smoking Susceptibility******** Susceptibility Among Never Cigarette Smokers Never cigarette smokers were classified as not susceptible to smoking cigarettes if they responded that a) they would not smoke a cigarette soon; and b) they would definitely not smoke a cigarette in the next year; and c) they would definitely not smoke if their closest friend offered them a cigarette. All other students were classified as susceptible to initiating cigarette smoking in the next year. Middle School. Nationally, 24.3% of students who had never smoked cigarettes were classified as susceptible to initiating cigarette smoking in the next year (Table 14). Hispanic students (28.0%) were significantly more likely than white students (23.2%) to be susceptible to initiating cigarette smoking in the next year. Among the 26 states that asked this series of questions, the percentage of never cigarette smokers who were susceptible to initiating cigarette smoking ranged from 19.9% in Indiana to 31.8% in Wisconsin (median: 25.8%) (Table 15). High School. Nationally, 22.5% of students who had never smoked cigarettes were classified as susceptible to initiating cigarette smoking in the next year (Table 14). Among the 24 states that asked this series of questions, the percentage of never cigarette smokers who were susceptible to initiating cigarette smoking ranged from 17.3% in Alabama to 33.5% in Mississippi (private schools) (median: 23.5%) (Table 15). Knowledge and AttitudesPeer Group Use of Tobacco One or More Closest Friends Smoke Cigarettes Middle School. Nationally, current cigarette smokers (90.3%) were significantly more likely than students who had never smoked cigarettes (17.0%) to report that >1 of their closest friends smoked cigarettes (Figure 7). White (16.3%), black (19.7%), and Hispanic (19.0%) students who had never smoked cigarettes were significantly more likely than Asian students (9.5%) who had never smoked cigarettes to report that >1 of their closest friends smoked cigarettes (Table 16). Among the 26 states that asked never cigarette smokers if >1 of their closest friends smoked cigarettes, the percentage of students who answered "yes" ranged from 10.7% in Minnesota to 22.2% in Mississippi (public schools) (median: 15.1%). Among the 26 states that asked current cigarette smokers if >1 of their closest friends smoked cigarettes, the percentage of students who answered "yes" ranged from 71.7% in Indiana to 95.3% in Delaware (median: 86.9%) (Table 17). High School. Nationally, current cigarette smokers (92.3%) were significantly more likely than students who had never smoked cigarettes (33.0%) to report that >1 of their closest friends smoked cigarettes (Figure 7). Hispanic (34.6%) students who never smoked cigarettes were significantly more likely than Asian (25.6%) students to report that >1 of their closest friends smoked cigarettes (Table 16). White (93.5%), Hispanic (90.4%), and Asian (95.0%) students who currently smoke cigarettes were significantly more likely than black current cigarette smokers (82.8%) to report that >1 of their closest friends smoked cigarettes. Among the 24 states that asked never cigarette smokers if >1 of their closest friends smoked cigarettes, the percentage of students who answered "yes" ranged from 22.3% in Mississippi (public schools) to 37.2% in Arkansas and Delaware (median: 29.6%). Among the 24 states that asked current cigarette smokers if >1 of their closest friends smoked cigarettes, the percentage of students who answered "yes" ranged from 67.3% in the District of Columbia to 96.4% in Delaware (median: 91.4%) (Table 17). One or More Closest Friends Use Smokeless Tobacco Middle School. Nationally, current users of smokeless tobacco (78.0%) were significantly more likely than students who had never used this product (7.3%) to report that >1 of their closest friends used smokeless tobacco (Figure 7). Among current users, white students (83.5%) were significantly more likely than black students (54.3%) to report that at least one of their closest friends used smokeless tobacco (Table 16). Among the 26 states that asked this question, the percentage of never smokeless tobacco users who reported that >1 of their closest friends used smokeless tobacco ranged from 4.3% in Kansas to 25.9% in West Virginia (median: 15.1%). The percentage of current smokeless tobacco users who reported that >1 of their closest friends used smokeless tobacco ranged from 52.1% in Indiana to 94.3% in New York (median: 74.0%) (Table 17). High School. Nationally, current users of smokeless tobacco (80.7%) were significantly more likely than students who had never used this product (13.1%) to report that >1 of their closest friends used smokeless tobacco (Figure 7). Among never smokeless tobacco users, white students (16.4%) were significantly more likely than black (5.5%), Hispanic (9.4%), or Asian (6.3%) students to report that >1 of their closest friends used smokeless tobacco, and Hispanic students were significantly more likely than black and Asian students to report that >1 of their closest friends used smokeless tobacco. Among current smokeless tobacco users, male students (82.2%) were significantly more likely than female students (67.6%) to report that >1 of their closest friends used smokeless tobacco, and white students (83.0%) were significantly more likely than black (65.0%) and Hispanic (71.7%) students to report that >1 of their closest friends used smokeless tobacco. Among the 24 states that asked this question, the percentage of never smokeless tobacco users who reported that >1 of their closest friends used smokeless tobacco ranged from 3.8% in the District of Columbia to 41.0% in Mississippi (private schools) (median: 18.9%). The percentage of current users who reported that >1 of their closest friends used smokeless tobacco ranged from 50.2% in the District of Columbia to 90.9% in Mississippi (private schools) (median: 81.5%%) (Table 17). Social Perceptions About Cigarette Use Think Smokers Have More Friends Middle School. Nationally, current cigarette smokers (37.9%) were significantly more likely than students who had never smoked cigarettes (11.9%) to think that cigarette smokers have more friends (Figure 8). Among never cigarette smokers, black students (21.5%) were significantly more likely than white (9.2%) or Hispanic (14.3%) students to think that cigarette smokers have more friends, and Hispanic and Asian (15.6%) students were significantly more likely than white students to think that cigarette smokers have more friends (Table 18). Among current cigarette smokers, male students (42.6%) were significantly more likely than female students (32.7%) and black students (45.6%) were significantly more likely than white students (34.5%) to think that cigarette smokers have more friends. Among the 26 states that asked this question, the percentage of never cigarette smokers who thought that cigarette smokers had more friends ranged from 6.2% in Kansas to 26.8% in the District of Columbia (median: 10.5%). The percentage of current cigarette smokers who thought that cigarette smokers had more friends ranged from 31.9% in Florida to 53.0% in Indiana (median: 40.7%) (Table 19). High School. Nationally, current cigarette smokers (24.0%) were significantly more likely than students who had never smoked cigarettes (12.6%) to think cigarette smokers have more friends (Figure 8). Among never cigarette smokers, male students (15.4%) were significantly more likely than female students (9.9%) to think that cigarette smokers have more friends (Table 18). Black (21.0%), Hispanic (19.5%), and Asian (20.1%) students were significantly more likely than white students (9.0%) to think that cigarette smokers have more friends. Among current cigarette smokers, male students (29.1%) were significantly more likely than female students (18.5%) to think that cigarette smokers have more friends, and black (37.6%), Hispanic (30.7%), and Asian (39.0%) students were significantly more likely than white students (20.6%) to think that cigarette smokers have more friends. Among the 24 states that asked this question, the percentage of never cigarette smokers who thought that cigarette smokers had more friends ranged from 8.5% in Colorado, Nebraska, and South Dakota to 24.2% in the District of Columbia (median: 13.0%). The percentage of current cigarette smokers who thought that cigarette smokers had more friends ranged from 22.2% in Delaware to 49.4% in the District of Columbia (median: 27.6%) (Table 19). Access and EnforcementMethods of Obtaining Cigarettes How Current Cigarette Smokers Usually Got Cigarettes Middle School. Nationally, current cigarette smokers aged <18 years usually got their cigarettes by having someone else buy cigarettes for them (24.4%), borrowing them from someone (22.4%), or being given them by someone aged 18 years or older (12.3%) (Figure 9). Eleven percent of current cigarette smokers reported they usually took their cigarettes from a family member or store. White (26.6%) and Asian (23.3%) students were more likely to get their cigarettes by having someone else buy them for them, whereas black (20.3%) and Hispanic (24.7%) students were more likely to get them some other way (Table 20). Among the 25 states that asked this question, the percentage of current cigarette smokers who had someone else buy cigarettes for them ranged from 14.5% in the District of Columbia to 33.7% in Mississippi (private schools) (median: 23.0%). The percentage who borrowed cigarettes ranged from 19.8% in California to 38.1% in Ohio (median: 26.1%). The percentage who were given cigarettes by someone aged 18 years old or older ranged from 4.2% in Maine to 14.0% in Texas (median: 8.8%). The percentage who took their cigarettes from a family member or store ranged from 7.4% in Indiana to 19.0% in Minnesota (median: 12.0%) The percentage who got their cigarettes some other way ranged from 9.2% in Ohio to 31.2% in California (median: 19.0%) (Table 21). High School. Nationally, current cigarette smokers aged <18 years usually got their cigarettes by buying their cigarettes in a store (32.2%), having someone else buy cigarettes for them (25.1%), or borrowing them from someone (20.9%) (Figure 9). Only 2.9% of current cigarette smokers reported they took their cigarettes from a family member or store. Male current cigarette smokers were more likely to buy their cigarettes in a store (35.9%), whereas female current cigarette smokers were more likely to have someone else buy their cigarettes (29.3%) (Table 20). Among the 24 states that asked this question, the percentage of current cigarette smokers who usually purchased their cigarettes in a store ranged from 8.1% in South Dakota to 30.6% in Delaware (median: 20.4%). The percentage who had someone else buy cigarettes for them ranged from 8.4% in the District of Columbia to 45.0% in South Dakota (median: 32.3%). The percentage who usually borrowed cigarettes ranged from 19.9% in Arkansas to 33.5% in Colorado (median: 24.9%) (Table 21). Where Current Cigarette Smokers Bought Their Last Pack of Cigarettes Cigarettes Middle School. Nationally, 39.5% of current cigarette smokers aged <18 years bought their last pack of cigarettes at a gas station, followed by a convenience store (23.5%), a vending machine (12.6%), and a grocery store (10.4%) (Figure 10). This pattern held for all sex and race/ethnicity groups (Table 22). Among the 20 states that asked this question, the percentage of current cigarette smokers who purchased their last pack of cigarettes at a gas station ranged from 9.5% in Colorado to 34.2% in Maine (median: 20.8%). The percentage of current cigarette smokers who purchased their last pack of cigarettes at a convenience store ranged from 5.9% in Minnesota to 19.3% in the District of Columbia (median: 12.3%) (Table 23). High School. Nationally, 57.1% of current cigarette smokers aged <18 years bought their last pack of cigarettes at a gas station, followed by a convenience store (26.3%), a grocery store (7.7%), and a discount store (2.9%) (Figure 10). This pattern held for all sex and race/ethnicity groups (Table 22). Among the 20 states that asked this question, the percentage of current cigarette smokers who purchased their last pack of cigarettes at a gas station ranged from 14.3 in Hawaii to 66.8% in Wisconsin (median: 45.8%). The percentage of current cigarette smokers who purchased their last pack of cigarettes at a convenience store ranged from 13.6% in Indiana to 35.9% in the District of Columbia (median: 20.9%) (Table 23). Age and AccessAcquiring Cigarettes and Proof of Age Proof of Age Not Required to Purchase Cigarettes Middle School. Nationally, 69.4%********* of current cigarette smokers were not asked to show proof of age when purchasing cigarettes (Figure 11 and Table 24). Among the 25 states that asked this question, the percentage of current cigarette smokers who were not asked to show proof of age when purchasing cigarettes ranged from 56.7% in the District of Columbia to 90.5% in New Hampshire (median: 74.0%) (Table 25). High School. Nationally, 58.1%********** of current cigarette smokers were not asked to show proof of age when purchasing cigarettes (Figure 11). White (56.1%), black (64.9%), and Hispanic (67.5%) students were significantly more likely than Asian students (36.4%) to report that they were not asked to show proof of age when purchasing cigarettes (Table 24). Among the 24 states that asked this question, the percentage of current cigarette smokers who were not asked to show proof of age when purchasing cigarettes ranged from 46.9% in Mississippi (private schools) to 68.3% in Nebraska (median: 59.5%) (Table 25). Not Refused Purchase Because of Age Middle School. Nationally, 62.4%*********** of current cigarette smokers aged <18 years were not refused purchase of cigarettes because of their age regardless of whether or not they were asked for proof of age (Figure 11 and Table 24). Among the 23 states that asked this question, the percentage of current cigarette smokers aged <18 years who were not refused purchase ranged from 52.1% in California to 78.8% in Minnesota (median: 66.1%) (Table 25). High School. Nationally, 58.1%************ of current cigarette smokers aged <18 years were not refused purchase of cigarettes because of their age regardless of whether or not they were asked for proof of age (Figure 11). Female students (62.9%) were significantly more likely than male students (54.4%) to report that they were not refused purchase of cigarettes because of their age (Table 24). Among the 24 states that asked this question, the percentage of current cigarette smokers aged <18 years who were not refused purchase of cigarettes because of their age ranged from 49.7% in Connecticut to 70.6% in Nebraska (median: 60.3%) (Table 25). Media and AdvertisingExposure to Tobacco-Related Media and Advertising Saw Antismoking Commercials on Television or Heard Them on the Radio Middle School. Nationally, 81.5% of students saw antismoking commercials on television or heard antismoking commercials on the radio during the 30 days preceding the survey (Figure 12), with female students (84.0%) significantly more likely than male students (78.9%) to have seen antismoking commercials on television or heard antismoking commercials on the radio (Table 26) during this time frame. White students (83.4%) were significantly more likely than black (76.5%) or Hispanic (79.2%) students to have seen or heard such commercials during this time frame. Among the 23 states that asked this question, the percentage of students who saw antismoking commercials on television or heard antismoking commercials on the radio during the 30 days preceding the survey ranged from 72.2% in Maryland to 86.1% in Mississippi (private schools) (median: 78.9%) (Table 27). High School. Nationally, 84.2% of students saw antismoking commercials on television or heard antismoking commercials on the radio during the 30 days preceding the survey (Figure 12). White (86.1%) and Asian (87.5%) students were significantly more likely than black (78.2%) or Hispanic (81.5%) students to have seen or heard such commercials (Table 26) during this time frame. Among the 21 states that asked this question, the percentage of students who saw antismoking commercials on television or heard antismoking commercials on the radio during the 30 days preceding the survey ranged from 76.3% in Ohio to 87.3% in Mississippi (private schools) and Wisconsin (median: 84.6%) (Table 27). Saw Actors Smoking on Television or in Movies Middle School. Nationally, 83.3% of students had seen actors using tobacco on television or in the movies (Figure 12). White students (84.4%) were significantly more likely than black (81.0%) or Hispanic (81.5%) students to have seen actors smoking on television or in the movies (Table 26). Among the 19 states that asked this question, the percentage of students who had seen actors smoking on television or in the movies ranged from 79.3% in Connecticut to 89.7% in Kentucky and West Virginia (median: 84.1%) (Table 27). High School. Nationally, 88.0% of students had seen actors smoking on television or in the movies (Figure 12). Female students (89.7%) were significantly more likely than male students (86.4%) to have seen actors smoking on television or in the movies (Table 26). White students (89.2%) were significantly more likely than black (84.6%) or Hispanic (86.2%) students to have seen actors smoking on television or in the movies. Among the 19 states that asked this question, the percentage of students who had seen actors smoking on television or in the movies ranged from 86.1% in the District of Columbia to 92.1% in Iowa (median: 89.8%) (Table 27). Saw Advertisements for Tobacco Products on Internet Middle School. Nationally, 32.4% of students had seen advertisements for tobacco products on the Internet (Figure 12). Black students (35.0%) were significantly more likely than Asian students (28.6%) to have seen advertisements for tobacco products on the Internet (Table 26). Among the 22 states that asked this question, the percentage of students who had seen such advertisements on the Internet ranged from 27.4% in Connecticut to 40.8% in Alabama (median: 33.9%) (Table 27). High School. Nationally, 24.4% of students had seen advertisements for tobacco products on the Internet (Figure 12). Black (27.8%) and Hispanic (30.6%) students were significantly more likely than white students (22.5%) to have seen advertisements for tobacco products on the Internet (Table 26). Among the 22 states that asked this question, the percentage of students who had seen such advertisements on the Internet ranged from 20.0% in Connecticut to 34.9% in Mississippi (public schools) (median: 26.3%) (Table 27). Participation in Antitobacco Community Events Students were asked whether they had participated in any antitobacco community events to discourage persons from using tobacco products during the preceding 12 months. Middle School. Nationally, no difference in participation in antitobacco community events was observed between students who had never used tobacco (15.3%) and those who had ever used tobacco (15.8%) (Figure 13). Among students who had never used tobacco, black students (18.5%) were significantly more likely than Hispanic (13.3%) or Asian (12.2%) students to have participated in antitobacco community events (Table 28). Among the 26 states that asked this question, the percentage of never tobacco users who had participated in any antitobacco community events ranged from 8.9% in Maine to 40.2% in Arkansas (median: 26.4%). For students who had ever used tobacco, rates ranged from 11.9% in New York to 32.3% in the District of Columbia (median: 21.0%) (Table 29). High School. Nationally, no difference in participation in antitobacco community events was observed between students who had never used tobacco (10.8%) and those who had ever used tobacco (9.3%) (Figure 13). Among students who had never used tobacco, female students (12.6%) were significantly more likely than male students (8.8%) to have participated in antitobacco community events (Table 28). Among students who had ever used tobacco, black (13.2%), Hispanic (11.6%), and Asian (12.6%) students were significantly more likely than white students (7.6%) to have participated in antitobacco community events. Among the 24 states that asked this question, the percentage of never tobacco users who had participated in any antitobacco community events ranged from 9.0% in Texas to 33.7% in Arkansas (median: 19.0%). For students who had ever used tobacco, rates ranged from 8.9% in Indiana and Mississippi (private schools) to 25.7% in Hawaii (median: 14.5%) (Table 29). Receptivity to Tobacco Company Merchandise Bought or Received Anything with Tobacco Company Name or Picture on It Middle School. Nationally, current tobacco users (45.5%) were significantly more likely than students who had never used tobacco (11.4%) to have bought or received anything with a tobacco company name or picture on it (e.g., sports gear, T-shirt, cigarette lighter, hat, jacket, or sunglasses that they purchased or received for free) (Figure 14). Among current tobacco users, white (50.4%) and Hispanic (45.1%) students were significantly more likely than black students (29.0%) to have bought or received anything with a tobacco company name or picture on it (Table 30). Among the 26 states that asked this question, the percentage of never tobacco users who had bought or received anything with a tobacco company name or picture on it ranged from 8.4% in the District of Columbia to 20.5% in Maine (median: 12.9%). Among current tobacco users, rates ranged from 29.4% in the District of Columbia to 58.4% in West Virginia (median: 45.2%) (Table 31). High School. Nationally, current tobacco users (34.6%) were significantly more likely than students who had never used tobacco (11.1%) to have bought or received anything with a tobacco company name or picture on it (Figure 14). Hispanic students (13.0%) were significantly more likely than black students (8.8%) to have bought or received anything with a tobacco company name or picture on it. Among current tobacco users, male students (37.3%) were significantly more likely than female students (31.0%) to have bought or received anything with a tobacco company name or picture on it (Table 30). Among the 24 states that asked this question, the percentage of never tobacco users who had bought or received anything with a tobacco company name or picture on it ranged from 9.6% in Delaware to 17.9% in West Virginia (median: 12.3%). Among current tobacco users, rates ranged from 21.4% in the District of Columbia to 46.9% in Mississippi (private schools) (median: 38.3%) (Table 31). Would Wear or Use Something with Tobacco Company Name or Picture on It Middle School. Nationally, current tobacco users (57.3%) were significantly more likely than students who had never used tobacco (10.8%) to report they would wear or use anything with a tobacco company name or picture on it (e.g., cigarette lighter or T-shirt) (Figure 14). Among students who had never used tobacco, male students (15.3%) were significantly more likely than female students (7.0%) to report they would wear or use anything with a tobacco company name or picture on it (Table 30). Hispanic students (14.1%) were significantly more likely than white students (10.0%) to report they would wear or use anything with a tobacco company name or picture on it. Among current tobacco users, male students (61.7%) were significantly more likely than female students (51.3%) to report they would wear or use anything with a tobacco company name or picture on it. White (62.6%) and Hispanic (54.4%) students were significantly more likely than black students (41.4%) to report they would wear or use anything with a tobacco company name or picture on it. Among the 26 states that asked students if they would wear or use something with a tobacco company name or picture on it, the percentage of never tobacco users ranged from 8.1% in Colorado to 18.7% in Arkansas (median: 13.1%). Among current tobacco users, rates ranged from 36.5% in the District of Columbia to 71.1% in West Virginia (median: 58.7%) (Table 31). High School. Nationally, current tobacco users (58.9%) were significantly more likely than students who had never used tobacco (16.0%) to report that they would wear or use anything with a tobacco company name or picture on it (Figure 14). Among never tobacco users, male students (20.6%) were significantly more likely than female students (12.1%) to report that they would wear or use anything with a tobacco company name or picture on it. Hispanic students (19.0%) were significantly more likely than Asian students (12.7%) to report they would wear or use such items (Table 30). Among current tobacco users, male students (62.4%) were significantly more likely than female students (54.2%) to report that they would wear or use something with a tobacco company name or picture on it. White students (63.4%) were significantly more likely than black (40.3%), Hispanic (53.4%), or Asian (42.8%) students to report that they would wear or use such items. Hispanic students were significantly more likely than black students to report that they would wear or use such items. Among the 24 states that asked this question, the percentage of never tobacco users who would wear or use anything with a tobacco company name or picture on it ranged from 13.5% in Colorado to 24.7% in Mississippi (private schools) (median: 17.4%). Among current tobacco users, rates ranged from 39.5% in the District of Columbia to 70.3% in Wisconsin (median: 60.7%) (Table 31). CessationCessation Attempts and Desire to Stop Tried to Quit Smoking Cigarettes during 12 Months Preceding Survey Middle School. Nationally, 59.9% of current cigarette smokers had tried to quit smoking cigarettes during the 12 months preceding the survey (Figure 15). Female students (65.6%) were significantly more likely than male students (54.7%) to have tried to quit smoking cigarettes in the 12 months preceding the survey (Table 32). Among the 26 states that asked this question, the percentage of current cigarette smokers who had tried to quit smoking cigarettes in the 12 months preceding the survey ranged from 46.4% in Vermont to 63.7% in Maryland (median: 56.7%) (Table 33). High School. Nationally, 59.3% of current cigarette smokers had tried to quit smoking cigarettes during the 12 months preceding the survey (Figure 15), with female students (63.3%) significantly more likely than male students (55.2%) to have tried to quit smoking cigarettes during the 12 months preceding the survey (Table 32). White (78.1%), black (61.5%), and Asian (70.5%) students were significantly more likely than Hispanic (67.9%) students to have tried to quit smoking cigarettes during the 12 months preceding the survey. Asian students were significantly more likely than white students to have tried to quit smoking cigarettes during the 12 months preceding the survey. Among the 24 states that asked this question, the percentage of current cigarette smokers who had tried to quit cigarette smoking in the 12 months preceding the survey ranged from 51.3% in Mississippi (private schools) to 76.3% in New York (median: 59.2%) (Table 33). Wants to Stop Smoking Cigarettes Middle School. Nationally, 55.0% of current cigarette smokers said they want to stop smoking cigarettes (Figure 15 and Table 32). Among the 26 states that asked this question, the percentage of current cigarette smokers who want to stop smoking cigarettes ranged from 41.1% in Vermont to 65.1% in the District of Columbia (median: 55.2%) (Table 33). High School. Nationally, 61.0% of current cigarette smokers said that they want to stop smoking cigarettes (Figure 15). White (78.1%) and Asian (73.5%) students were significantly more likely than Hispanic students (57.4%) to report that they want to stop smoking cigarettes (Table 32). Among the 24 states that asked this question, the percentage of current cigarette smokers who want to stop smoking cigarettes ranged from 49.9% in Kansas to 71.8% in Hawaii (median: 57.1%) (Table 33). Secondhand SmokeExposure to Tobacco Smoke Were in Same Room with Someone Who Was Smoking on >1 of Preceding 7 Days Middle School. Nationally, current cigarette smokers (88.4%) were significantly more likely than never cigarette smokers (48.9%) to have been in the same room with someone who was smoking cigarettes on >1 of the preceding 7 days (Figure 16). Among never cigarette smokers, female students (51.4%) were significantly more likely than male students (46.1%) to have been in the same room with someone who was smoking cigarettes on >1 of the preceding 7 days (Table 34). White students (52.8%) were significantly more likely than black (45.8%), Hispanic (36.8%), or Asian (33.5%) students to have been in the same room with someone who was smoking cigarettes on >1 of the preceding 7 days. Black students were significantly more likely than Hispanic or Asian students to have been in the same room with someone who was smoking cigarettes on >1 of the preceding 7 days. Among current cigarette smokers, white students (92.3%) were significantly more likely than black (80.2%) or Hispanic (84.6%) students to have been in the same room with someone who was smoking cigarettes on >1 of the preceding 7 days. Among the 26 states that asked this question, the percentage of never cigarette smokers who were in the same room with someone who was smoking cigarettes on >1 of the preceding 7 days ranged from 36.4% in California to 63.7% in West Virginia (median: 49.1%). Among current smokers, rates ranged from 77.1% in the District of Columbia and Maryland to 94.0% in West Virginia (median: 87.1%) (Table 35). High School. Nationally, current cigarette smokers (91.6%) were significantly more likely than never cigarette smokers (56.2%) to have been in the same room with someone who was smoking cigarettes on >1 of the preceding 7 days (Figure 16). Among never cigarette smokers, white students (59.2%) were significantly more likely than Hispanic (44.6%) or Asian (49.9%) students to have been in the same room with someone who was smoking cigarettes on >1 of the preceding 7 days (Table 34). Among current cigarette smokers, female students (92.9%) were significantly more likely than male students (90.3%) to have been in the same room with someone who was smoking cigarettes on >1 of the preceding 7 days. White students (93.4%) were significantly more likely than black (85.1%), Hispanic (86.0%), or Asian (84.9%) students to have been in the same room with someone who was smoking cigarettes on >1 of the preceding 7 days. Among the 24 states that asked this question, the percentage of never cigarette smokers who were in the same room with someone who was smoking cigarettes on >1 of the preceding 7 days ranged from 39.7% in the District of Columbia to 71.5% in Kentucky (median: 56.5%). Among current cigarette smokers, rates ranged from 81.2% in the District of Columbia to 95.0% in Wisconsin (median: 91.3%) (Table 35). Rode in Car with Someone Who Was Smoking on >1 of Preceding 7 Days Middle School. Nationally, current cigarette smokers (80.6%) were significantly more likely than never cigarette smokers (31.9%) to have ridden in a car with someone who was smoking cigarettes on >1 of the preceding 7 days (Figure 16). Among students who have never smoked cigarettes, female students (34.1%) were significantly more likely than male students (29.5%) to have ridden in a car with someone who was smoking cigarettes on >1 of the preceding 7 days (Table 34). White (33.3%) and black (33.3%) students were significantly more likely than Hispanic (25.4%) or Asian (19.3%) students to have ridden in a car with someone who was smoking cigarettes on >1 of the preceding 7 days. Among current cigarette smokers, female students (84.5%) were significantly more likely than male students (77.0%) to have ridden in a car with someone who was smoking cigarettes. White students (83.6%) were significantly more likely than black (74.5%) or Hispanic (74.0%) students to have ridden in a car with someone who was smoking cigarettes on >1 of the preceding 7 days. Among the 26 states that asked students if they rode in a car with someone who was smoking cigarettes on >1 of the preceding 7 days, the percentage of never cigarette smokers ranged from 21.7% in the District of Columbia to 45.5% in West Virginia (median: 34.3%). Among current cigarette smokers, rates ranged from 63.0% in New York to 87.1% in Maine (median: 79.1%) (Table 35). High School. Nationally, current cigarette smokers (82.9%) were significantly more likely than never cigarette smokers (29.6%) to have ridden in a car with someone who was smoking cigarettes on >1 of the preceding 7 days (Figure 16). Among students who have never smoked cigarettes, black students (34.0%) were significantly more likely than Hispanic (25.0%) or Asian (24.3%) students to have ridden in a car with someone who was smoking cigarettes on >1 of the preceding 7 days (Table 34). Among current cigarette smokers, female students (85.8%) were significantly more likely than male students (80.2%) to have ridden in a car with someone who was smoking cigarettes; and white students (84.9%) were significantly more likely than black (77.7%), Hispanic (74.6%), or Asian (75.4%) students to have ridden in a car with someone who was smoking cigarettes on >1 of the preceding 7 days. Among the 24 states that asked this question, the percentage of never cigarette smokers who had ridden in a car with someone who was smoking cigarettes on >1 of the preceding 7 days ranged from 19.9% in Colorado to 43.3% in Kentucky (median: 29.2%). Among current cigarette smokers, rates ranged from 70.0% in the District of Columbia to 91.3% in Wisconsin (median: 86.1%) (Table 35). Think Smoke From Other Persons' Cigarettes is Harmful to Them Middle School. Nationally, never cigarette smokers (92.9%) were significantly more likely than current cigarette smokers (80.0%) to think that secondhand smoke was harmful to them (Figure 16). Among never cigarette smokers, white (95.6%) and Asian (94.6%) students were significantly more likely than black (85.3%) or Hispanic (87.3%) students to think smoke from other persons' cigarettes was harmful to them (Table 34). Among the 26 states that asked this question, the percentage of never cigarette smokers who thought that smoke from other persons' cigarettes was harmful to them ranged from 82.7% in the District of Columbia to 97.5% in Maine (median: 91.9%). Among current cigarette smokers, rates ranged from 67.6% in the District of Columbia to 88.5% in New Hampshire (median: 82.7%) (Table 35). High School. Nationally, never cigarette smokers (94.7%) were significantly more likely than current cigarette smokers (89.8%) to think that smoke from other persons' cigarettes was harmful to them (Figure 16). Among never cigarette smokers, female students (96.2%) were significantly more likely than male students (93.0%) to think smoke from other persons' cigarettes was harmful to them; white (96.6%) and Asian (95.6%) students were significantly more likely than black (87.3%) or Hispanic (90.8%) students to think that smoke from other persons' cigarettes was harmful to them. Among current cigarette smokers, female students (92.9%) were significantly more likely than male students (86.9%) to think smoke from other persons' cigarettes was harmful to them; white students (91.9%) were significantly more likely than black (79.7%) or Hispanic (85.4%) students, and Asian students (89.4%) were significantly more likely than black students to think that smoke from other persons' cigarettes was harmful to them (Table 34). Among the 24 states that asked students if they thought that smoke from other persons' cigarettes is harmful to them, the percentage of never cigarette smokers ranged from 87.1% in the District of Columbia to 97.2% in Delaware and Iowa (median: 94.9%). Among current smokers, rates ranged from 76.2% in the District of Columbia to 93.8% in Wisconsin (median: 89.9%) (Table 35). Exposure to Tobacco Use at Home Anyone in Home Smokes Cigarettes Middle School. Nationally, current cigarette smokers (70.1%) were significantly more likely than students who had never smoked cigarettes (32.4%) to live in a home where someone smokes cigarettes (Figure 17). Black never cigarette smokers (36.5%) were significantly more likely than Hispanic never cigarette smokers (28.7%) to live in a home where someone smokes cigarettes (Table 36). Among current cigarette smokers, white students (73.8%) were significantly more likely than black (63.7%) or Hispanic (62.0%) students to live in a home where someone smokes cigarettes. Among the 26 states that asked this question, the percentage of never cigarette smokers who lived in a home where someone smoked cigarettes ranged from 25.2% in Wyoming to 43.8% in Arkansas (median: 35.4%). Among current cigarette smokers, rates ranged from 57.1% in California to 77.5% in Maine (median: 68.9%) (Table 37). High School. Nationally, current cigarette smokers (56.7%) were significantly more likely than students who had never smoked cigarettes (27.5%) to live in a home where someone smoked (Figure 17 and Table 36). Among the 24 states that asked this question, the percentage of never cigarette smokers ranged from 20.8% in Colorado to 40.5% in Mississippi (public schools) (median: 28.7%). Among current cigarette smokers, rates ranged from 43.0% in Mississippi (private schools) to 64.9% in Delaware (median: 56.7%) (Table 37). Anyone in Home Uses Smokeless Tobacco Middle School. Nationally, current users of smokeless tobacco (47.7%) were significantly more likely than students who had never used smokeless tobacco (7.4%) to live in a home where someone used smokeless tobacco (Figure 17). Among never users, white students (8.8%) were significantly more likely than black (5.2%), Hispanic (3.6%), or Asian (3.2%) students to live in a home where someone used smokeless tobacco (Table 36). Among the 26 states that asked this question, the percentage of never users ranged from 3.7% in California and New York to 23.9% in West Virginia (median: 9.8%). Among current users, rates ranged from 29.1% in Delaware to 61.3% in Arkansas (median: 45.4%) (Table 37). High School. Nationally, current users of smokeless tobacco (31.8%) were significantly more likely than students who had never used smokeless tobacco (6.7%) to live in a home where someone used smokeless tobacco (Figure 17). Among never users, female students (7.8%) were significantly more likely than male students (5.2%) to live in a home where someone used smokeless tobacco, and white students (7.7%) were significantly more likely than Hispanic (3.9%) or Asian (3.4%) students to live in a home where someone used smokeless tobacco (Table 36). Among the 24 states that asked this question, the percentage of never users who lived in a home where someone used smokeless tobacco ranged from 3.9% in Delaware to 22.7% in West Virginia (median: 9.3%). Among current users, rates ranged from 21.5% in Hawaii to 50.5% in Mississippi (private schools) (median: 38.1%) (Table 37). SchoolStudents Who Practiced Ways to Say "No" to Tobacco as Part of School Curriculum Practice of Refusal Skills Middle School. Nationally, 41.9% of students practiced ways to say "no" to cigarettes as part of the school curriculum (Figure 18 and Table 38). Among the 25 states that asked this question, the percentage of students who practiced ways to say "no" to tobacco in school ranged from 22.1% in Mississippi (private schools) to 54.9% in Maine (median: 42.0%) (Table 39). High School. Nationally, 14.7% of students practiced ways to say "no" to cigarettes as part of the school curriculum (Figure 18). Black (21.0%), Hispanic (18.5%), and Asian (18.6%) students were significantly more likely than white students (12.4%) to have practiced ways to say "no" to tobacco in school (Table 38). Among the 23 states that asked this question, the percentage of students who practiced ways to say "no" to tobacco in school ranged from 9.3% in Mississippi (private schools) to 23.7% in Hawaii (median: 15.0%) (Table 39). Students Who Smoked Cigarettes on School Property During Preceding 30 Days Cigarettes Middle School. Nationally, 3.0% of students smoked cigarettes on school property in the 30 days preceding the survey (Figure 18). Male students (3.6%) were significantly more likely than female students (2.4%) to have smoked cigarettes on school property in the 30 days preceding the survey (Table 38). Among the 25 states that asked this question, the percentage of students who smoked cigarettes on school property during the 30 days preceding the survey ranged from 1.7% in Kansas to 6.3% in Kentucky (median: 3.9%) (Table 39). High School. Nationally, 9.4% of students smoked cigarettes on school property during the 30 days preceding the survey (Figure 18). Male students (11.1%) were significantly more likely than female students (7.7%) to have smoked cigarettes on school property during the 30 days preceding the survey, and white students (10.4%) were significantly more likely than black students (5.7%) to have smoked cigarettes on school property during the preceding 30 days (Table 38). Among the 24 states that asked this question, the percentage of students who had smoked cigarettes on school property during the 30 days preceding the survey ranged from 6.4% in California to 18.6% in Kentucky (median: 10.7%) (Table 39). Students Who Used Smokeless Tobacco on School Property During Preceding 30 Days Smokeless Tobacco Middle School. Nationally, 2.0% of students used smokeless tobacco on school property during the 30 days preceding the survey (Figure 18). Male students (3.3%) were significantly more likely than female students (0.8%) to have used smokeless tobacco on school property during the 30 days preceding the survey (Table 38). Among the 26 states that asked this question, the percentage of students who had used smokeless tobacco on school property during the 30 days preceding the survey ranged from 1.1% in New Hampshire to 5.1% in Wyoming (median: 2.1%) (Table 39). High School. Nationally, 4.0% of students used smokeless tobacco on school property in the 30 days preceding the survey (Figure 18). Male students (7.3%) were significantly more likely than female students (0.6%) to have used smokeless tobacco on school property during the 30 days preceding the survey, and white students (4.5%) were significantly more likely than black (2.6%) or Asian (1.8%) students to have used smokeless tobacco on school property during the 30 days preceding the survey (Table 38). Among the 24 states that asked this question, the percentage of students who had used smokeless tobacco on school property during the 30 days preceding the survey ranged from 2.3% in Delaware to 11.9% in Mississippi (private schools) (median: 5.1%) (Table 39). DISCUSSIONCDC recommends that states establish comprehensive tobacco-control programs that include nine elements (9):
Survey data can be used as part of an essential surveillance and evaluation system to document the extent of the problem and monitor and document the effectiveness of comprehensive tobacco-control programs. Surveillance should include periodic and ongoing monitoring of tobacco-related attitudes, behaviors, health outcomes, and the prevalence of protobacco influences (e.g., advertising, promotions, and events that glamorize tobacco use). Evaluation elements should measure the affect of program elements on attitudes, behaviors, and policies. Linking YTS Data to Program ComponentsStates can use this report in developing and reporting on six of the nine elements of their comprehensive tobacco-control programs. National estimates for these elements provide an initial marker by which states can compare their current data. In the future, states can a) monitor their trends across time, a step that could lead to program development and modifications; b) compare their state data with those of other states to identify successful programs; and c) compare their state data with national estimates. The following data from the NYTS are an example of how states can report youth surveillance and evaluation data within the context of a comprehensive tobacco-control program. Surveillance The rate of current cigarette smoking documented by the 2000 NYTS is consistent with the most recent data from the national Youth Risk Behavior Survey (13) and the Monitoring the Future Survey (4), both conducted in 1999. For the NYTS and the Monitoring the Future Survey, rates are similar for students in grades 8, 10, and 12. For the NYTS and the national Youth Risk Behavior Survey, rates are similar for students in grades 9, 10, 11, and 12. Community Programs Community programs to reduce tobacco use should focus on four goals: a) prevention of the initiation of tobacco use among young persons; b) cessation for current users of tobacco; c) protection from secondhand smoke; and d) elimination of disparities in tobacco use among populations. CDC encourages states to analyze and report their data regarding racial and ethnic disparities when possible. NYTS results support the need for these goals.
School Programs School programs that prevent the initiation of tobacco use are a critical element of comprehensive tobacco-control programs because the majority of persons start smoking before age 18 years (5,14). Several studies have documented that effective school-based tobacco prevention programs, in conjunction with community intervention programs such as media campaigns and price increases, can significantly reduce or delay adolescent smoking (5,14--17).
Enforcement Enforcement of tobacco-control policies enhances their efficacy by deterring violators and by sending a message to the public that community leaders believe that these policies are important (18). The two primary areas addressed by local and state policies that require enforcement strategies are restrictions on minors' access to tobacco and restrictions on smoking (clean indoor air) policies.
Countermarketing Tobacco advertising and promotion activities can both stimulate adult consumption and increase the risk of youth initiation (5,19). Children buy the most heavily advertised cigarette brands (20) and are three times more affected by advertising than are adults (21). Countermarketing activities can promote cigarette smoking cessation among young persons and decrease the likelihood that they will begin cigarette smoking. Countermarketing messages can also substantially influence public support for tobacco-control intervention and build a supportive climate for school and community efforts.
Smoking Cessation Quitting cigarette smoking can produce a increased short-term public health benefit than any other element of a comprehensive tobacco-control program. The NYTS and state YTS data demonstrate the need for programs that help adolescents to quit cigarette smoking. However, little is known about the effectiveness of these interventions among adolescents (22). With no interventions proven effective for adolescents, states should carefully evaluate any programs that are implemented.
LimitationsThe findings in this report have at least three limitations. First, these data apply only to youth who attend middle school or high school and are not representative of all persons in this age group. However, in 1997, only 4% of 16-year-olds and 6% of 17-year-olds who had not completed high school were not enrolled in a high school program (23). The dropout rate for young adults aged 16--24 years varies substantially by race/ethnicity (7.6%, white; 13.4%, black; and 25.3% Hispanic) (23). Second, the NYTS and the majority of state surveys were conducted during the spring semester, whereas a small number of states conducted surveys during the fall semester. Within each grade, the fall school population is approximately 6 months younger than the spring school population. This difference can be expected to lead to higher estimates of ever tobacco use in the spring surveys and also might lead to higher estimates of current use. Future analysis of data from the fall 1999 NYTS and spring 2000 NYTS will provide a measure of this effect. Third, the data are all based on self-reports, possibly leading to under- or overreporting of behavior. Although the extent of this under- or overreporting of behavior cannot be determined, some YTS questions have been analyzed and demonstrate good test-retest reliability (24). CONCLUSIONState Implementation of YTSAfter completing their 2000 surveys, Florida, Mississippi, and Texas have data for 3 years, and Arkansas, Kansas, and Tennessee have data for 2 years to begin examining trends. A report recently published by Florida documents a substantial decline in youth tobacco use --- including current and lifetime use of cigarettes, cigars, and smokeless tobacco --- during the preceding 3 years (25). Substantial shifts in attitudes toward an antitobacco direction also occurred in Florida during this time. YTS findings in Florida have led to the adoption of youth-oriented programs by other states. The YTS provides states with a mechanism for responding to emerging concerns within tobacco control. For example, in 1998, Texas was the first state to include questions regarding tobacco use in a pipe. After Texas reported a 8.5% prevalence rate of pipe use among middle school students, other states realized the public health significance of monitoring pipe use among adolescents. Similarly, in 1999, New Jersey was the first state to include questions regarding use of bidis and kreteks. After finding 11.0% of middle school students and 21.3% of high school students had ever smoked bidis, and 6.3% of middle school students and 11.1% of high school students had ever smoked kreteks, questions regarding these products were added to the 2000 core YTS questionnaire. Data from the YTS have been used in several states to generate legislative support for allocation of dollars from the Master Settlement Agreement to support tobacco control and prevention efforts. The survey can then be used to report on the effectiveness of the programs developed under the Master Settlement Agreement. A distinct feature of the YTS is that it allows states to obtain substate-level estimates to support their tobacco-control efforts. For example, after conducting the survey in 1999 to provide baseline data to support the youth component of their tobacco-control program, Tennessee expanded their 2000 YTS sample design to provide data for each of the state's 13 health regions to support local tobacco-control efforts. The scope of such efforts continues to grow, and during fall 2000, Maryland conducted the largest YTS to date, successfully collecting middle school and high school data in 23 counties and the city of Baltimore. Localities (e.g., city, community, county, district, tribal councils, and U.S. territories) have also conducted the survey independent of the state(s). For example, separate surveys have been conducted in large cities such as New York City and Detroit; in seven smaller cities and counties in Wisconsin (Cameron, Florence County, Franklin County, Neenah, St. Francis, Western Racine County, and Waupaca); by two tribal councils (Great Lakes Inter-Tribal Council and Inter-Tribal Council of Arizona); and by four U.S. territories (American Virgin Islands, Commonwealth of the Northern Mariana Islands, Federated States of Micronesia, and Palau). Finally, the YTS is an integral component of surveillance and evaluation plans implemented by states. New Jersey has developed a logic model to outline the links between multiple data sources and their programmatic objectives. In New Jersey, the YTS is one source of data for monitoring progress toward initial, intermediate, and long-term outcome objectives for their comprehensive tobacco-control program. The YTS continues to serve as a critical surveillance and evaluation tool for the design, implementation, and evaluation of comprehensive tobacco-control and prevention programs. Uses of YTS Data For states that have participated in the survey and for states that plan to participate in the future, the state YTS and NYTS are primary sources of data for planning, monitoring and evaluating the youth component of state-based tobacco-control programs. The following are examples of how data can be used:
References
* Bidis (or beedies) are small brown cigarettes from India consisting of tobacco wrapped in a leaf and tied with a thread. Kreteks (also called clove cigarettes) are flavored cigarettes containing tobacco and clove extract. Bidis and kreteks are two emerging forms of tobacco in the United States. ** Estimates are not reported when <35 cases are in the denominator. *** Unless otherwise noted, the data in this report are for 2000. For Mississippi, the type of school (private or public) is identified in parentheses. **** Lifetime use was defined by asking a) Ever tried cigarettes, even one or two puffs? b) Ever tried smoking cigars, cigarillos, or little cigars, even one or two puffs? c) Ever used chewing tobacco, snuff, or dip, such as Redman,® Levi Garrett,® Beechnut,® Skoal,® Skoal Bandits,® or Copenhagen®? d) Ever tried smoking bidis, even one or two puffs? e) Ever tried smoking any of the following: bidis, kreteks, both, neither? ***** Ever smoked cigarettes daily was defined as having ever smoked at least one cigarette every day for 30 days. ****** Age of initiation was determined by asking a) How old were you when you smoked a whole cigarette for the first time? b) How old were you when you when you smoked a cigar, cigarillo, or little cigar for the first time? c) How old were you when you first used chewing tobacco, snuff, or dip for the first time? Questions on age of initiation were not asked for pipes, bidis, or kreteks. ******* Frequent use of tobacco was defined as having used a tobacco product on >20 of the 30 days preceding the survey. The survey included questions regarding frequent use of cigarettes, cigars, smokeless tobacco, and pipes. ******** This definition for susceptibility was developed by Pierce and colleagues (12). ********* Eleven percent of middle school students reported current cigarette smoking. Of this group, 7.3% obtained their cigarettes by buying them in a store, 69.4% of whom were not asked to show proof of age when making the purchase. ********** Twenty-eight percent of high school students reported current cigarette smoking. Of this group, 32.3% obtained their cigarettes by buying them in a store, 58.1% of whom were not asked to show proof of age when making the purchase. *********** Eleven percent of middle school students reported current cigarette smoking. Of this group, 7.3% obtained their cigarettes by buying them in a store, 62.4% of whom were not refused purchase because of their age. ************ Twenty-eight percent of high school students reported current cigarette smoking. Of this group, 32.3% obtained their cigarettes by buying them in a store, 58.1% of whom were not refused purchase because of their age. ************* Bold, italic type indicates the six elements of Best Practices for Tobacco Control Programs (9) that are covered in the state Youth Tobacco Surveys. States can use survey data to monitor these six elements. Table 1 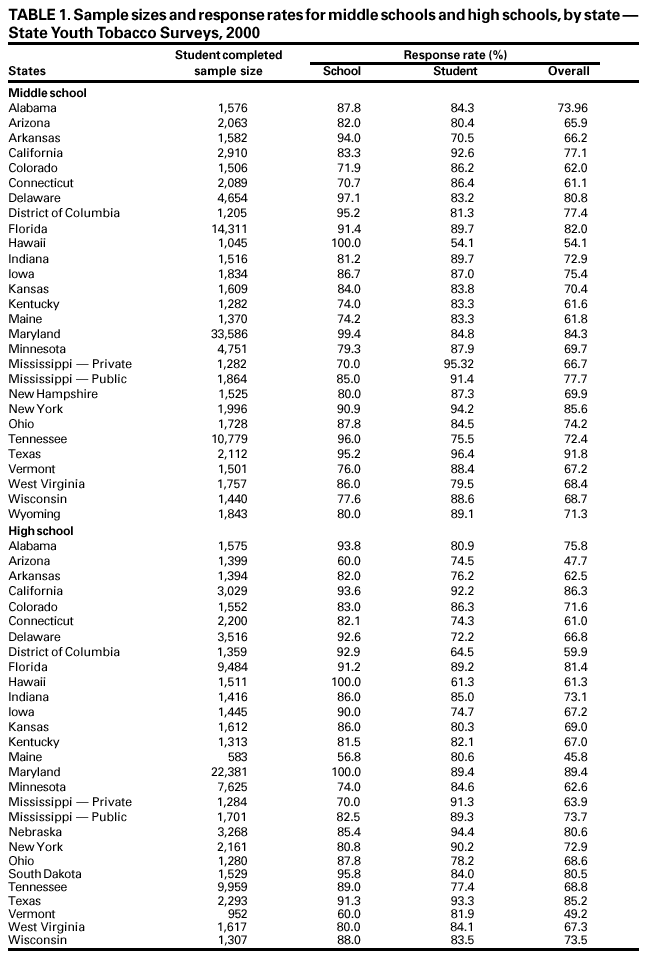 Return to top. Figure 1 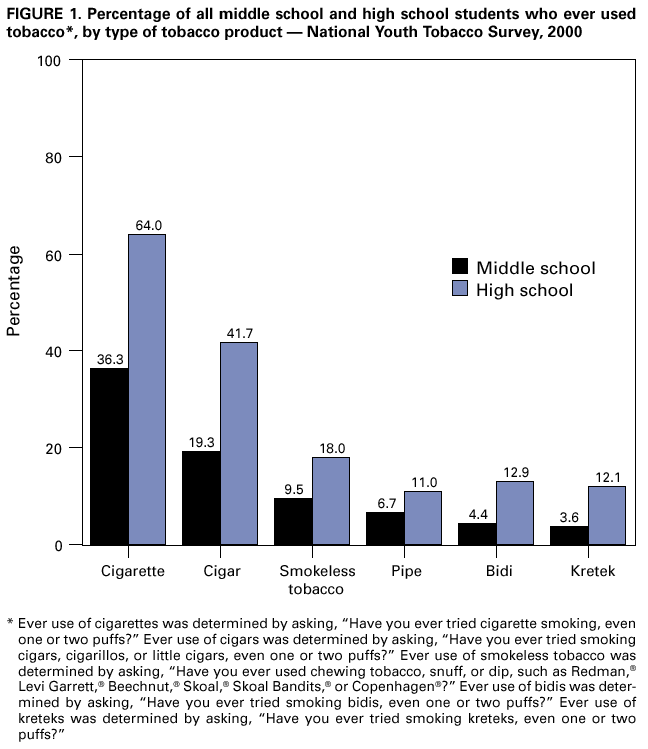 Return to top. Table 2 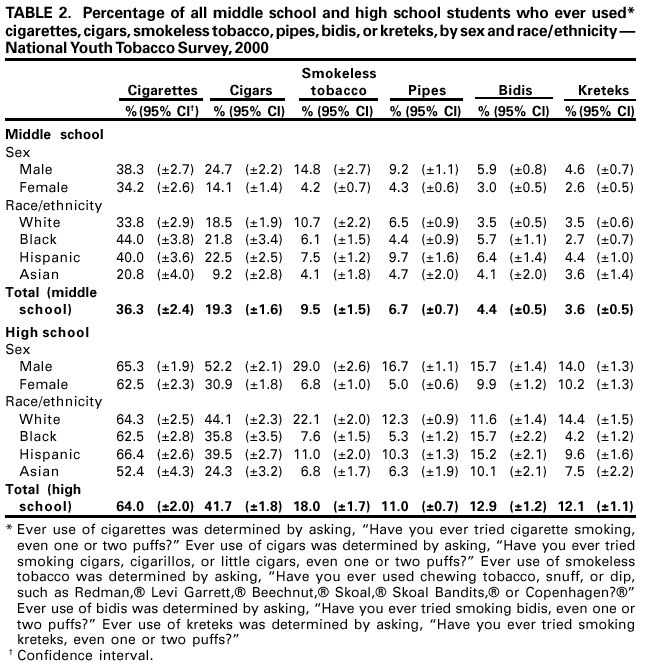 Return to top. Figure 2 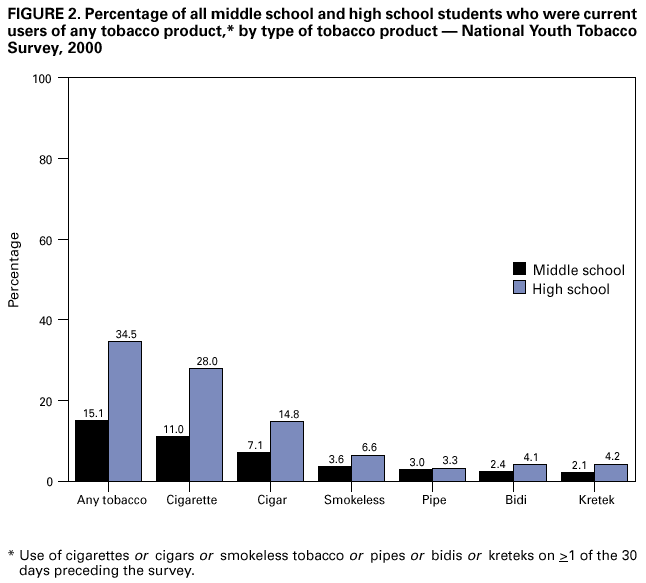 Return to top. Table 3 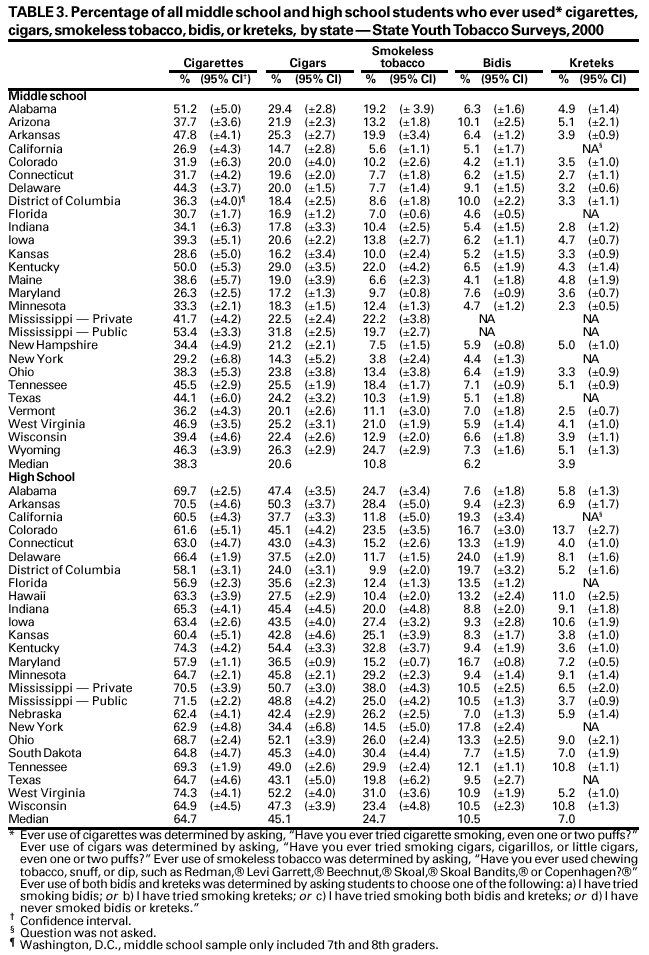 Return to top. Figure 3 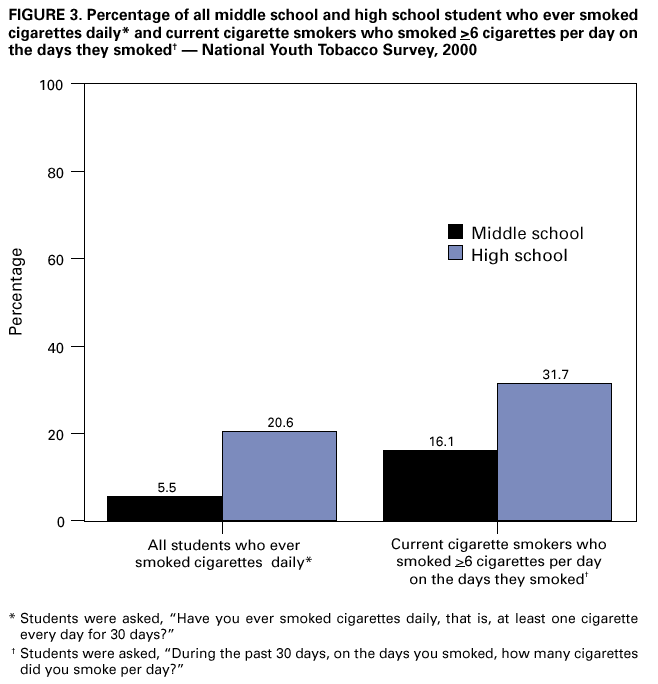 Return to top. Table 4 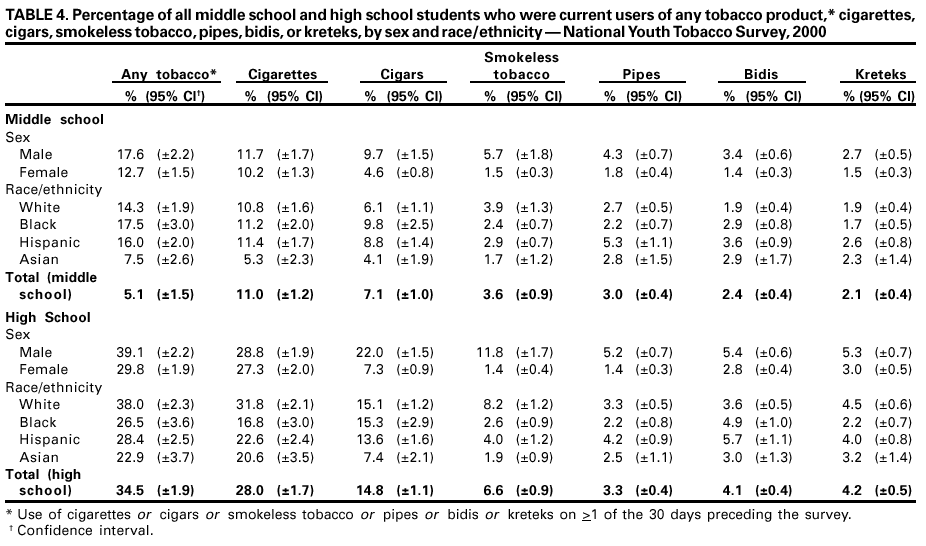 Return to top. Figure 4 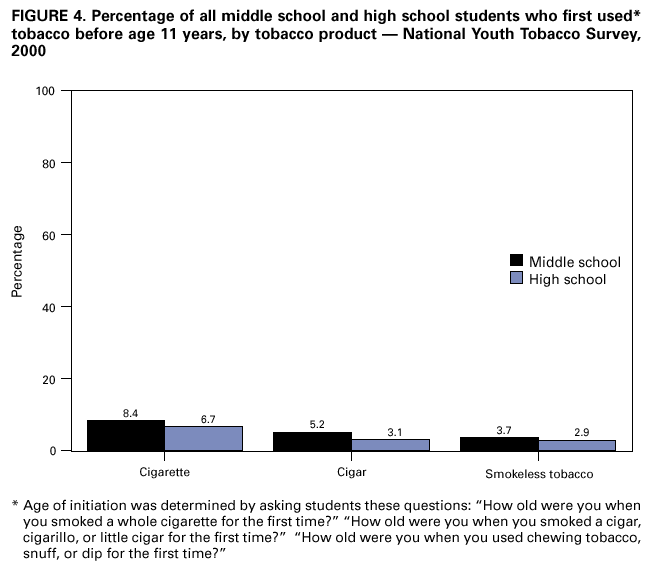 Return to top. Table 5 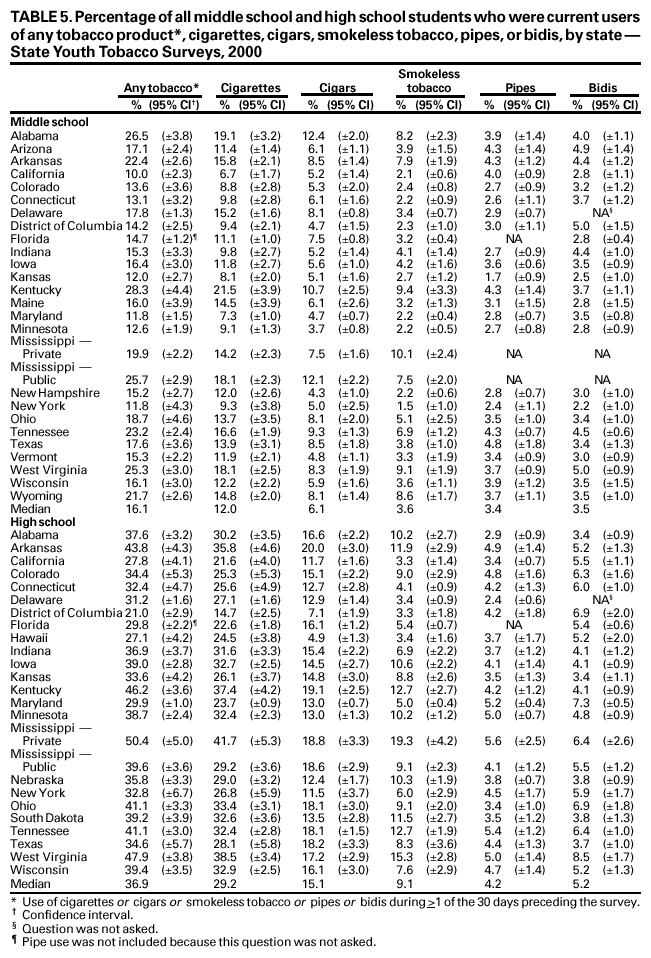 Return to top. Figure 5 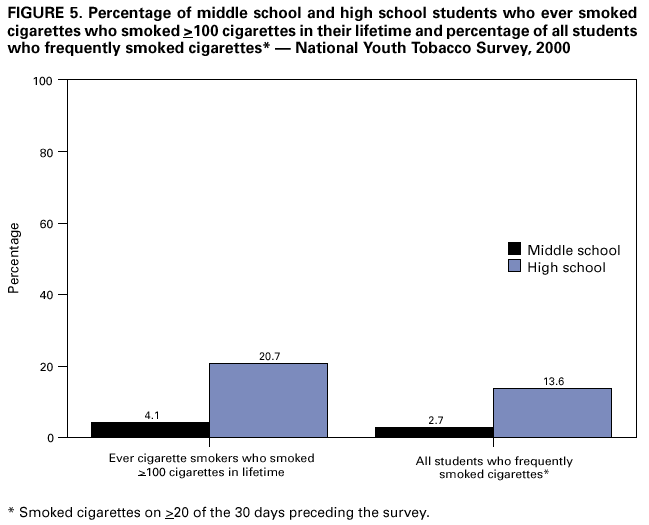 Return to top. Table 6 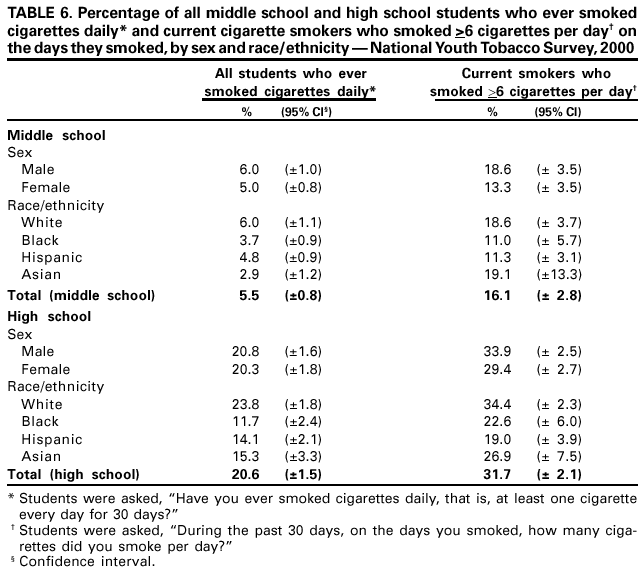 Return to top. Figure 6 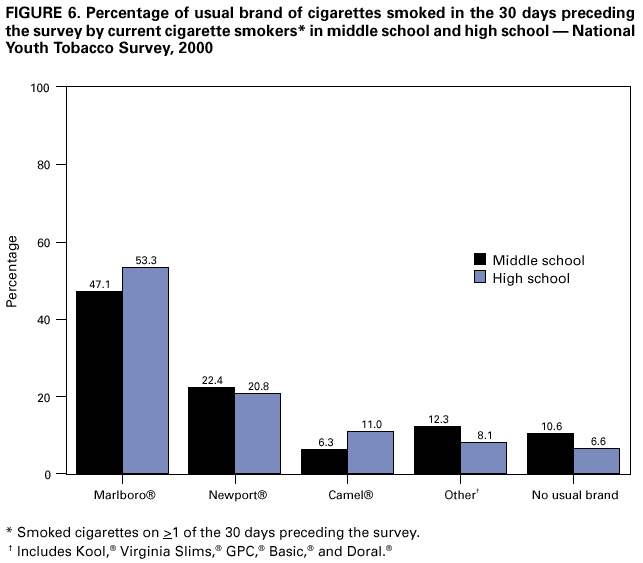 Return to top. Table 7 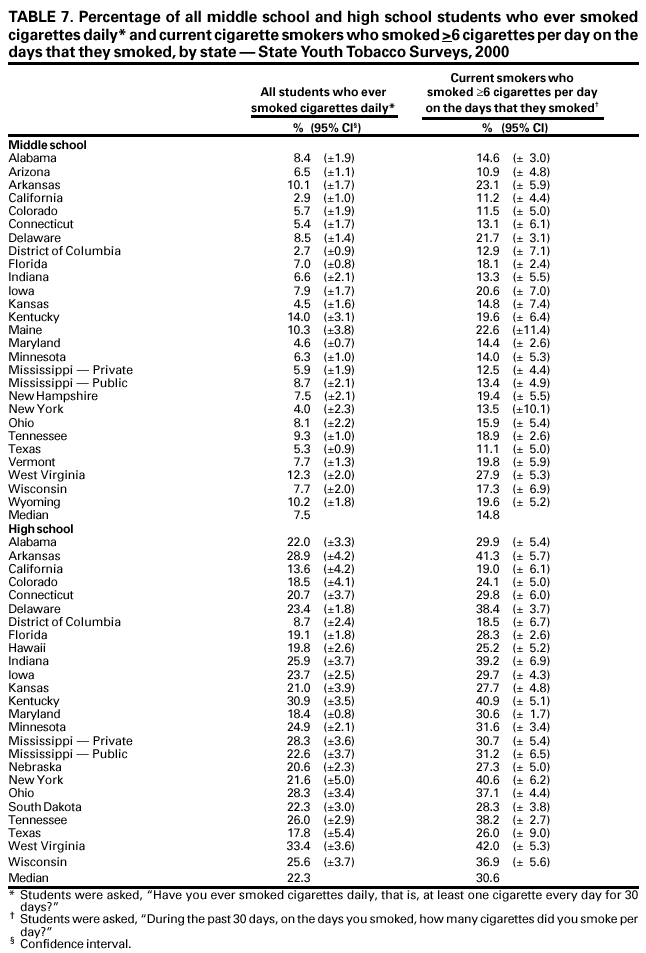 Return to top. Figure 7 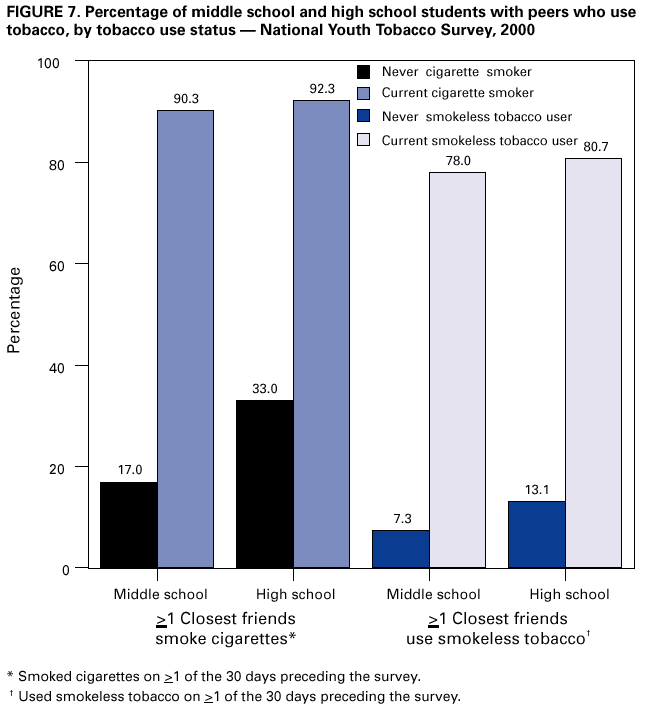 Return to top. Table 8 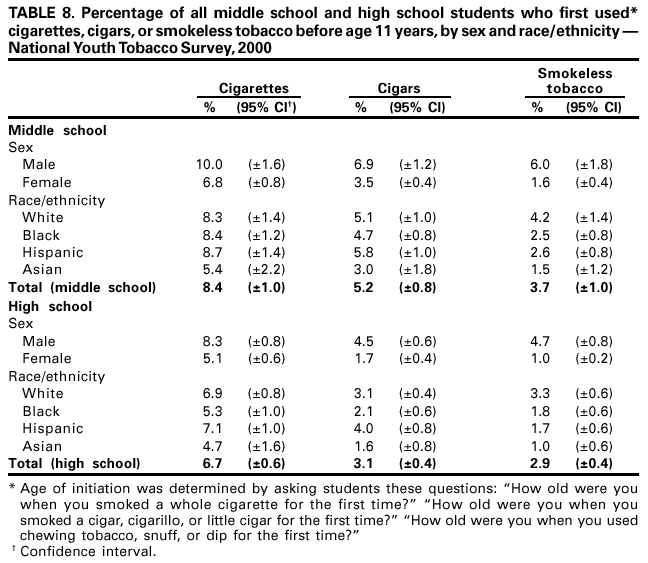 Return to top. Figure 8 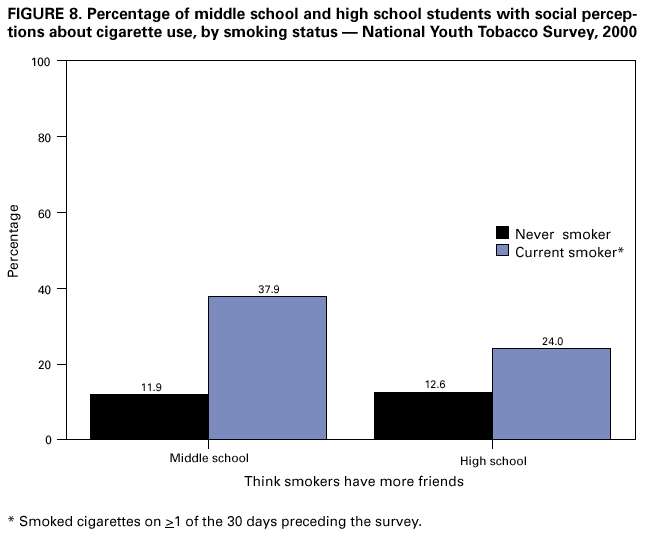 Return to top. Table 9 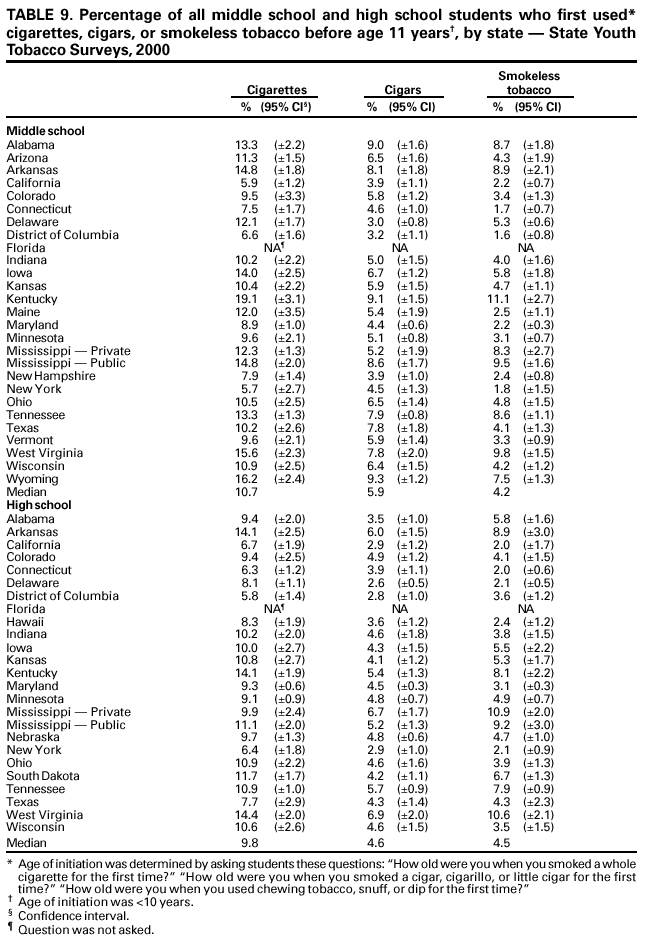 Return to top. Figure 9 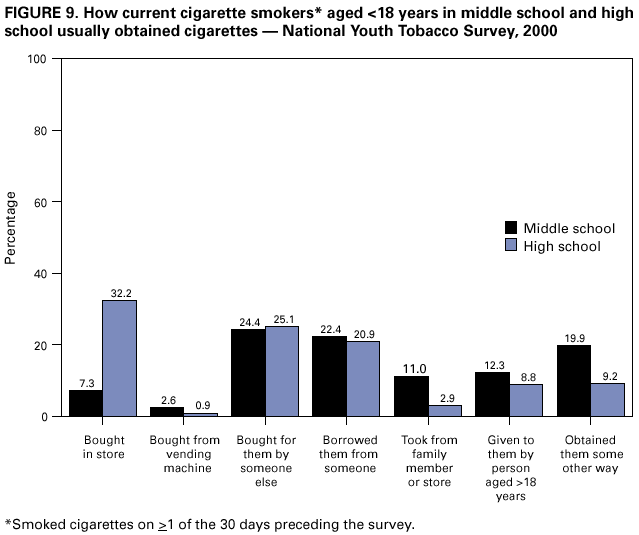 Return to top. Table 10 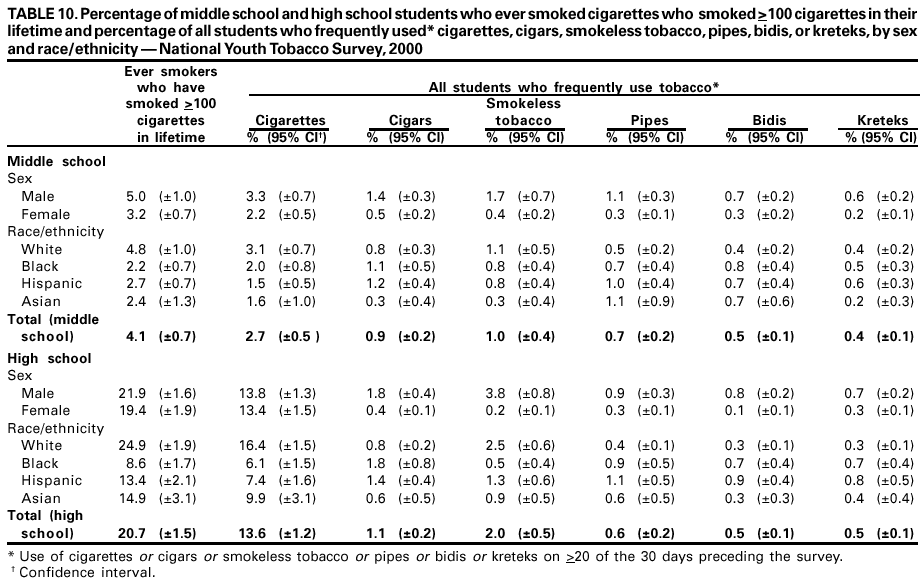 Return to top. Figure 10 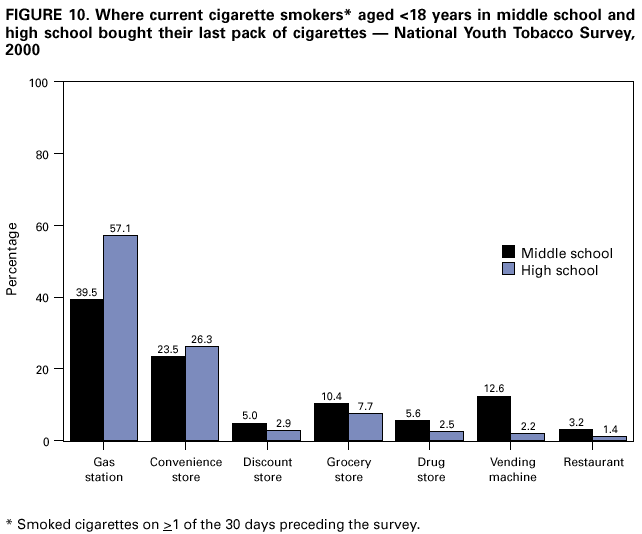 Return to top. Table 11 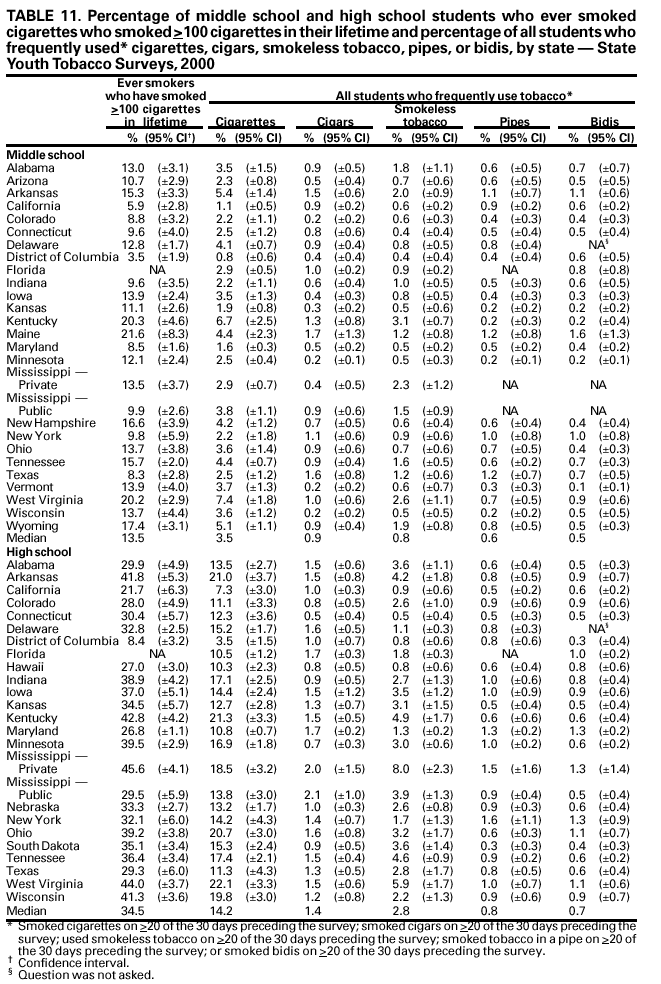 Return to top. Figure 11 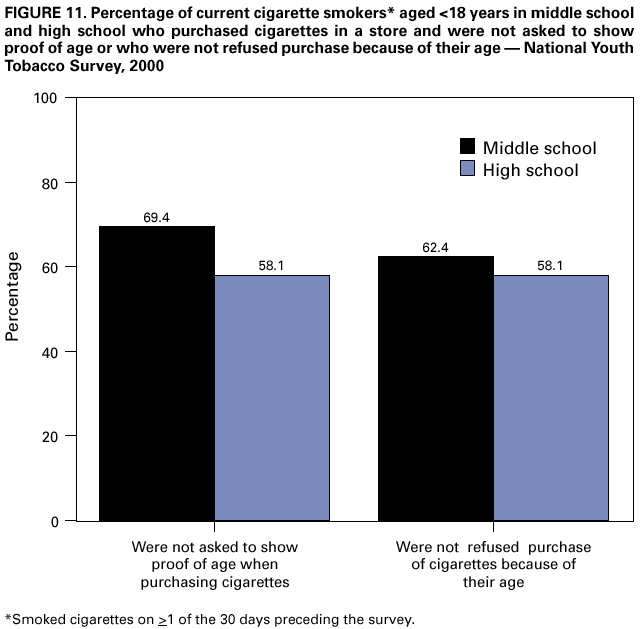 Return to top. Table 12 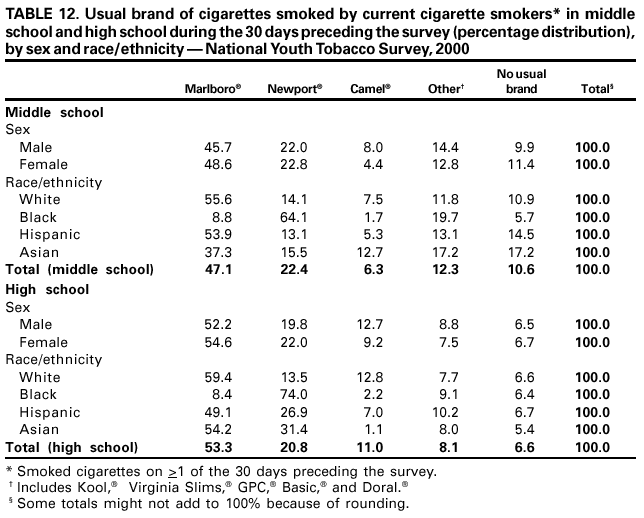 Return to top. Figure 12 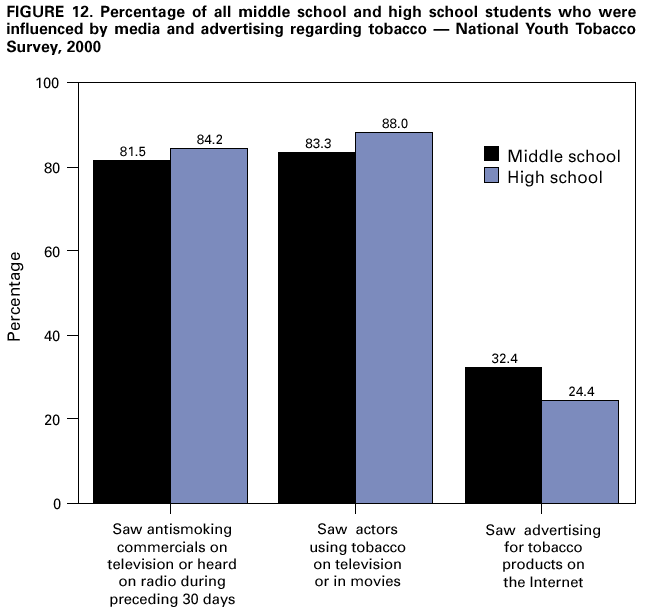 Return to top. Table 13 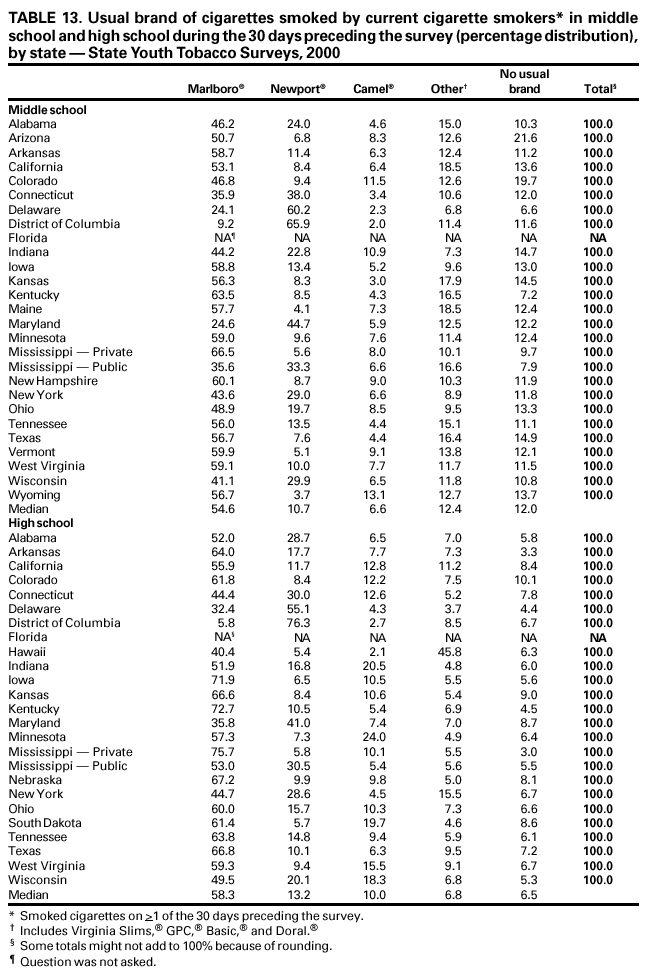 Return to top. Figure 13 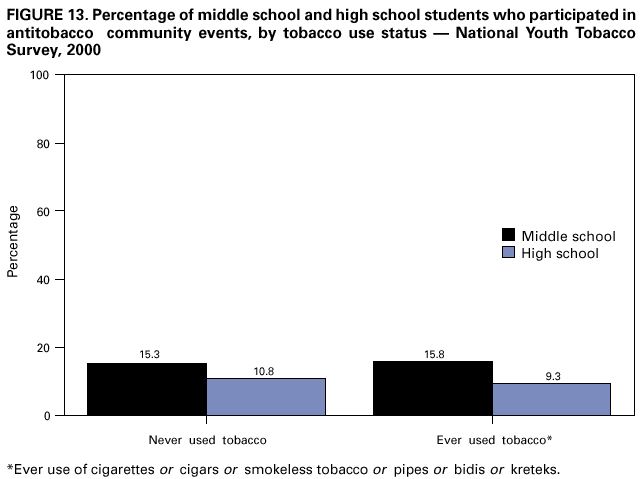 Return to top. Table 14 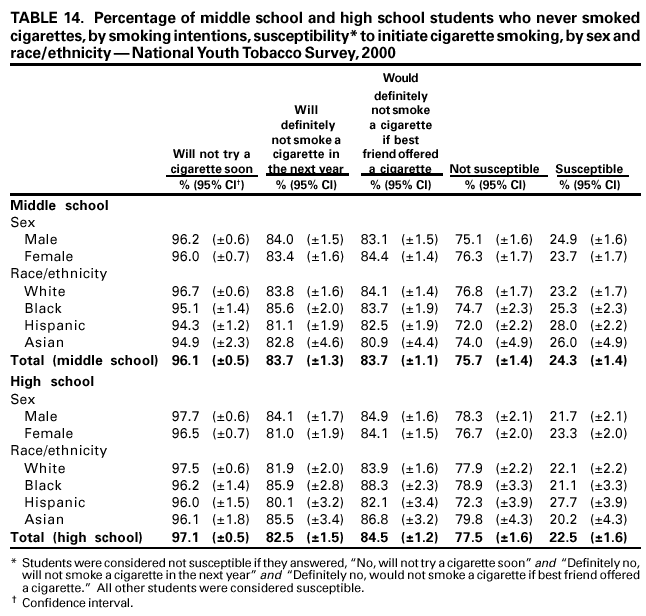 Return to top. Figure 14 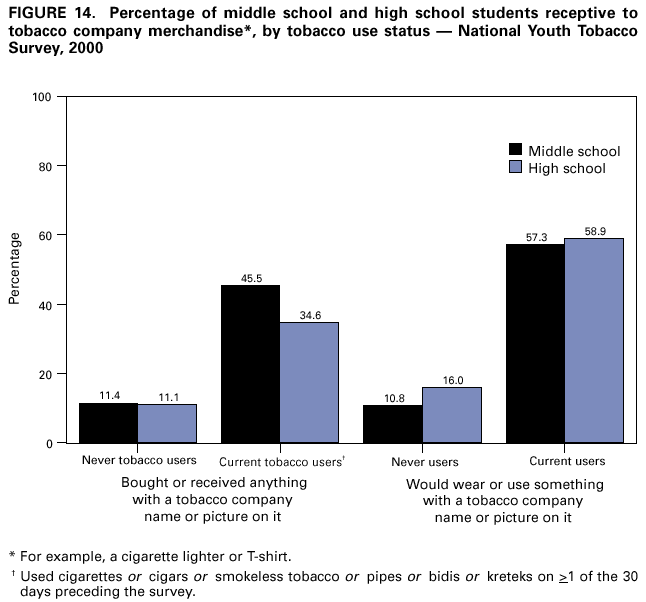 Return to top. Table 15 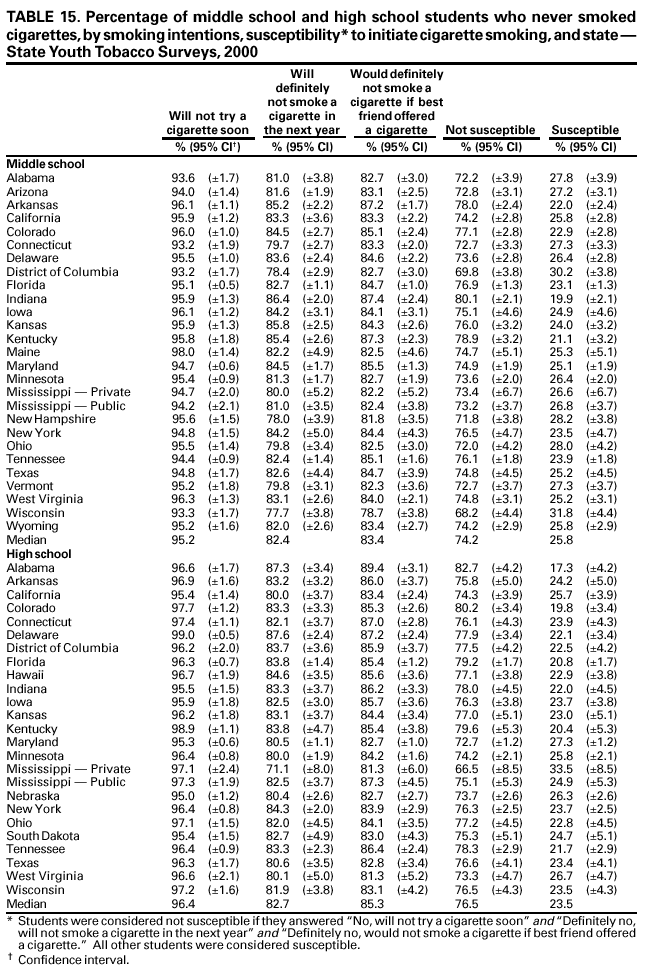 Return to top. Figure 15 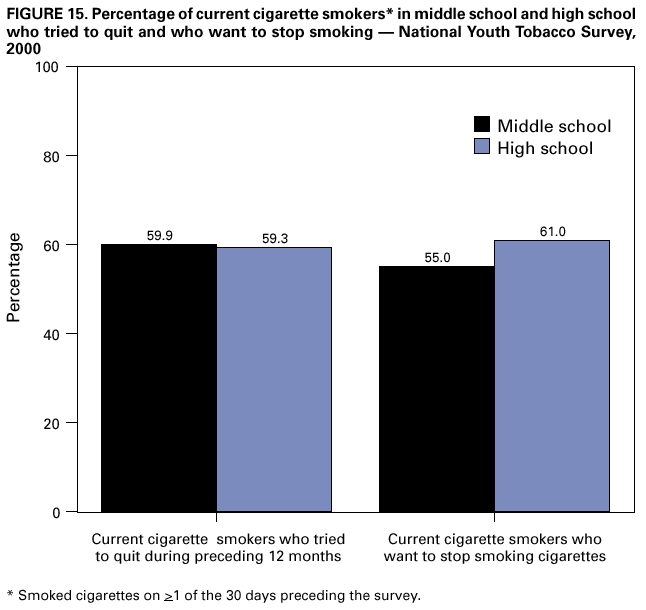 Return to top. Table 16 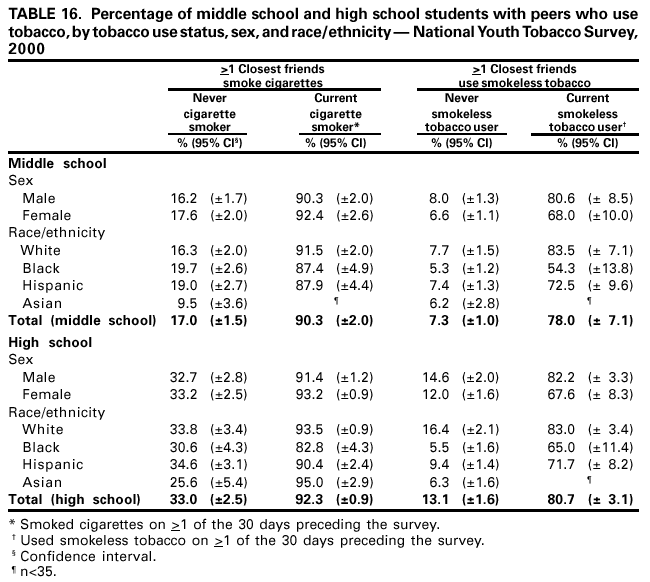 Return to top. Figure 16 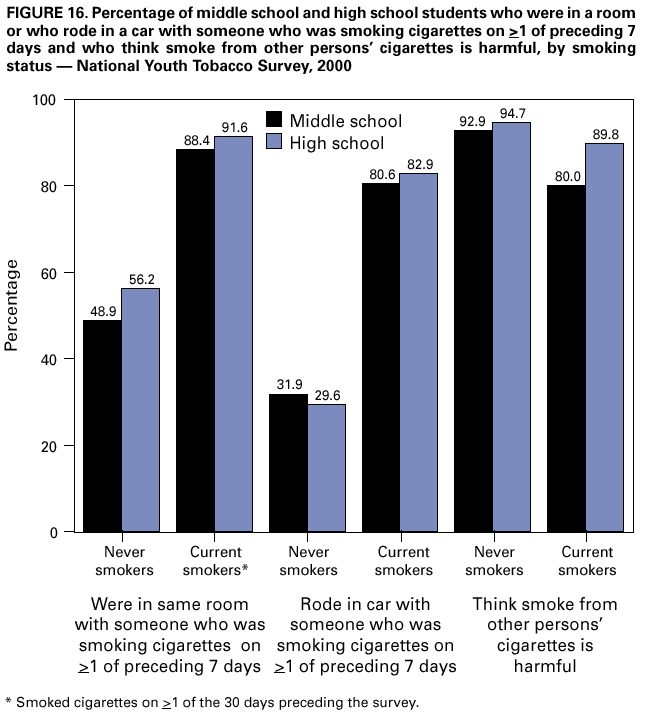 Return to top. Table 17 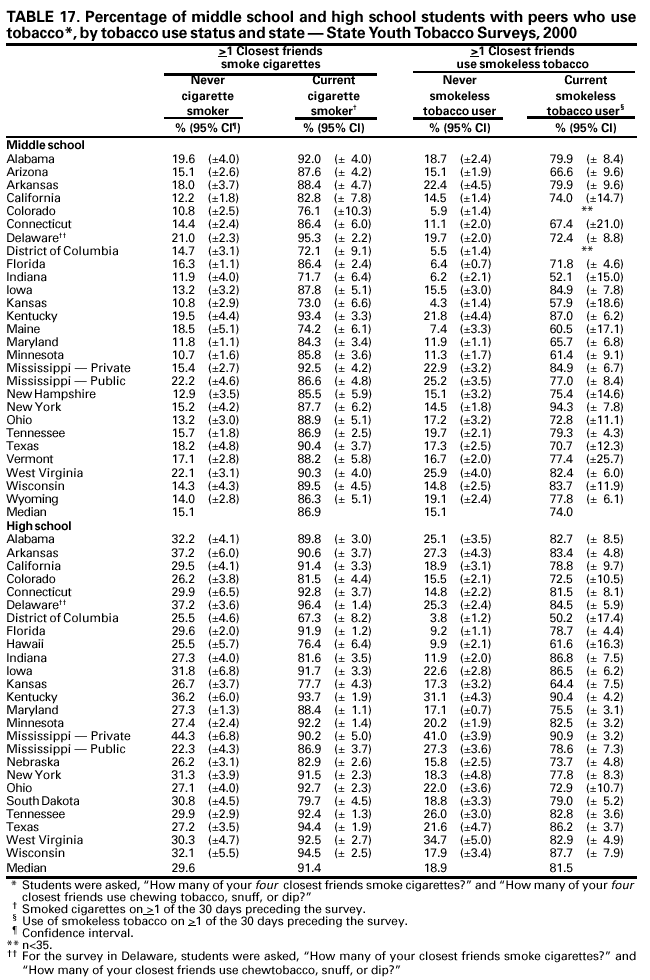 Return to top. Figure 17 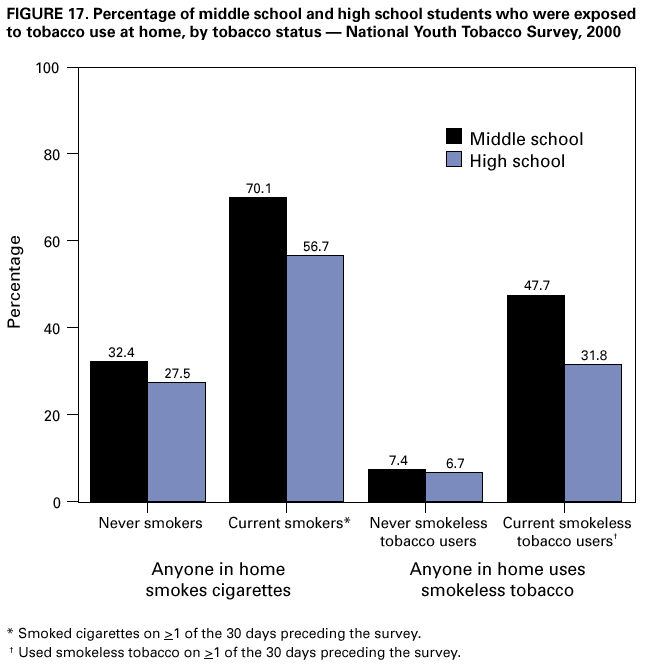 Return to top. Table 18 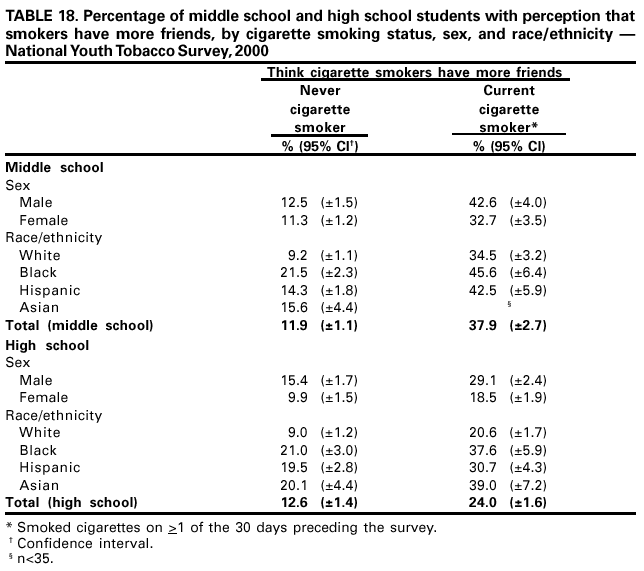 Return to top. Figure 18 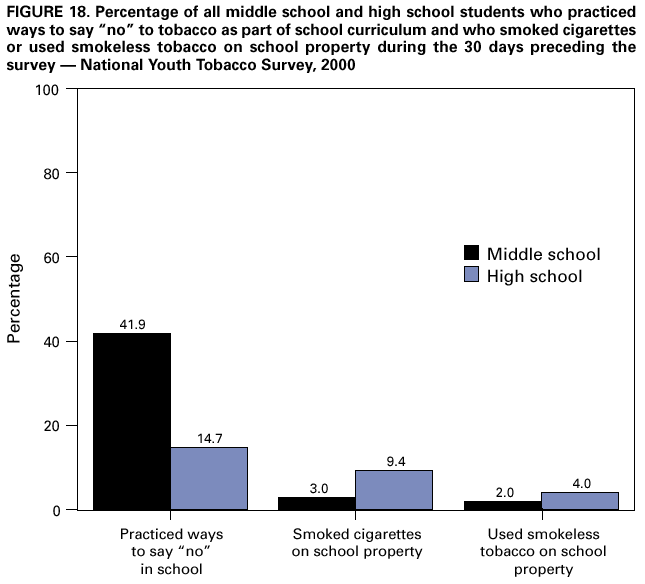 Return to top. Table 19 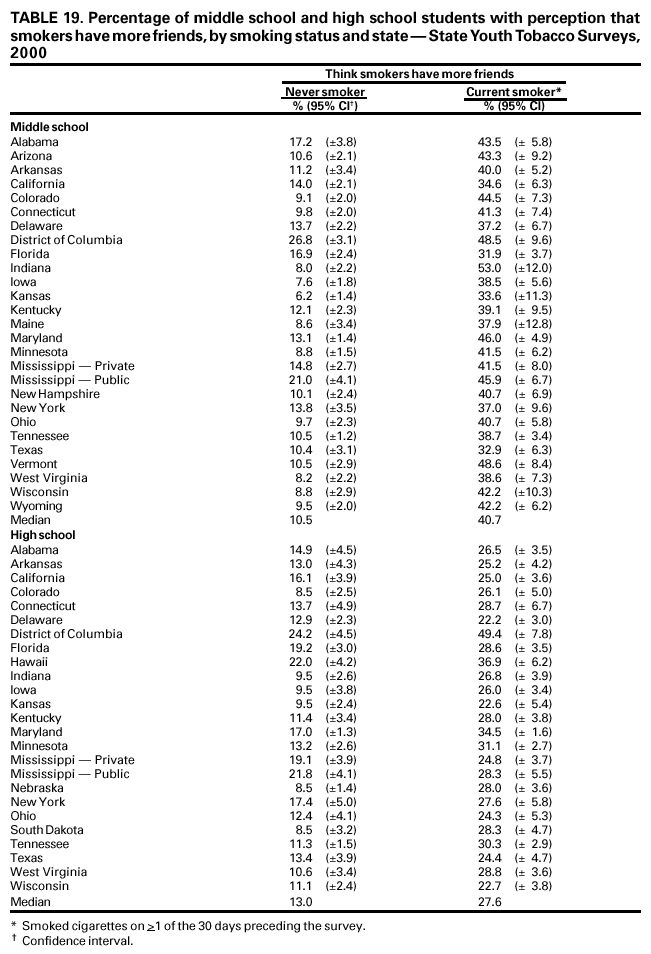 Return to top. Table 20 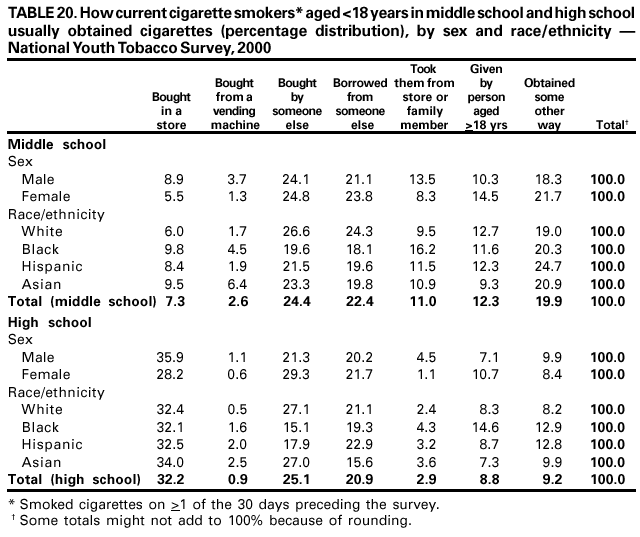 Return to top. Table 21 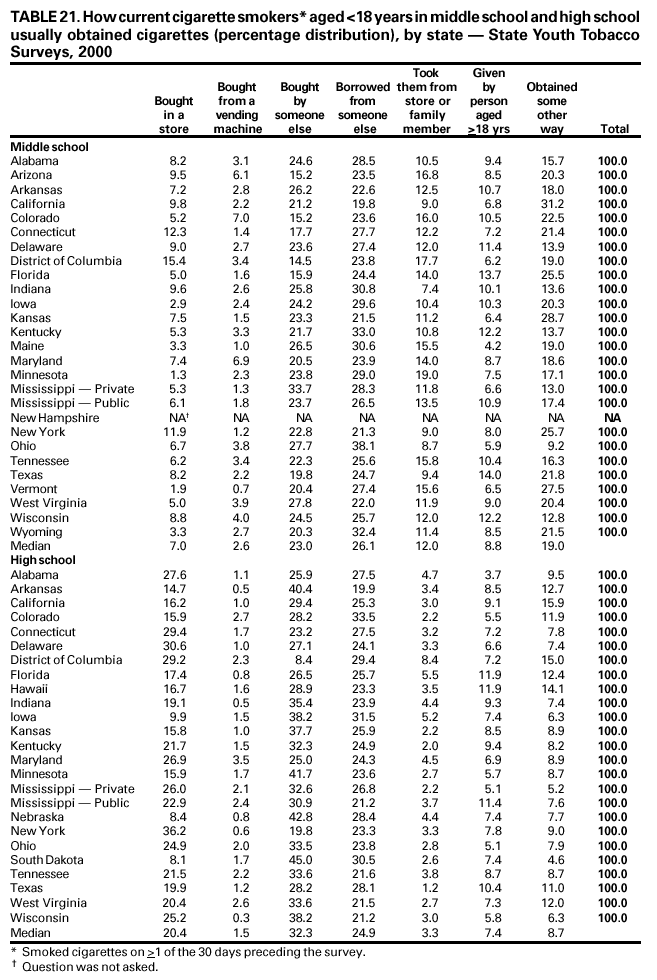 Return to top. Table 22 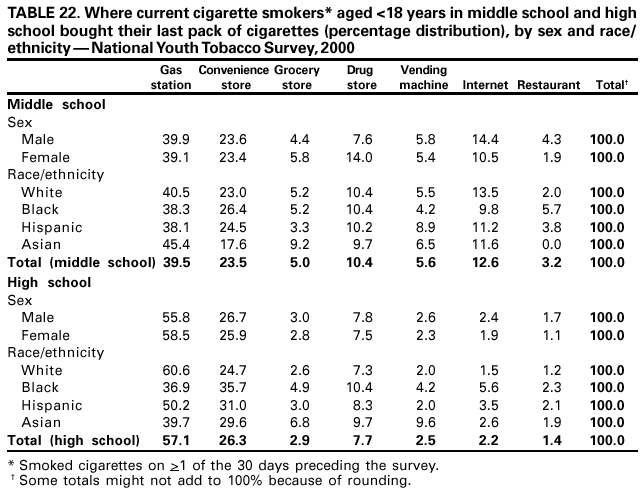 Return to top. Table 23 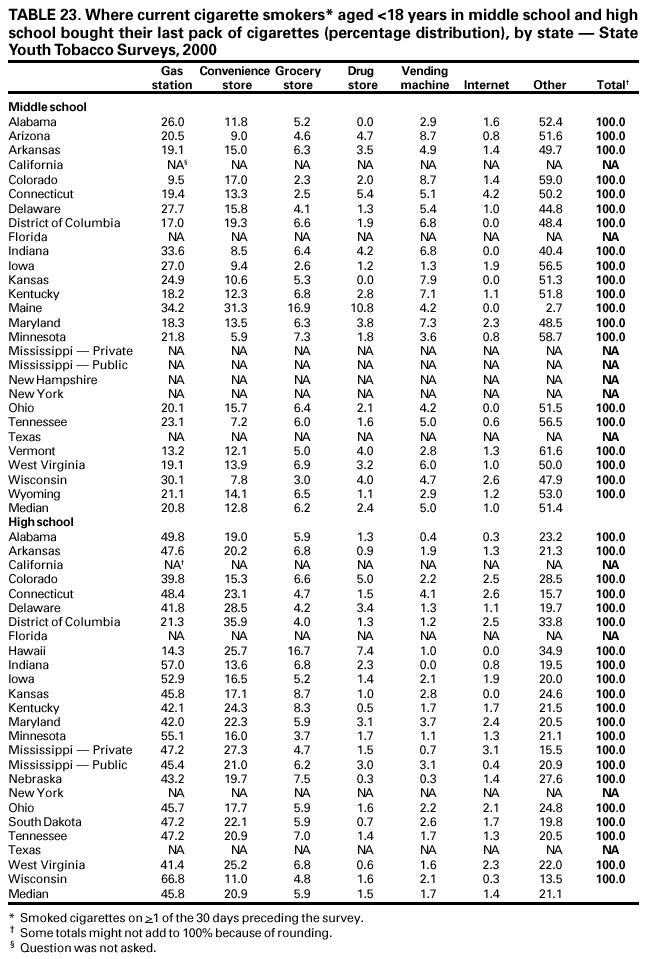 Return to top. Table 24 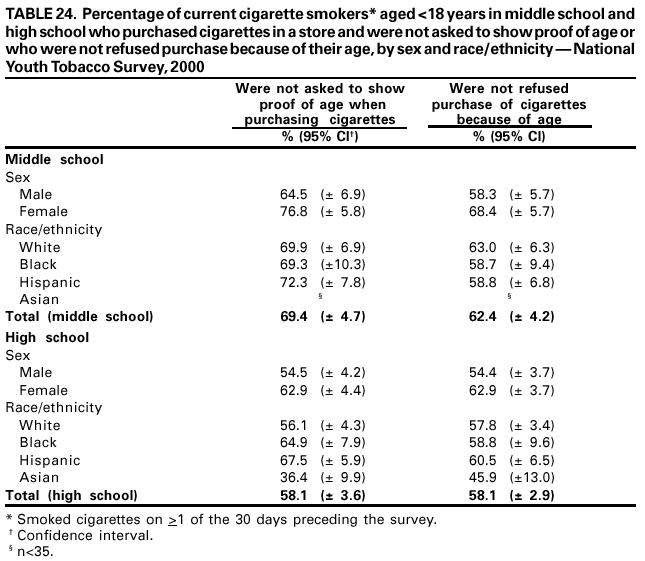 Return to top. Table 25 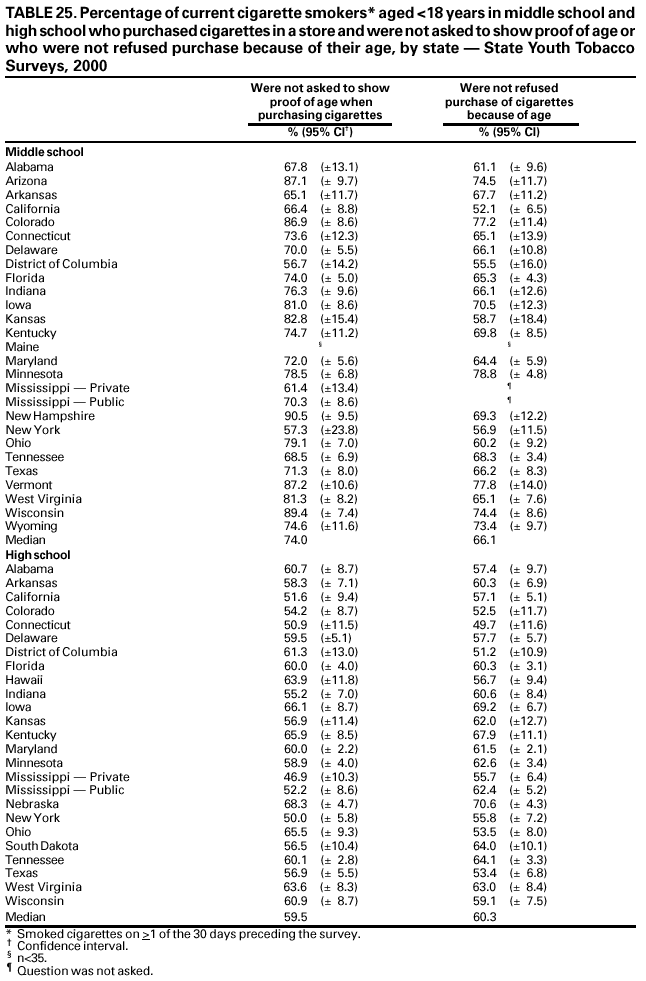 Return to top. Table 26 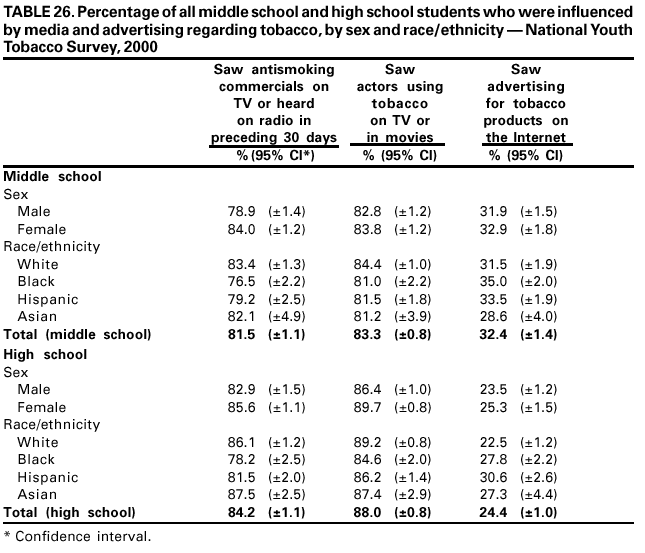 Return to top. Table 27 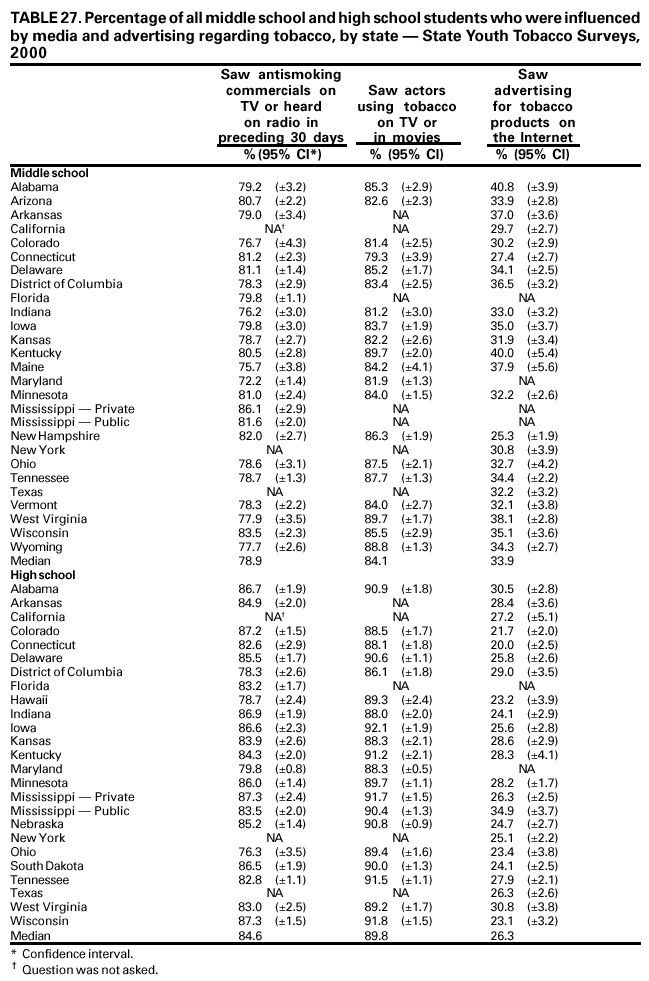 Return to top. Table 28 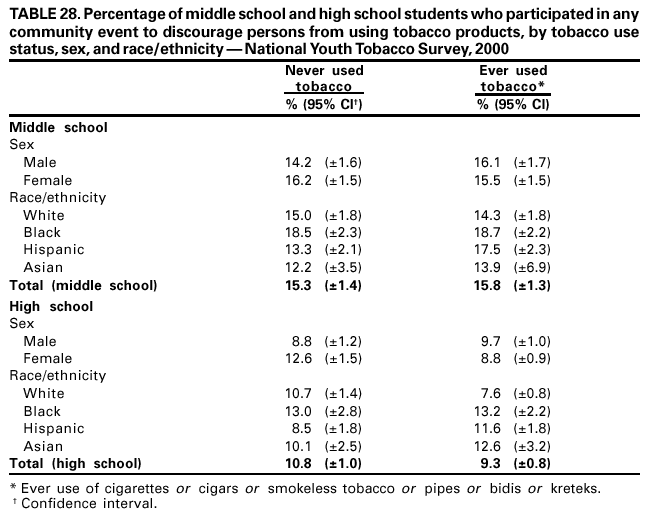 Return to top. Table 29 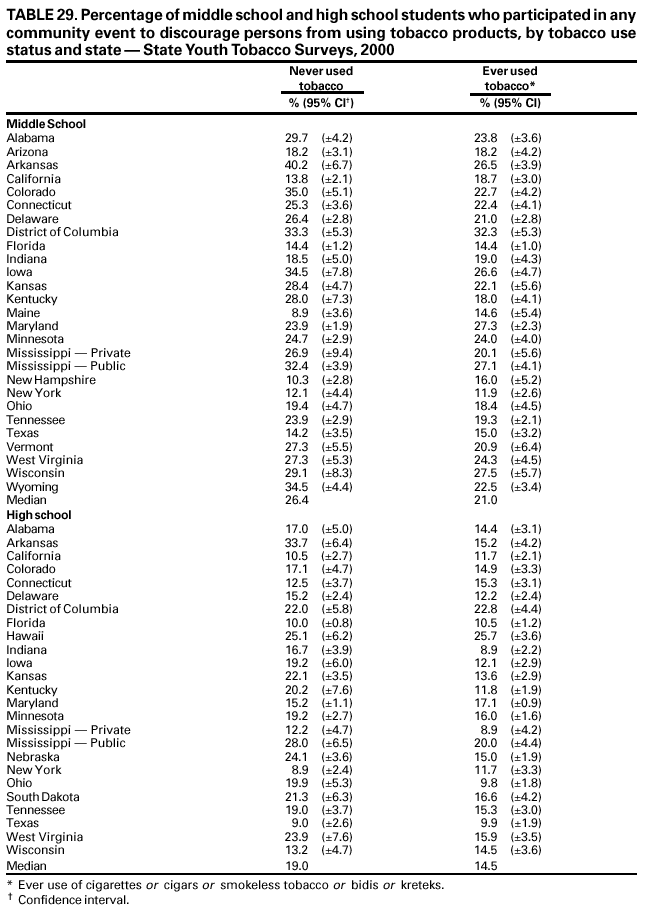 Return to top. Table 30 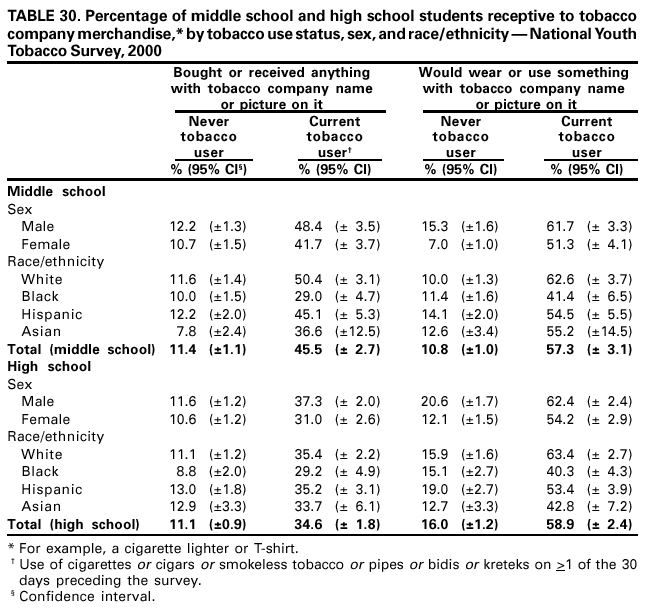 Return to top. Table 31 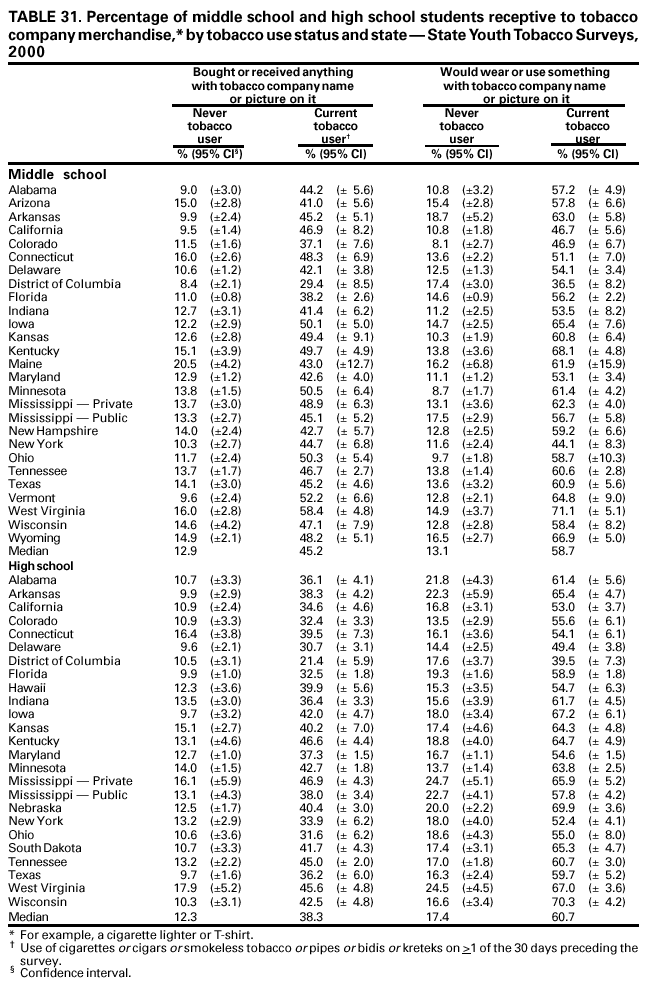 Return to top. Table 32 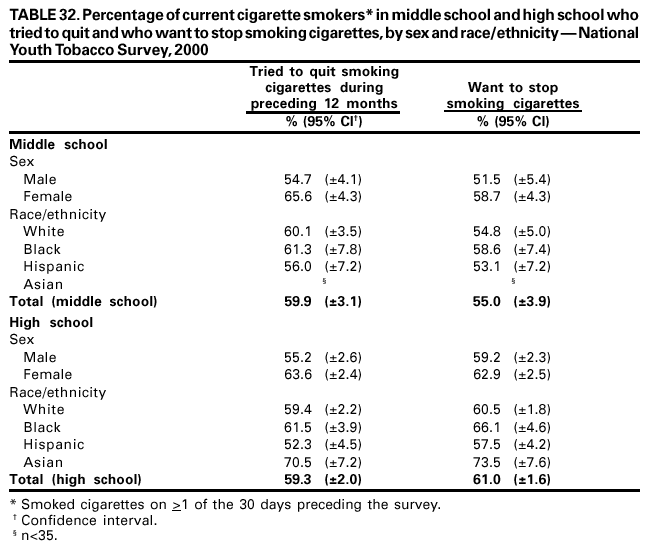 Return to top. Table 33 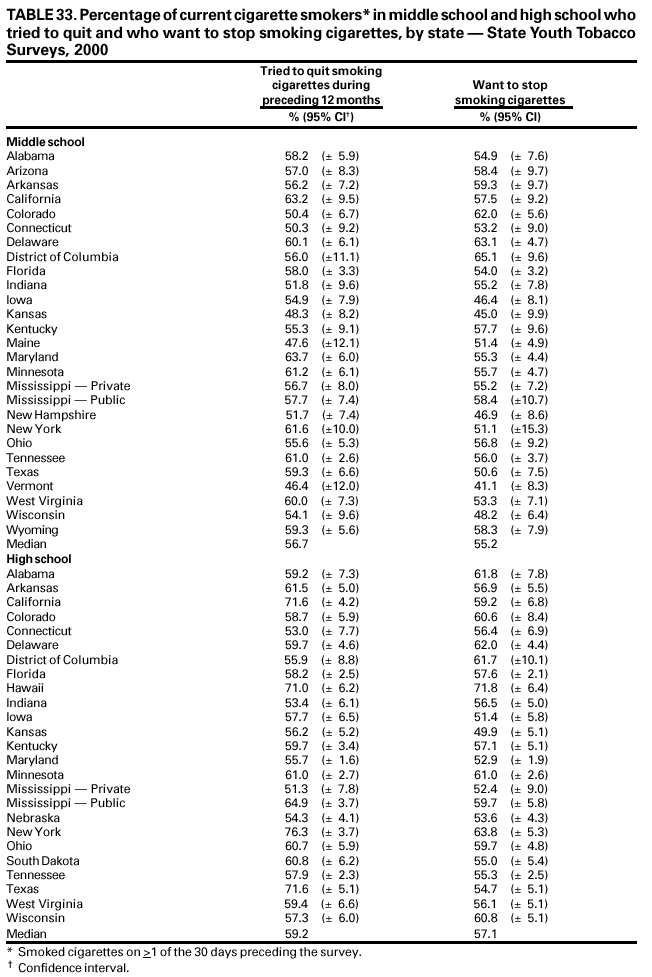 Return to top. Table 34 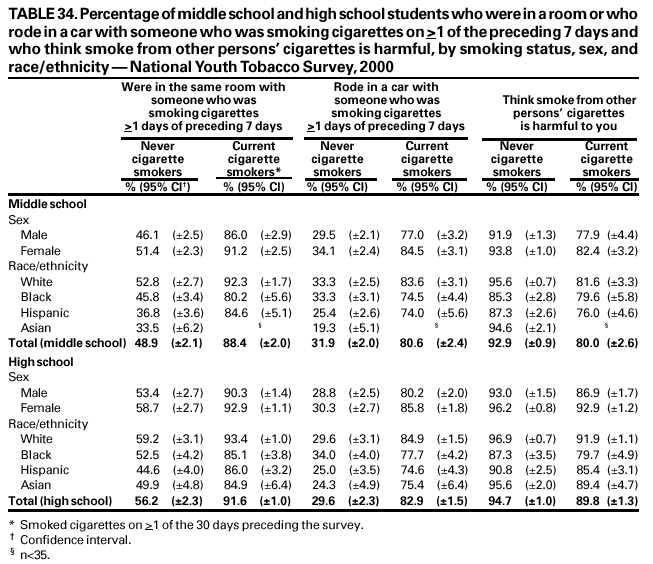 Return to top. Table 35 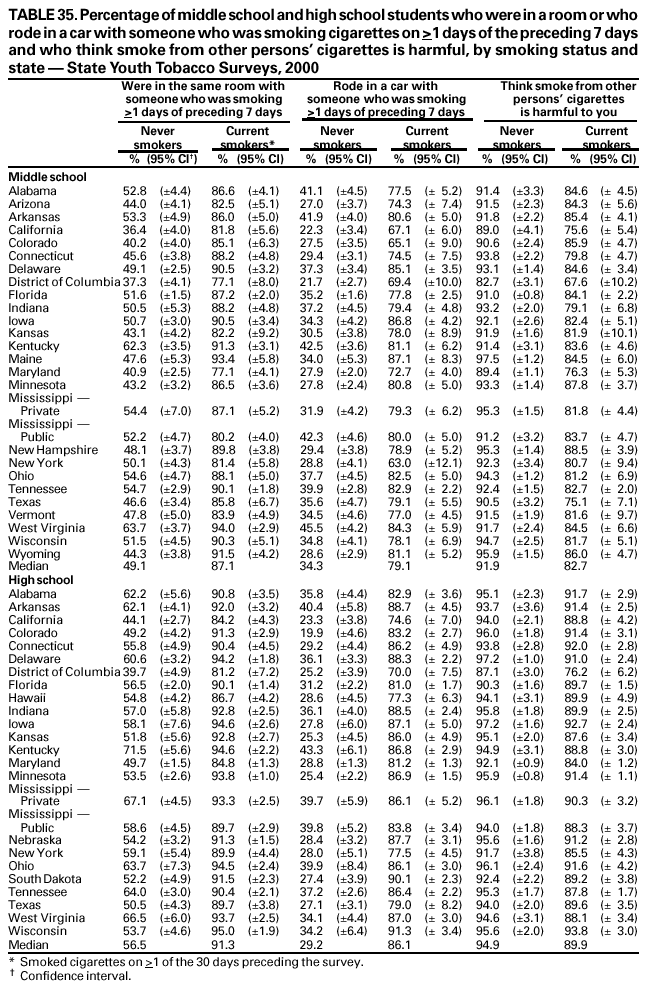 Return to top. Table 36 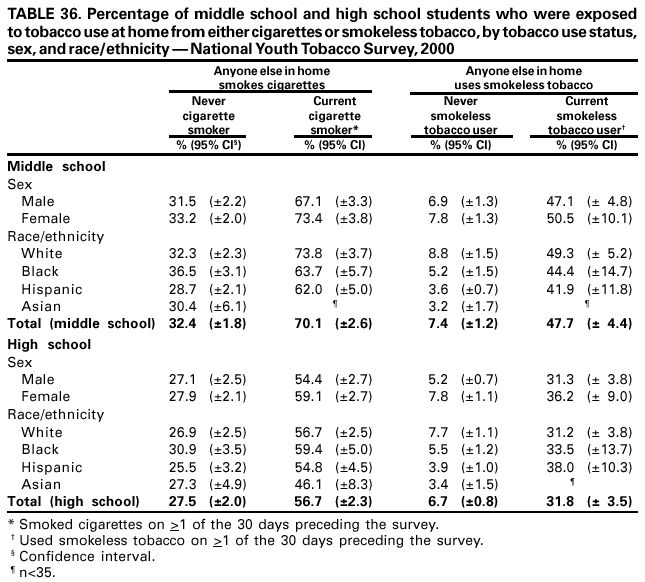 Return to top. Table 37 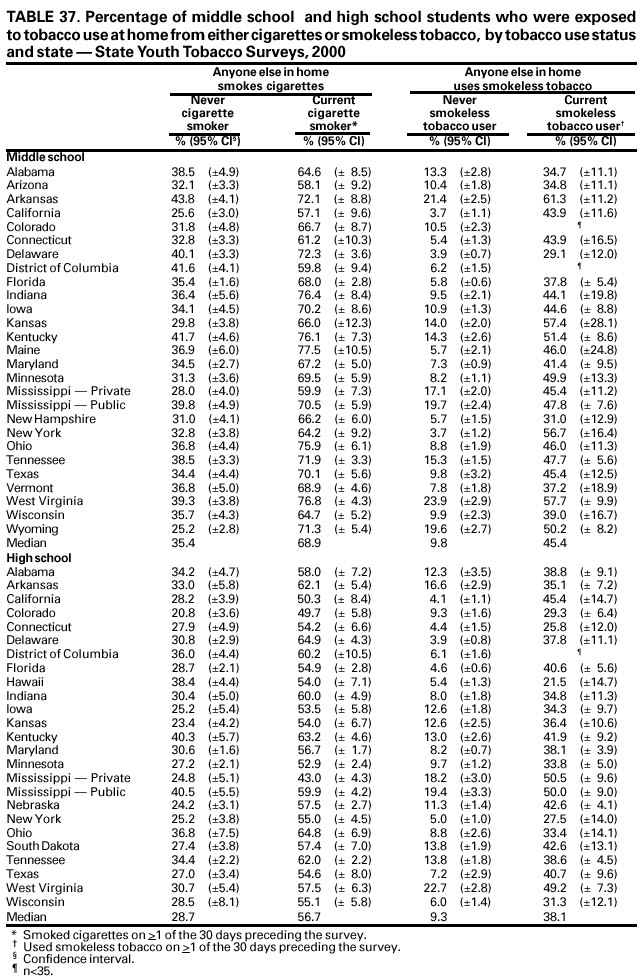 Return to top. Table 38 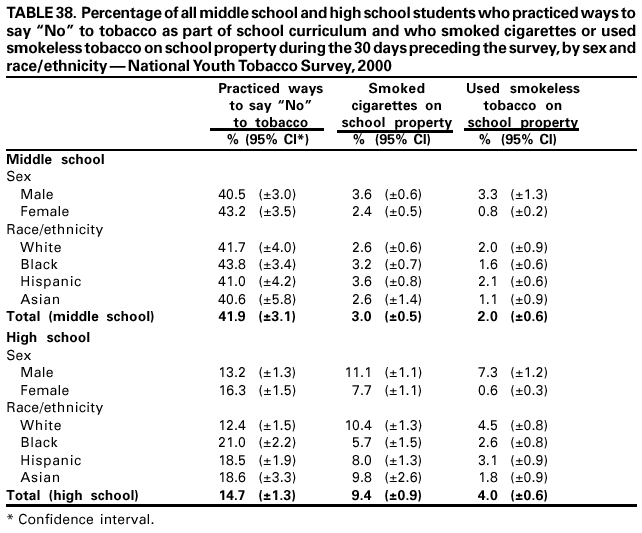 Return to top. Table 39 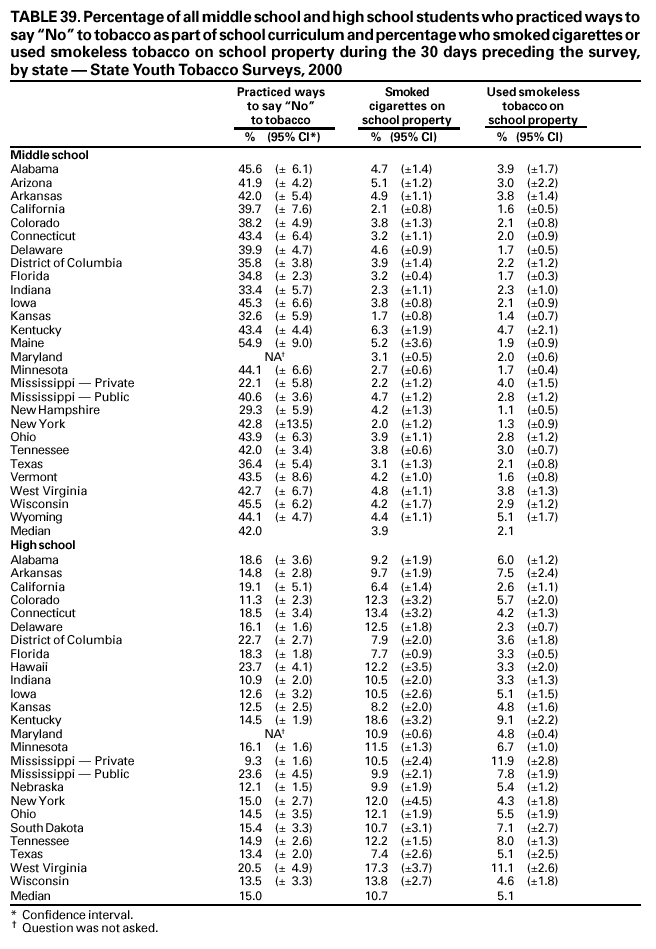 Return to top.
Disclaimer All MMWR HTML versions of articles are electronic conversions from ASCII text into HTML. This conversion may have resulted in character translation or format errors in the HTML version. Users should not rely on this HTML document, but are referred to the electronic PDF version and/or the original MMWR paper copy for the official text, figures, and tables. An original paper copy of this issue can be obtained from the Superintendent of Documents, U.S. Government Printing Office (GPO), Washington, DC 20402-9371; telephone: (202) 512-1800. Contact GPO for current prices. **Questions or messages regarding errors in formatting should be addressed to mmwrq@cdc.gov.Page converted: 11/2/2001 |
|||||||||
This page last reviewed 11/2/2001
|