Purpose
- This report summarizes illnesses reported to the Cholera and Other Vibrio Illness Surveillance System (COVIS) in 2024.
- Data include geographic distribution, demographic and clinical characteristics, routes of transmission, and more.
- Maps and charts in this report are interactive. Categories can be shown and hidden by clicking on the legend of each figure.
Surveillance summary
Infections
- 3,743 were cases of vibriosis. Vibriosis is defined as infection with pathogenic species of the family Vibrionaceae other than toxigenic Vibrio cholerae serogroups O1 and O139 (which are generally associated with epidemic or pandemic cholera).
- 1,459 were culture-confirmed cases.
- 2,239 were probable cases detected by a culture-independent diagnostic test (CIDT) and not culture-confirmed.
- 45 were probable cases linked epidemiologically to a laboratory-diagnosed case. Note: Epi-linked cases are not included in the analyses below.
- 12 were cholera cases. Cholera is defined as infection with toxigenic V. cholerae serogroup O1 or O139.
*Vibrio infections among California residents in 2024 have not been reported to COVIS. These findings are limited to cases reported to COVIS and therefore should be interpreted with caution. This report will be updated when new data becomes available.
Geographic distribution of cases
49 jurisdictions reported 3,698 vibriosis cases
- Atlantic Coast states reported 1,476 (40%)
- Non-coastal states reported 1,027 (28%)
- Gulf Coast states reported 996 (27%)
- Pacific Coast states reported 199 (5%)
44 jurisdictions reported 499 V. parahaemolyticus cases
- Atlantic Coast states reported 205 (41%)
- Non-coastal states reported 111 (22%)
- Gulf Coast states reported 101 (20%)
- Pacific Coast states reported 82 (16%)
29 jurisdictions reported 222 V. vulnificus cases
- Gulf Coast states reported 138 (62%)
- Atlantic Coast states reported 57 (26%)
- Non-coastal states reported 18 (8%)
- Pacific Coast states reported 9 (4%)
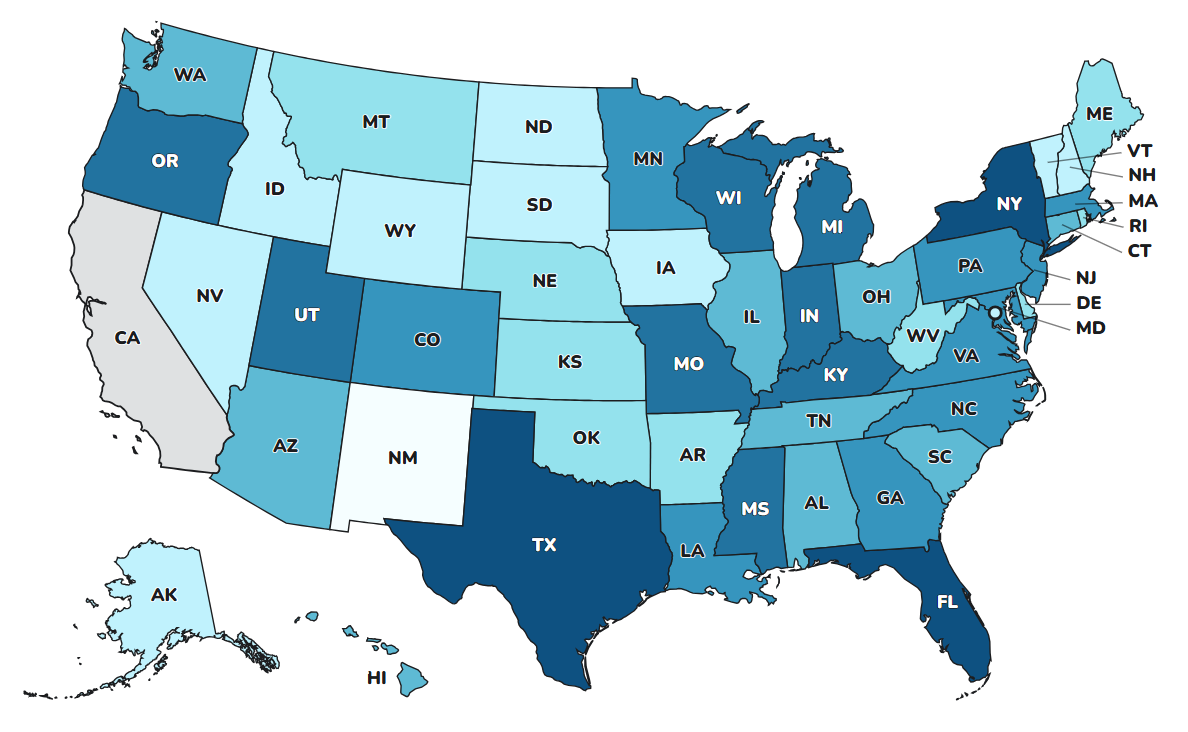
Figure 1
Jurisdictions that reported vibriosis cases to COVIS during 2024 are shown in this map. Use the dropdown to toggle between all cases, V. parahaemolyticus only, and V. vulnificus only.
Note: Vibriosis cases occurring in California in 2024 have not been reported to COVIS, resulting in underreporting in the Pacific Coast region compared to previous years.
*Jurisdictions include states and Washington, D.C. | Atlantic Coast jurisdictions: Connecticut, Delaware, Georgia, Massachusetts, Maryland, Maine, North Carolina, New Hampshire, New Jersey, New York, Rhode Island, South Carolina, Virginia, and Washington, D.C. | Gulf Coast jurisdictions: Alabama, Florida, Louisiana, Mississippi, and Texas. | Pacific Coast jurisdictions: Alaska, California, Hawaii, Oregon, and Washington. | Non-coastal jurisdictions: Arizona, Arkansas, Colorado, Idaho, Illinois, Indiana, Iowa, Kansas, Kentucky, Michigan, Minnesota, Missouri, Montana, Nebraska, Nevada, New Mexico, North Dakota, Ohio, Oklahoma, Pennsylvania, South Dakota, Tennessee, Utah, Vermont, West Virginia, Wisconsin, and Wyoming.
Vibriosis: N=3,698
V. parahaemolyticus: N=499; includes 27 probable cases reported by Florida (7), North Carolina (5), Alabama (2), Arkansas (2), Missouri (2), District of Columbia (1), Georgia (1), Illinois (1), Michigan (1), Mississippi (1), New Jersey (1), Nevada (1), South Carolina (1), and West Virginia (1).
V. vulnificus: N=222; Includes 2 probable cases reported by Florida (1) and Tennessee (1).
Demographic and clinical characteristics
- Among culture-confirmed infections, the most frequently reported species was V. parahaemolyticus (472 cases, 36%).
- The median age of patients was 56 years (range <1–98 years).
- 1,911 patients (52%) were male.
- 1,050 (32%) hospitalizations and 73 (2%) deaths were reported.
Table 1
| Demographic Characteristics | Clinical Outcomes | ||||||||
|---|---|---|---|---|---|---|---|---|---|
| Genus and Species | Cases | Age (years) | Sex | Hospitalizations | Deaths | ||||
| N | Median | Range | Male (n/N) | % | n/N | % | n/N | % | |
| Confirmed cases | 1,459 | 54.5 | <1–97 | 928/1,436 | 65 | 478/1,277 | 37 | 55/1,355 | 4 |
| V. parahaemolyticus | 472 | 51 | 3–92 | 295/463 | 64 | 88/419 | 21 | 4/434 | 1 |
| V. alginolyticus | 249 | 36 | 1–90 | 156/246 | 63 | 23/180 | 13 | 1/230 | 0 |
| V. vulnificus | 220 | 68 | 4–97 | 178/215 | 83 | 184/208 | 88 | 39/211 | 18 |
| V. cholerae (excluding toxigenic O1 and O139)† | 156 | 53.5 | <1–95 | 100/155 | 65 | 54/145 | 37 | 5/149 | 3 |
| V. fluvialis | 123 | 60 | 7–90 | 62/120 | 52 | 47/113 | 42 | 2/114 | 2 |
| V. mimicus | 47 | 56.5 | 11–94 | 31/47 | 66 | 11/44 | 25 | 0/40 | 0 |
| G. hollisae | 8 | 32 | 22–69 | 6/8 | 75 | 3/7 | 43 | 0/7 | 0 |
| V. furnissii | 6 | 60.5 | 34–84 | 5/6 | 83 | 3/6 | 50 | 0/6 | 0 |
| P. damselae | 4 | 59.5 | 4–78 | 3/4 | 75 | 0/3 | 0 | 0/3 | 0 |
| V. harveyi | 4 | 55 | 49–91 | 3/4 | 75 | 1/3 | 33 | 0/3 | 0 |
| V. cincinnatiensis | 3 | 81 | 68–89 | 1/3 | 33 | 2/2 | 100 | 0/2 | 0 |
| V. metschnikovii | 3 | 74 | 59–85 | 2/3 | 67 | 3/3 | 100 | 0/3 | 0 |
| Multiple Species | 56 | 54 | 1–95 | 34/56 | 61 | 20/42 | 48 | 3/53 | 6 |
| Species not identified | 108 | 58 | <1–95 | 52/106 | 49 | 39/101 | 39 | 1/99 | 1 |
| Probable cases†† | 2,239 | 57 | <1–98 | 983/2,224 | 44 | 572/2,001 | 29 | 18/2,095 | 1 |
| V. cholerae (serogroup not specified) | 351 | 59 | <1–97 | 139/347 | 40 | 110/324 | 34 | 6/338 | 2 |
| V. parahaemolyticus | 27 | 49.5 | 11–91 | 11/27 | 41 | 4/19 | 21 | 0/25 | 0 |
| V. vulnificus | 2 | 33.5 | 17–50 | 1/2 | 50 | 0/1 | 0 | 0/2 | 0 |
| Species not identified | 1,859 | 56 | 0–98 | 832/1,848 | 45 | 458/1,657 | 28 | 12/1,730 | 1 |
| Total | 3,698 | 56 | <1–98 | 1,911/3,660 | 52 | 1,050/3,278 | 32 | 73/3,450 | 2 |
*Proportions of demographic characteristics and clinical outcomes are based on total cases with known information, by genus and species.
†Includes non-toxigenic V. cholerae non-O1, non-O139 (75); serogroup not specified (37); non-O1 (33); O1 (4); O141 (3); O139 (2); and O75 (2).
††Species are summarized according to how they were reported to COVIS. Multiplex polymerase chain reaction (PCR) panels used to identify the vast majority of probable vibriosis cases are not known to provide species-level results; such cases are considered "Species not identified." However, some brands or laboratory-developed "in-house" PCR tests that are designed to provide species-level results have been reported to COVIS and are therefore included in this table.
Routes of transmission
Transmission routes are classified based on exposure categories (seafood consumption and marine/estuarine contact) and the type(s) of clinical specimen from which the Vibrio bacteria was isolated.
The proportion of domestically acquired cases with each transmission route and species are shown in Figure 2. The frequency of domestically acquired cases by transmission route and month are shown in Figure 3. Domestically acquired cases are defined as those who reported no international travel or whose travel status is unknown or not reported.
- Among 3,345 cases of vibriosis with known travel information, 409 (12%) reported international travel in the 7 days before illness began.
- Of 3,289 domestically acquired vibriosis cases:
- 2,548 (77%) were classified as foodborne or likely foodborne transmission.
- 559 (17%) were classified as non-foodborne or likely non-foodborne transmission.
- 182 (6%) were classified as unknown transmission.
Figure 2
All vibriosis cases: N=3,289; includes all vibriosis cases, culture-confirmed and CIDT-positive only, reported to COVIS.
Only confirmed cases: N=1,290; limited to vibriosis cases reported to COVIS that were culture-confirmed.
Only probable cases: N=1,999; limited to vibriosis cases reported to COVIS that were CIDT-positive but not culture-confirmed.
Figure 3
*Month is based on the date of earliest specimen collection. When unavailable, illness onset date, most recent exposure date (seafood/water), or patient interview date are used as proxies.
All vibriosis cases: N=8,323; includes all vibriosis cases, culture-confirmed and CIDT-positive only, reported to COVIS.
Only confirmed cases: N=3,681; limited to vibriosis cases reported to COVIS that were culture-confirmed.
Only probable cases: N=4,642; limited to vibriosis cases reported to COVIS that were CIDT-positive but not culture-confirmed.
Seafood, marine, and estuarine exposure
Seafood exposures among domestically acquired vibriosis cases are shown in Tables 2a–2c.
- Among patients with domestically acquired vibriosis who reported eating seafood (N=1,385):
- 603 (44%) ate oysters, 596 (43%) ate shrimp, and 538 (39%) ate fish.
- Among 745 patients who reported eating a single seafood item, 287 (36%) ate oysters, 231 (87%) of whom ate them raw.
- Among patients with domestically acquired vibriosis who reported a marine or estuarine exposure (N=746):
- 622 (83%) reported having skin exposure to a body of water within 7 days before illness onset.
- 239 (32%) reported contact with drippings from raw or live seafood.
- 76 (10%) reported contact with marine life.
Table 2a
| Mollusks | Crustaceans | Other | ||||||||
|---|---|---|---|---|---|---|---|---|---|---|
| Oysters | Clams | Scallops | Mussels | Shrimp | Crab | Crayfish | Lobster | Finfish | Other Shellfish | |
| Patients who ate single seafood item, n (%) | 287 (36) | 24 (3) | 6 (1) | 5 (1) | 183 (25) | 51 (7) | 12 (2) | 10 (1) | 180 (24) | 7 (1) |
| Patients who ate the single seafood item raw, n (% of n in row above) | 231 (87) | 14 (58) | 1 (17) | 1 (20) | 9 (5) | 13 (25) | 2 (17) | 0 (0) | 34 (19) | 1 (14) |
*Includes all vibriosis cases, culture-confirmed and CIDT-positive only, reported to COVIS.
Table 2b
| Mollusks | Crustaceans | Other | ||||||||
|---|---|---|---|---|---|---|---|---|---|---|
| Oysters | Clams | Scallops | Mussels | Shrimp | Crab | Crayfish | Lobster | Finfish | Other Shellfish | |
| Patients who ate single seafood item, n (%) | 157 (52) | 14 (5) | 2 (1) | 1 (<1) | 40 (13) | 26 (9) | 5 (2) | 3 (1) | 53 (18) | 1 (<1) |
| Patients who ate the single seafood item raw, n (% of n in row above) | 132 (84) | 10 (71) | 0 (0) | 1 (100) | 2 (5) | 3 (12) | 2 (40) | 0 (0) | 14 (26) | 0 (0) |
*Limited to vibriosis cases reported to COVIS that were culture-confirmed.
Table 2c
| Mollusks | Crustaceans | Other | ||||||||
|---|---|---|---|---|---|---|---|---|---|---|
| Oysters | Clams | Scallops | Mussels | Shrimp | Crab | Crayfish | Lobster | Finfish | Other Shellfish | |
| Patients who ate single seafood item, n (%) | 110 (25) | 10 (2) | 4 (1) | 4 (1) | 143 (32) | 25 (6) | 7 (2) | 7 (2) | 127 (29) | 6 (1) |
| Patients who ate the single seafood item raw, n (% of n in row above) | 99 (90) | 4 (40) | 1 (25) | 0 (0) | 7 (5) | 10 (40) | 0 (0) | 0 (0) | 20 (16) | 1 (17) |
*Limited to vibriosis cases reported to COVIS that were CIDT-positive but not culture-confirmed.
National cholera surveillance
In 2024, 12 cholera cases were reported to COVIS. These cases are summarized in Table 3.
- All were toxigenic V. cholerae serogroup O1 infections, and all with known biotype were identified as El Tor.
- 9 (82%) patients were hospitalized, and none died. One patient was lost to follow up.
- Among 11 cases with travel information, 8 were international travel associated. Travel destinations include India (5), Ethiopia (1), Ghana (1), and Pakistan (1).
- Among 3 cases with no international travel, one resulted from suspected exposure to imported water, and two had unknown exposures.
Table 3
| Location | Age | Sex | Month of illness onset | International travel | Serogroup | Serotype |
|---|---|---|---|---|---|---|
| Illinois | 77 | M | January | Pakistan | O1 | Ogawa |
| Wisconsin | 50 | M | March | India | O1 | Ogawa |
| Illinois | 40 | F | March | India | O1 | Ogawa |
| Minnesota | 25 | F | March | Ethiopia | O1 | Ogawa |
| Colorado | 33 | M | April | India | O1 | Ogawa |
| Florida | 73 | M | April | No | O1 | Ogawa |
| Illinois | 28 | F | May | Unknown | O1 | Ogawa |
| Washington | 35 | M | May | India | O1 | Ogawa |
| Massachusetts | 75 | F | June | India | O1 | Ogawa |
| Virginia | 65 | M | July | No | O1 | Unknown |
| Texas | 57 | F | December | No | O1 | Ogawa |
| Illinois | 30 | M | December | Ghana | O1 | Unknown |