Using the National TB Indicators Project to Select a Focus Area for Program Evaluation
 Example-NTIP-indicator-summary
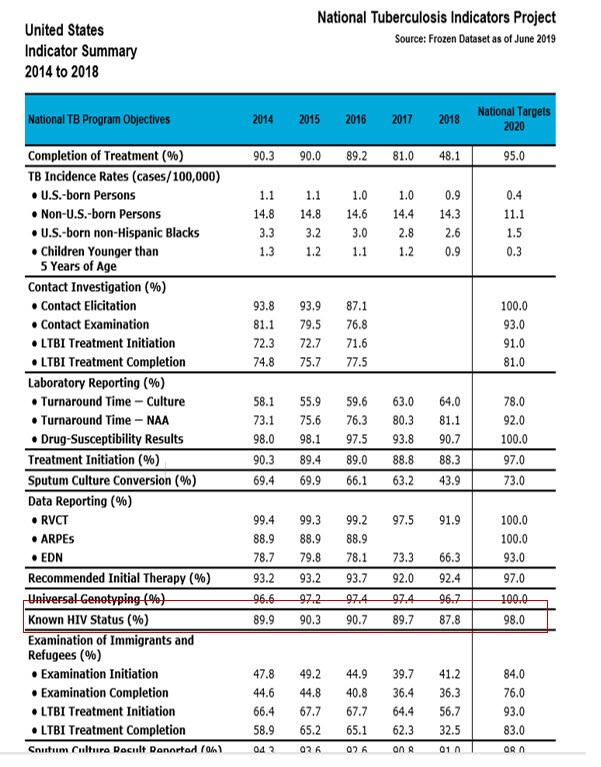
Performance on the Known HIV Status indicator has decreased during the previous 2 years and is less than the national performance target.
The indicator summary report (see example NTIP indicator summary) provides information about your jurisdiction’s progress in meeting each National Performance Target.
- Review the trends for your program indicators to determine if performance is improving, staying the same, or getting worse?
- After reviewing the example indicator summary report, if you find that performance on the Known HIV Status indicator has decreased during the previous 2 years and is less than the National Performance Target, you may decide to take a closer look at the Known HIV (human immunodeficiency virus) Status indicator.
Note: The examples provided here are based on the frozen 2019 dataset. However, these steps can also be done using the current dataset or other available datasets in NTIP.
 Example-NTIP-indicator-report
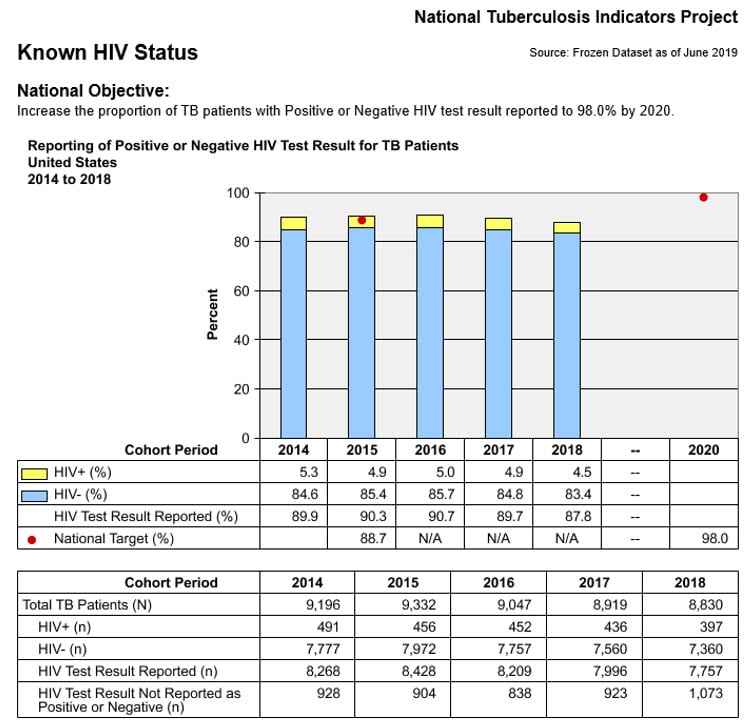
Cohort Period- (n) numbers (numerator and denominator) that are used to calculate the performance indicator (percentage of patients with known HIV status)
NTIP indicator reports (see example NTIP indicator report ) include Specific, Measurable, Achievable, Realistic, and Time-bound (SMART) objectives that directly relate to the National TB Program Objectives and 2020 Performance Targets.
- Using SMART objectives will help your evaluation plan succeed by giving you a sense of direction and helping you organize and reach your goals.
- The table beneath the graph in each NTIP indicator report tells you the number of cases that were used in the numerator and denominator for calculating the percentage associated with each indicator. For example, in the HIV Status indicator report,
 Example-NTIP-linelist
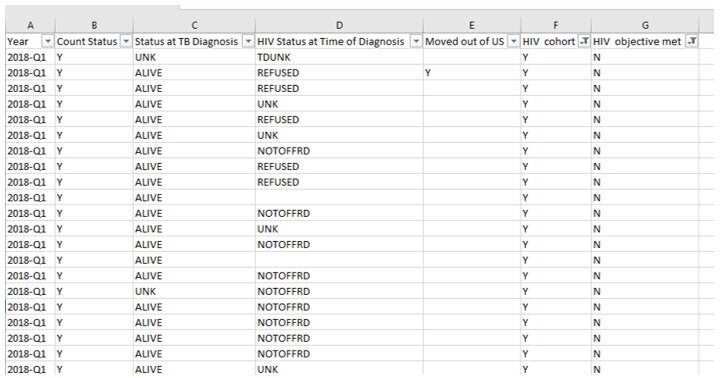
"D" column shows the HIV status for each patient which helps explain why the HIV objective was met or not.
"F"column shows which patients were in the eligible cohort for HIV status.
"G" column shows if the patient met the HIV objective.The NTIP line list (see example NTIP line list) tells you the cases and specific variables for each case that were used in the NTIP indicator report. With the NTIP line list you can
- Review which patients were part of the indicator cohort for your specific indicator of interest. (In this example, “HIV cohort” means patients who were eligible to have an HIV test.)
- Determine exactly why patients who were part of the eligible indicator cohort did not meet the objective.
- After reviewing the partial example line list, you see that 21 patients were in the eligible cohort for HIV status. Here are some concerns that suggest areas needing improvement:
- None of the 21 patients met the objective.
- 9 of those 21 (43%) patients were not offered an HIV test.
- Two blank cells indicate that information was not entered at all.
Note: Not all NTIP users have access to the NTIP line list feature. If you need access, please contact the NTIP coordinator in your jurisdiction or send an e-mail to DTBESupport@cdc.gov.
- The state and city report (see example state and city TB report graph) shows selected indicator performance across 50 states and 9 cities.
- How is your jurisdiction performing, compared with similarly sized jurisdictions?
- Using the state and city TB report, you could identify other similarly sized jurisdictions and consider contacting them to discuss their approaches to improving indicator performance.

- After reviewing the NTIP indicator summary data and NTIP report (Steps 1 and 2), you identified Known HIV Status as a potential evaluation focus area.
- By looking more closely at the details of the data using the NTIP line list (Step 3), you found that your jurisdiction probably did not meet this objective because some patients were recorded as not offered an HIV test.
- Who else should be made aware of these results? Get engagement and support from stakeholders.
- Your plan should include how you will determine the barriers to offering HIV testing.
- You should also review the patients’ medical record to make sure the HIV test results are the same as the HIV test results in the NTIP linelist. This is an opportunity to correct any data errors.
- By reviewing the state and city TB report (Step 4), you learned that other jurisdictions with a similar case count as yours were able to meet the 2020 National Performance Target for the Known HIV Status indicator.
- By focusing on this area for evaluation, your program evaluator can develop an evaluation plan for understanding why results for some patients indicate that they are not offered HIV tests, but others are. Findings from this evaluation can be used to develop a remediation or action plan for modifying protocols or developing interventions, or for other follow-up activities that can improve your program performance.
Indicator – measures developed to assess progress toward the National TB Program Objectives
Indicator Cohort – the total number of patients who are eligible to meet the performance objective for an indicator
NTIP (National TB Indicators Project) – a web-based performance-monitoring tool that tracks your jurisdiction’s progress toward national TB program objectives
National TB Program Objective – the long-term expectation for TB program outcomes
National TB Performance Target – the quantitative goal for TB program outcomes
SMART Objective (Specific, Measurable, Achievable, Relevant, Time-bound) – statements that describe the results you want to achieve and how you will achieve them