How Data Quality Filters Work

As participation in the National Syndromic Surveillance Program (NSSP) expands and more healthcare facilities are onboarded, the availability of data will naturally increase. Over time, the abundance of new data can affect interpretation of surveillance trends. That’s where data quality filters can help. Data filtering can control for which facilities are included in the analyses.
Data quality (DQ) filters help users control for variation in data availability and in the quality of information when grouping visits into surveillance categories at the facility level over a defined period. By using DQ filters in a query, users can ensure that the analysis only pulls data from facilities that consistently reported visits and met cut-points for visits containing informative chief complaint (CC) and discharge diagnosis (DD). The information that follows will help NSSP users understand how filtering works so they can exercise more control during analyses.
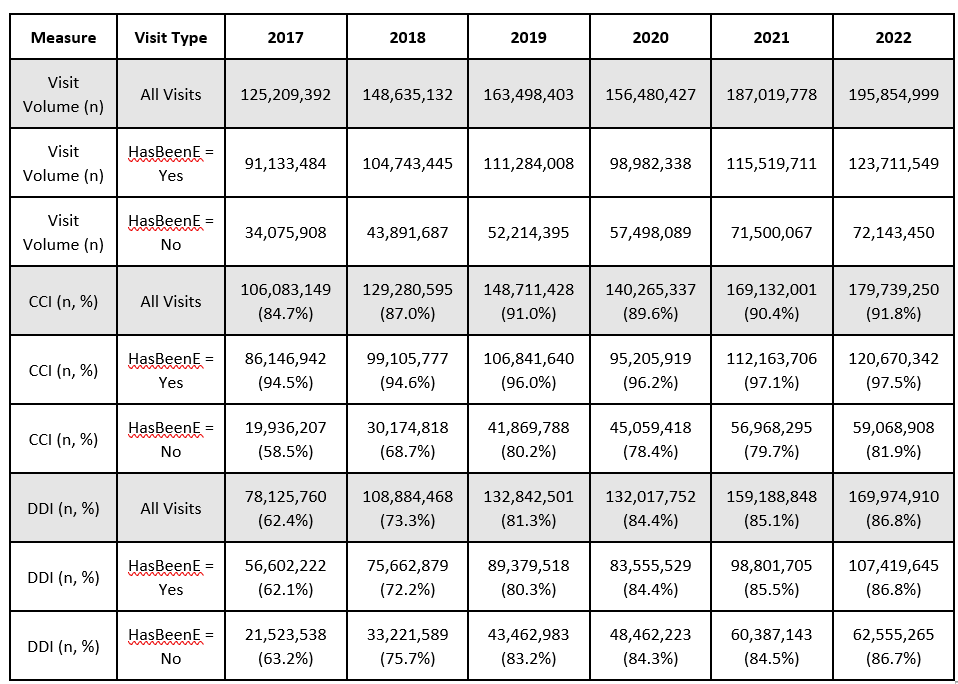
If we compare data from 2017 (the earliest year data quality filters are available) through 2022, emergency department (ED) coverage has soared:
- 5,678 facilities reported at least one visit in 2022—a 72.6% increase in facilities compared to 2017.
- Looking across all visit types (i.e., emergency departments, urgent cares), patient visits have increased 56.4% (8.4% increase in the percent of visits with an informative chief complaint field; 39.1% increase in the percent of visits with an informative discharge diagnosis field).
- Among ED visits only (HasBeenE=Yes), patient visits have increased 35.7% (3.2% increase in the percent of visits with an informative chief complaint field; 39.8% increase in the percent of visits with an informative discharge diagnosis field).
- Among non-ED visits (HasBeenE=No), patient visits have increased 111.7% (40.0% increase in the percent of visits with an informative chief complaint field; 37.2% increase in the percent of visits with an informative discharge diagnosis field).
Increases in the number of facilities that report data lead to increases in patient visit volumes captured by the platform, increases in the proportion of patient visits with an informative CC field, and increases in the proportion of patient visits with an informative DD field. As a result, more high-quality data are available to analyze in 2022 compared with 2017. Table 1 shows the yearly visit volume and the count and percent of visits with an informative CC or DD code. Note the increases in available data across years. Such differences can affect how users interpret routine surveillance results when they’re evaluating longitudinal trends or conducting year-over-year case-finding activities.


NSSP provides four DQ filters to help users exercise more control for variation in data availability and quality over a defined period: coefficient of variation (CoV), coefficient of variation of emergency department visits (CoV[HasBeenE]), average weekly chief complaint informative (CCI Avg Weekly Percent), and average weekly discharge diagnosis informative (DDI Avg Weekly Percent). It’s helpful to know which data are included in each calculation (see Table 2):
- CoV and CoV(HasBeenE) are calculated by calendar year. Each filter begins on January 1 of the initial year and goes through the current year.
- CCI Avg Weekly and DDI Avg Weekly filters are calculated by Morbidity and Mortality Weekly Report (MMWR) calendar year. These filters begin on the first day of the first MMWR week of the start year and go through the current year.


Calculations
Calculations for each of the four DQ filters are described in detail below:
Filter 1: Coefficient of Variation (CoV) and
Filter 2: Coefficient of Variation of Emergency Department Visits (CoV[HasBeenE])
These two filters—CoV and CoV(HasBeenE)—are measures of total volume volatility over time. CoV includes emergency and non-emergency visits (HasBeenE=0 and HasBeenE=1), and CoV(HasBeenE) only includes ED visits (HasBeenE=1) in the calculation.
CoV is calculated by dividing the standard deviation of weekly visits by the mean weekly visit volume multiplied by 100 (see calculation below). Lower values of CoV correspond to less variation in the total visit volume, whereas higher values correspond to more variation. Explanations for high CoV values include a facility onboarding or a data feed drop during the period. NSSP recommends CoV values less than or equal to 45 for long-term comparison analyses. Both CoV filters have a 7-day lag in data and will return a NULL value for current year calculations until after January 7th. Data are grouped by MMWR week, and partial weeks are included in the calculation if the calendar year does not begin the first day of an MMWR week or if the current MMWR week is not complete.

Filter 3: Average Weekly Chief Complaint Informative (CCI Avg Weekly Percent) and
Filter 4: Average Weekly Discharge Diagnosis Informative (DDI Avg Weekly Percent)
These filters control for the availability and quality of data in the CC and DD fields. Both filters are calculated as the weekly average percent of all visits (ED and non-ED) with an informative CC or DD field, respectively (see calculations below). Both filters range from 0% to 100%; lower values correspond to fewer visits with informative fields, and higher values correspond to more visits with informative CC or DD fields.
NSSP recommends a DDI Avg Weekly Percent greater than or equal to 70% and does not currently have a recommendation for a CCI Avg Weekly Percent threshold. Both DQ filters have a two MMWR week data lag and will return a NULL value for current year calculations until after MMWR Week 2. Only full MMWR weeks of data are included in these calculations.

How to Access the Data Quality Filters
ESSENCE Query Portal
Users can access DQ filters for the Patient Location and Facility Location datasets via the ESSENCE and ESSENCE 2 query portals. Users may select the filter duration of interest and the filter direction (less than, less than or equal to, equal to, greater than or equal to, and greater than).
These terms are measures of how informative the chief complaint (CC) and discharge diagnosis (DD) fields are over time.
Non-informative text in the CC and DD fields are: ‘““’ , ‘null’ , ‘unknown’ , ‘unk’ , ‘n/a’ , ‘na’ , ‘Chief complaint not present’ , ‘ed visit’ , ‘ed’ , ‘er’ , ‘Advice only’ , ‘Other’ , ‘xxx’ , ‘Evaluation’ , ‘Follow up’ , ‘medical’ , ‘illness’ , ‘General’ , ‘General symptom’ , ‘EMS’ , ‘AMR’ , ‘Medic’ , ‘Ambulance’ , ‘EMS/Arrived by’ , ‘EMS/Ambulance’ , ‘;’ , ‘;;’ , ‘Triage’ , ‘Triage peds’ , ‘Triage-’ , ‘Triage peds-’ , ‘See chief complaint quote’ , ‘See CC quote’ , ‘Sick’ , ‘Injury’ , ‘ill’ , ‘Eval’ , ‘squad’ , ‘Referral’ , ‘Code 1’ , ‘Code 3’.
The results can differ even when applying the same DQ filter thresholds to the Patient Location and Facility Location. Adding DQ filters to a Facility Location query will return all visits from facilities in the selected geographic region that meet the DQ thresholds. Adding DQ filters to a Patient Location query will return visits from patients in the selected geographic region who attended facilities that meet the DQ threshold for visits.
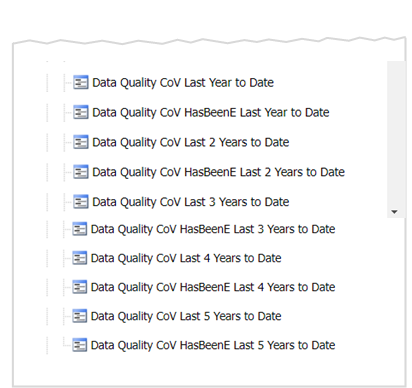
The filters can be accessed via the following path: ESSENCE > Query Portal > Available Query Fields > Data Quality Filters folder (Figure 1).


Facility-level Data Quality Filter Table
Facility-level filters are available in the COV Weekly Average DQ table, located under the Data Quality tab in ESSENCE and ESSENCE 2 (Figure 2). Users can select their site and the facilities they are interested in, and the table will return the CoV, CoV(HasBeenE), CCI Avg Weekly Percent, DDI Avg Weekly Percent, and last date the calculation was updated for each facility (Figure 3). This table can be downloaded and saved to a .csv file.


Rnssp Template
The inclusion of facilities and visits for combinations of CoV(HasBeenE) and DDI Avg Weekly Percent can be explored with the Data Quality Matrix template in R. Access this template via the Rnssp package. Additional information specific to the Data Quality Filter Matrix Template is available in the Rnssp Templates Documentation.
