Estimating the Future Number of Cases in the Ebola Epidemic — Liberia and Sierra Leone, 2014–2015
Corresponding author: Martin I. Meltzer, National Center for Emerging and Zoonotic Infectious Diseases, CDC. E-mail: qzm4@cdc.gov; Telephone: 404-639-7778.
Abstract
The first cases of the current West African epidemic of Ebola virus disease (hereafter referred to as Ebola) were reported on March 22, 2014, with a report of 49 cases in Guinea. By August 31, 2014, a total of 3,685 probable, confirmed, and suspected cases in West Africa had been reported. To aid in planning for additional disease-control efforts, CDC constructed a modeling tool called EbolaResponse to provide estimates of the potential number of future cases. If trends continue without scale-up of effective interventions, by September 30, 2014, Sierra Leone and Liberia will have a total of approximately 8,000 Ebola cases. A potential underreporting correction factor of 2.5 also was calculated. Using this correction factor, the model estimates that approximately 21,000 total cases will have occurred in Liberia and Sierra Leone by September 30, 2014. Reported cases in Liberia are doubling every 15–20 days, and those in Sierra Leone are doubling every 30–40 days. The EbolaResponse modeling tool also was used to estimate how control and prevention interventions can slow and eventually stop the epidemic. In a hypothetical scenario, the epidemic begins to decrease and eventually end if approximately 70% of persons with Ebola are in medical care facilities or Ebola treatment units (ETUs) or, when these settings are at capacity, in a non-ETU setting such that there is a reduced risk for disease transmission (including safe burial when needed). In another hypothetical scenario, every 30-day delay in increasing the percentage of patients in ETUs to 70% was associated with an approximate tripling in the number of daily cases that occur at the peak of the epidemic (however, the epidemic still eventually ends). Officials have developed a plan to rapidly increase ETU capacities and also are developing innovative methods that can be quickly scaled up to isolate patients in non-ETU settings in a way that can help disrupt Ebola transmission in communities. The U.S. government and international organizations recently announced commitments to support these measures. As these measures are rapidly implemented and sustained, the higher projections presented in this report become very unlikely.
Introduction
The first cases of the current West African epidemic of Ebola virus disease (hereafter referred to as Ebola) were reported on March 22, 2014, with a report of 49 cases in Guinea (1).*,† By August 31, 2014, the World Health Organization had reported 3,685 probable, confirmed, and suspected cases in West Africa, with 2,914 in Sierra Leone and Liberia and 771 in Guinea (2). To aid in planning for additional disease-control efforts, a modeling tool called EbolaResponse was constructed to provide estimates of the potential number of future cases.
Methods
CDC constructed the EbolaResponse modeling tool in a spreadsheet (available at http://dx.doi.org/10.15620/cdc.24900) using Microsoft Excel 2010 and used the model to estimate the increase in Ebola cases in Liberia and Sierra Leone (see Appendix for additional results and technical notes). Similar to previous Ebola models (3,4), EbolaResponse tracks patients through the following states of Ebola-related infection and disease: susceptible to disease, infected, incubating, infectious, and recovered. The infectious state also includes persons who die but whose burial provides risk for onward transmission. The risk associated with unsafe burial is part of the total daily risk for transmission for the patients at home without effective isolation (Appendix [Table 1]). All infected persons were assumed to eventually become symptomatic. Data from reports of previous Ebola outbreaks were used to model the daily change of patients' status between the disease states. For example, a probability distribution to characterize the likelihood of incubating a given number of days was built using previously published data (4). The resulting distribution has a mean incubation period of approximately 6 days and a 99th percentile of 21 days (Appendix [Figure 4]). Based on previous studies, patients were assumed to be infectious for a period of 6 days (3,5).
Patients were categorized into three levels: 1) hospitalized in an Ebola treatment unit (ETU) or medical care facility, 2) home or in a community setting such that there is a reduced risk for disease transmission (including safe burial when needed), and 3) home with no effective isolation (Appendix [Figure 5]). Hospitalized refers to facilities such as ETUs where medical care is provided. Ideally, such facilities have infection-control protocols that prevent additional disease transmission. However, this is not always the case. Therefore, the average daily risk for transmission is greater than zero in these facilities (i.e., transmission does occur), but the risk is fewer than one person infected per infectious patient (Appendix [Table 1]).
The risk for onward disease transmission by patient category was calculated (Appendix [Table 1]). The ability to add imported cases (whole numbers) every 10 days (approximately the sum of the average incubation and infectiousness periods) was built into the EbolaResponse modeling tool (Appendix [Table 2]). Imported cases represent either cases in persons who travel into the community undetected from other outbreak-affected areas or persons who might represent previously undetected chains of transmission. To estimate the daily number of beds in use (i.e., beds in medical care facilities, such as ETUs), previously published data were adapted to provide both the likelihood of a patient going to an ETU and the number of days that a patient in each patient category would spend in the hospital (6) (Appendix [Table 3]).
Substantial underreporting of cases might be occurring both in Liberia and Sierra Leone (7). To correct for underreporting, EbolaResponse was used to predict the number of beds in use on August 28, 2014. This number was then compared with the actual number of beds in use (from expert opinion estimates). The difference between the two estimates is the potential underreporting correction factor of 2.5 (Appendix [Table 4]). Accuracy of the estimates produced by EbolaResponse was assessed by comparing the model-predicted number of cases to the reported cases (Appendix [Figure 6, Table 5]). The difference in estimates calculated using the uncorrected data and the estimates using the data corrected for underreporting reflects the potential range of uncertainty regarding the actual number of cases that might occur.
Accuracy of the model forecasts was tested by comparing the latest available reported cases at time of writing to estimated cases (estimated using uncorrected data). The last date of reported data used to fit the model was August 28, 2014, for Sierra Leone and August 29, 2014, for Liberia. Reported cases were compared with estimated cases as of September 9, 2014, for Liberia and September 13, 2014, for Sierra Leone.
In the absence of a universal preventive intervention (e.g., vaccine), control of the epidemic consists of having as many patients as possible receiving care in hospitals or, when ETUs are at capacity, at home or in a community setting such that there is a reduced risk for disease transmission (including safe burial when needed). Suitable methods to enhance protection and minimize disease transmission are under development. To illustrate how increasing the percentage of patients in these two categories can control and eventually end the epidemic in Liberia, the first scenario was created. Starting on August 24, 2014, and for the following 30 days, the percentage of patients in ETUs was increased from 10% of all patients to 17%. In the subsequent 30 days (starting September 23, 2014), that percentage was increased to 25% and left at that level for the remainder of the period covered by the model (Appendix [Figure 7, Figure 8]). Starting on August 24, 2014, and for the following 30 days, the percentage of patients at home or in a community setting such that there is a reduced risk for disease transmission was increased from 8% of all patients to 20%. Additional increases were included so that by December 22, 2014, a total of 70% of patients were in either one of the two patient settings (25% in ETUs and 45% at home or in a community setting such that there is a reduced risk for disease transmission) (Appendix [Figure 8]).
To illustrate the cost of delay, in terms of additional cases and the resulting need for additional resources to end the epidemic, in starting to increase interventions that can control and eventually stop the epidemic, a second separate control-and-stop scenario was first constructed as follows. Starting on September 23, 2014, and for the next 30 days, the percentage of all patients in ETUs was increased from 10% to 13%. This percentage was again increased on October 23, 2014, to 25%, on November 22, 2014, to 40%, and finally on December 22, 2014, to 70% (Appendix [Figure 9]) (i.e., it takes 90 days for the percentage of patients in ETUs to reach 70% of all patients). The percentage of patients at home or in a community setting such that there is a reduced risk for disease transmission was kept at 8% from September 23, 2014, through the remainder of the period covered by the model. The impact of delay of starting the increase in interventions was then estimated by twice repeating the above scenario but setting the start day on either October 23, 2014, or November 22, 2014.
Results
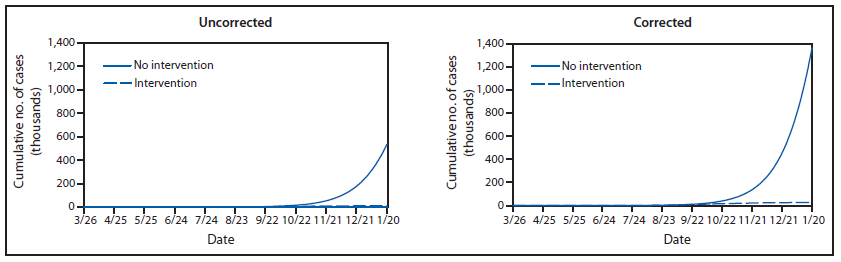
If trends continue without additional interventions, the model estimates that Liberia and Sierra Leone will have approximately 8,000 total Ebola cases (21,000 total cases when corrected for underreporting) by September 30, 2014 (Figure 1). Liberia will account for approximately 6,000 cases (16,000 corrected for underreporting) (Appendix [Figure 1]). Total cases in the two countries combined are doubling approximately every 20 days (Figure 1). Cases in Liberia are doubling every 15–20 days, and those in Sierra Leone are doubling every 30–40 days (Appendix [Figure 1]).
By September 30, 2014, without additional interventions and using the described likelihood of going to an ETU, approximately 670 daily beds in use (1,700 corrected for underreporting) will be needed in Liberia and Sierra Leone (Figure 2). Extrapolating trends to January 20, 2015, without additional interventions or changes in community behavior (e.g., notable reductions in unsafe burial practices), the model also estimates that Liberia and Sierra Leone will have approximately 550,000 Ebola cases (1.4 million when corrected for underreporting) (Appendix [Figure 2]). The uncorrected estimates of cases for Liberia on September 9, 2014, were 2,618, and the actual reported cases were 2,407 (i.e., model overestimated cases by +8.8%). The uncorrected estimates of cases for Sierra Leone on September 13, 2014, were 1,505 and the actual reported cases were 1,620 (i.e., model underestimated cases by -7.6%).
Results from the two illustrative scenarios provide an example of how the epidemic can be controlled and eventually stopped. If, by late December 2014, approximately 70% of patients were placed either in ETUs or home or in a community setting such that there is a reduced risk for disease transmission (including safe burial when needed), then the epidemic in both countries would almost be ended by January 20, 2015 (Appendix [Figure 3]). In the first scenario, once 70% of patients are effectively isolated, the outbreak decreases at a rate nearly equal to the initial rate of increase. In the second scenario, starting an intervention on September 23, 2014, such that initially the percentage of all patients in ETUs are increased from 10% to 13% and thereafter including continual increases until 70% of all patients are in an ETU by December 22, 2014, results in a peak of 1,335 daily cases (3,408 cases estimated using corrected data) and <300 daily cases by January 20, 2015 (Appendix [Figure 10]). Delaying the start of the intervention until October 23, 2014, results in the peak increasing to 4,178 daily cases (10,646 cases estimated using corrected data). Delaying the start further, until November 22, results in 10,184 daily cases (25,847 estimated using corrected data) by January 20, 2015, which is the last date included in the model (Appendix [Figure 10]).
Discussion
The cumulative number of Ebola cases for Liberia and Sierra Leone could double to approximately 8,000 by the end of September 2014. This estimate is within the range of other published estimates (8,9). Cases could be underreported by a factor of 2.5, and ending the epidemic requires approximately 70% of persons with Ebola to be treated either in an ETU or at home or in a community setting such that there is a reduced risk for disease transmission (including safe burial when needed). A substantial cost can be associated with delaying the start of an increase in effective interventions. In the relevant scenario examined in this report, every 30-day delay in increasing the percentage of patients in ETUs until 70% of all patients were hospitalized was associated with an approximate tripling of the number of daily cases that occur at the peak of the epidemic (however, the epidemic still eventually ends).
Limitations
The findings in this report are subject to at least five limitations. First, extrapolating current trends in increase of cases to forecast all future cases might not be appropriate. Underlying factors such as a spontaneous change in contacts with ill persons or burial practices or substantial changes in movement within countries or across borders could alter future growth patterns. Therefore, limiting model-calculated projections to shorter durations such as 3 months might be more appropriate. Second, assuming that this epidemic has similar epidemiologic parameters to previous outbreaks (e.g., incubation and infectiousness periods) might not be accurate, although anecdotal evidence to date has not indicated otherwise. Third, reliance on expert opinion to estimate a correction factor regarding number of beds in use might not account sufficiently for factors such as patients being turned away from full ETUs. Fourth, the correction factor could change substantially over time. Notable regional differences in underreporting might mean that using one correction factor across an entire country is inappropriate. Finally, the illustrative scenario does not consider the logistics needed to increase the percentages of patients who are receiving care in an ETU or at home or in a community setting such that there is a reduced risk for disease transmission (including safe burial when needed).
Conclusion
The findings in this report underscore the substantial public health challenges posed by the predicted number of future Ebola cases. If conditions continue without scale-up of interventions, cases will continue to double approximately every 20 days, and the number of cases in West Africa will rapidly reach extraordinary levels. However, the findings also indicate that the epidemic can be controlled. Ensuring that approximately 70% of the patients are in ETUs is necessary, or, when ETUs are at capacity, that they are at home or in a community setting such that there is a reduced risk for disease transmission (including safe burial when needed). The existing capacity of ETUs to admit patients with Ebola is insufficient to stem the estimated increases in cases. Delays in increasing ETU capacity translates into a cost of additional cases. Results of the model support the need for more ETUs to be built, supplied, and staffed. Officials have developed a plan to rapidly increase ETU capacities and also are developing innovative methods that can be quickly scaled up to isolate patients in non-ETU settings in a way that can help disrupt Ebola transmission in communities. The U.S. government and international organizations recently announced commitments to support these measures. As these measures are rapidly implemented and sustained, the higher projections presented in this report become very unlikely.
Acknowledgments
The authors acknowledge Karen Wong and Bradford Greening for providing technical comments on the report.
References
- World Health Organization, Africa Regional Office. Ebola virus disease in Guinea. Geneva, Switzerland: World Health Organization; 2014. Available at http://www.afro.who.int/en/clusters-a-programmes/dpc/epidemic-a-pandemic-alert-and-response/outbreak-news/4063-ebola-hemorrhagic-fever-in-guinea.html.
- World Health Organization. Ebola virus disease outbreak—West Africa. Geneva, Switzerland: World Health Organization; 2014. Available at http://www.who.int/csr/don/2014_09_04_ebola/en.
- Chowell G, Hengartner NW, Castillo-Chavez C, Fenimore PW, Hyman JM. The basic reproductive number of Ebola and the effects of public health measures: the cases of Congo and Uganda. J Theor Biol 2004;229:119–26.
- Legrand J, Grais RF, Boelle PY, Valleron AJ, Flahault A. Understanding the dynamics of Ebola epidemics. Epidemiol Infect 2007;135:610–21.
- Lekone PE, Finkenstädt BF. Statistical inference in a stochastic epidemic SEIR model with control intervention: Ebola as a case study. Biometrics 2006;62:1170–7.
- Borchert M, Mutyaba I, Van Kerkhove MD, et al. Ebola haemorrhagic fever outbreak in Masindi District, Uganda: outbreak description and lessons learned. BMC Infect Dis 2011;11:357.
- World Health Organization. No early end to the Ebola outbreak. Geneva, Switzerland: World Health Organization; 2014. Available at http://www.who.int/csr/disease/ebola/overview-20140814/en.
- Shaman J. Columbia prediction of infectious diseases: Ebola forecasts. New York, NY: Columbia Mailman School of Public Health; 2014. Available at http://cpid.iri.columbia.edu/ebola.html.
- Kupferschmidt K. Disease modelers project a rapidly rising toll from Ebola. ScienceInsider 2014;345 #6200. Available at http://news.sciencemag.org/health/2014/08/disease-modelers-project-rapidly-rising-toll-ebola.
* The latest updates, including case counts, on the 2014 Ebola outbreak in West Africa are available at http://www.cdc.gov/vhf/ebola/outbreaks/guinea/index.html.
† The most up-to-date clinical guidelines on the 2014 Ebola outbreak in West Africa are available at http://www.cdc.gov/vhf/ebola/hcp/index.html.
FIGURE 1. Estimated number of Ebola cases, with and without correction for underreporting,* through September 30 — EbolaResponse modeling tool, Liberia and Sierra Leone combined, 2014
* Corrected for potential underreporting by multiplying reported cases by a factor of 2.5 (Appendix [Table 4]).
Alternate Text: The figure above shows the estimated number of Ebola cases in Liberia and Sierra Leone during 2014, with and without correction for underreporting, according to the EbolaResponse modeling tool. If trends continue without additional interventions, CDC estimates that Liberia and Sierra Leone will have approximately 8,000 Ebola cases (21,000 cases when corrected for underreporting) by September 30, 2014.
FIGURE 2. Estimated daily number of beds in use,* with and without correction for underreporting,† through September 30 — EbolaResponse modeling tool, Liberia and Sierra Leone combined, 2014
* Estimates of daily number of beds in use are calculated using estimates of likelihood of going to an Ebola treatment center (ETU) and days in the ETU (Appendix [Table 3]).
† Corrected for potential underreporting by multiplying reported cases by a factor of 2.5 (Appendix [Table 4]).
Alternate Text: The figure above shows the estimated daily number of beds in use in Liberia and Sierra Leone during 2014, with and without correction for underreporting, according to the EbolaResponse modeling tool. By September 30 2014, without additional interventions and using the described likelihood of going to an Ebola treatment unit, approximately 670 daily beds in use (1,700 corrected for underreporting) will be needed in Liberia and Sierra Leone.
Appendix: Additional Results and Technical Notes for the EbolaResponse Modeling Tool
Additional Results
Numbers of Ebola virus disease cases (hereafter referred to as Ebola) and daily number of beds in use in Liberia and Sierra Leone alone (Figure 1) and in Liberia and Sierra Leone combined (Figure 2) were estimated using the EbolaResponse modeling tool. The outcome of potential interventions on number of cases and beds in use in the two countries combined was simulated (Figure 3).
EbolaResponse Model Overview
CDC has created a spreadsheet-based modeling tool called EbolaResponse that allows users to estimate the number of Ebola cases in a community (available at http://dx.doi.org/10.15620/cdc.24900). The model tracks patients through the following states: susceptible, infected, incubating, infectious, and recovered (an SIIR model). EbolaResponse is, in effect, a Markov chain model and is similar to an Ebola model built in 2004 (1).
Probabilities drawn from reports of previous Ebola outbreaks are used to model the daily change in patients' status between and within the SIIR states. For example, to estimate the duration of the incubating state, data were adapted from a previous study (2) that indicate the likelihood that an incubation period will last a certain number of days, up to a maximum of 25. A patient can only progress forward through the states and can never regress (e.g., go from the incubating state back to susceptible) or skip a state (e.g., go from the incubating to the recovered state, skipping the infectious state). All infected persons were assumed to eventually become symptomatic. That is, the state of being infected but not becoming symptomatic at any period was not considered.
Assumed Population Size and Numbers Initially Infected
Community sizes equal to the populations of either Liberia or Sierra Leone were assumed and used. The community size can be readily altered. Numbers used in the model as initially infected were chosen to match the number of cases first recorded (2).
Liberia
- Population: 4,294,000 (3)
- Initially infected: Nine
Sierra Leone
- Population: 6,092,000 (3)
- Initially infected: 30
Incubation State
Data from two sources (2,4) were used to construct a lognormal probability distribution of being in the incubation state (Figure 4, Table 1). The mean incubation period derived from this calculation is 6.3 days (standard deviation [SD]: 3.31 days), with a median of 5.5 days and a 99th percentile at 21 days.
In one study, data from a 1995 outbreak in the Democratic Republic of the Congo (DRC, formerly Zaire) and a 2000 outbreak in Uganda were used to estimate mean incubation periods of 5.30 days (SD: 0.23 days) and 3.35 days (SD: 0.49 days), respectively (1). These are lower than other published estimates (2,4). Some of the differences might be attributable to different subtypes of the virus (4).
The incubation distribution can be changed, with an upper limit of 25 days of incubation. Users of the EbolaResponse modeling tool can change the incubation distribution by selecting from two alternative, preprogrammed distributions available from the drop-down menu in the appropriate page in EbolaResponse. The two alternative distributions were based on previously published studies (2,4). As yet another alternative, users can enter their own distribution.
Infectious State
Average Number of Days
An average infectious state of 6 days was assumed in the model, which includes any time taken for a traditional burial. In comparison, data from a 1995 outbreak in DRC and a 2000 outbreak in Uganda (the latter caused by the Sudan strain of Ebola) (5) were used to calculate estimated mean infectious periods of 5.6 and 3.50 days, respectively (1). Data from the 1995 Ebola outbreak in the Congo also were used to calculate an estimated mean infectious period of approximately 6 days (6). Repeated testing of patients with Ebola has demonstrated that the amount of virus present increases until death or approximately 6–10 days after initial infection (7). The EbolaResponse modeling tool can be used to adjust this period from 1 day to a maximum of 15 days.
The risk for onward transmission of infection to a person in the susceptible state was assumed to be equal throughout the 6 days. No data were found regarding whether risk for onward transmission changes over the duration of fulminant illness. However, the possibility exists that the risk does change as a patient becomes more ill and requires more care.
Burial Practices
Traditional burial of the body of a person who has died from Ebola could involve contact with body fluids, posing a risk for infection. For example, in northern Uganda, the body is prepared for burial by the paternal aunt (or if no paternal aunt exists, by an older woman on the paternal side of the family). After removing clothes from the body, the woman washes and dresses it. Funeral rituals include all family members washing their hands in a common bowl and touching the face of the deceased person in the open casket, referred to as a love touch. A white cloth is used to wrap the body, and the body is buried (8). Although this burial ritual is an example from Uganda, researchers have mentioned that similar practices occur throughout Africa (9). Because cultural practices regarding burial might vary by region, users might want to change the period of infectiousness in the model.
Population Governor
Although an exposed state is not included in the model, a population governor is included that prevents the model from calculating more cases than the input population. This overestimation is possible if a user of the model assumes that most of the patients remain home with no effective isolation, the patient category that has the highest risk for onward disease transmission (Table 1).
The governor was programmed by reducing the daily estimate of persons newly infected proportionate to the cumulative reduction in the susceptible population as follows:
Factor to reduce estimate of newly infected at
Day t = [Model population – Cumulative total of newly infected up to Day (t-1)] / Model population
This governor reduces, on a daily basis, the estimated number of persons infected, which effectively lowers the risk for transmission (Table 1). In most instances, this governor is unlikely to affect the calculations from large populations. The governor only begins to appreciably reduce estimates when approximately 40%–50% of the population has become infected. The EbolaResponse governor also is programmed so that the minimum value of the calculated factor cannot be less than 0, preventing the possibility of negative cases.
Distribution Over Time of Patients by Patient Category
Patients were categorized by three types of patient. These three categories have different levels of isolation: 1) hospitalized, 2) home or in a community setting such that there is a reduced risk for disease transmission (including safe burial when needed), and 3) home with no effective isolation.
- Hospitalized patients are in facilities such as Ebola treatment units (ETUs) where medical care is provided. Ideally, such facilities have infection-control protocols that prevent additional disease transmission. However, this is not always the case, and health-care workers in medical care facilities have been infected after contact with Ebola patients (10). Therefore, the average daily risk for transmission is greater than zero in these facilities (i.e., transmission occurs), but the risk is fewer than one person infected per infectious patient (Table 1).
- A patient who is at home or in a community setting such that there is a reduced risk for disease transmission (including safe burial when needed) is being attended to with the overall goal of reducing transmission to other members of the household. If the patient dies, safe burial practices are used. Risk is fewer than one person infected per infectious patient (Table 1).
- A patient who is at home with no effective isolation is being attended to at home but with no specific infection-control measures in place. In addition, if the patient dies, no measures are in place to limit transmission. This patient category has the greatest risk for onward transmission (Table 1).
These three categories have varying risk for onward Ebola virus transmission over time (Figure 5). The estimated values were calculated by altering these values with the risk for onward transmission (Table 1) as well as the number of imported cases or cases in patients with no known contacts (Table 2). All of these values were altered until the estimates of cases produced by the model closely matched (i.e., fit) the reported cases to date (see also Goodness of Fit section).
The distribution of patients into the three patient categories influences the overall progress of the epidemic. For example, the more patients who are hospitalized and at home or in a community setting such that there is a reduced risk for disease transmission, the slower the progress of the epidemic because these two categories are calculated to have transmission rates of fewer than one person infected per infectious person (Table 1). A certain proportion of patients who were home or in a community setting such that there is a reduced risk for disease transmission and home with no effective isolation was assumed to eventually become hospitalized in ETUs (Table 3). However, they were assumed to be hospitalized so late in the progression of the disease that the average risk for onward transmission was unchanged.
Risk for Onward Transmission
The risk for onward transmission from an Ebola patient in the infectious state to persons in the susceptible state varies by patient category (Table 1). The estimated values were calculated by altering these values along with the distribution of patients by category of patient (Figure 5) as well as the number of imported cases or cases in patients with no known contacts (Table 2). All of these values were altered until the estimates of cases produced by the model closely matched (i.e., fit) the reported cases to date (see also Goodness of Fit section).
Allowing for Imported Cases or Cases in Persons With No Known Contacts
The ability to add imported cases (whole numbers) every 10 days was built into the EbolaResponse modeling tool. These persons are entered into the model as infected and then go through incubation before becoming infectious. Imported cases represent 1) Ebola cases in persons who travel into the community undetected from another outbreak-affected area or 2) cases in persons whose infection cannot be readily explained by contact tracing (i.e., apparently no known contact with a previously ill patient). The values shown (Table 2) were used to calculate the estimated cases presented in the main report.
The estimated number of imported cases per each 10-day time step were calculated by altering these numbers along with the distribution of patients by category of patient (Figure 5) as well as the risk for onward transmission (Table 1). All of these numbers were altered until the estimates of cases produced by the model closely matched (i.e., fit) the reported cases to date (see also Goodness of Fit section).
Likelihood of Being Hospitalized and Duration of Hospital Stay
To estimate daily hospital admissions and daily number of beds in use, both the likelihood of a patient being hospitalized and the number of days that a patient in each patient category would spend in the hospital had to be assumed (Table 3).
Correcting for Potential Underreporting
Substantial underreporting of cases might be occurring both in Liberia and Sierra Leone (11). To adjust for such a possibility, the calculated daily number of hospital beds in use was compared with expert opinion of number of beds in use. A correction factor of approximately 2.5 was calculated for Liberia (Table 4). Therefore, to obtain an estimate of actual cases, the reported cases are multiplied by 2.5. After a corrected number of cases was calculated, the model was refitted (see Goodness of Fit section).
Goodness of Fit
The following three variables were altered so that the estimates from the model more closely matched (i.e., fit) the actual reported cases:
- Percentage of patients in each of the three patient categories, with percentages changing over time in increments of 30 days (Figure 5)
- Daily risk for transmission of Ebola by patient category (Table 1)
- Addition of imported cases (Table 2)
For both the Sierra Leone and Liberian data, these three numbers were altered until the estimates of cases for either Sierra Leone or Liberia produced by the model fit the reported cases to date (Table 5, Figure 6) (12). Visual inspection was used to validate the fit of the model-predicted cases to the actual reported cases (Figure 6).
Interventions
Controlling the Epidemic
The EbolaResponse modeling tool was used to construct a scenario to illustrate how control and prevention interventions can slow and eventually stop the Ebola epidemic in Liberia. Control is achieved by moving patients who are being attended to at home with no effective isolation to either the hospitalized category or at home or in a community setting such that there is a reduced risk for disease transmission (including safe burial when needed) category (see also Distribution Over Time of Patients by Patient Category). The more patients who are hospitalized or being attended to at home or in a community setting such that there is a reduced risk for disease transmission, the slower the progress of the epidemic because these two categories are calculated to have transmission rates of fewer than one person infected per infectious person (Table 1). The interventions affect the cumulative numbers of cases of Ebola and daily beds in use (Figure 3, Figure 7).
Methods
Applying Interventions and Distribution of Patients into Categories
As described previously, in the EbolaResponse modeling tool, Ebola patients are categorized by three levels that result in different levels of isolation: 1) hospitalized, 2) home or in a community setting such that there is a reduced risk for disease transmission (including safe burial when needed), and 3) home with no effective isolation. These three categories affect the risk for onward Ebola virus transmission; the highest risk for transmission occurs among patients who are in the third category (Table 1). In the absence of a universal preventive intervention (e.g., vaccine), control of the epidemic consists of having as many patients as possible in either the hospitalized category or at home or in a community setting such that there is a reduced risk for disease transmission category.
To illustrate how increasing the percentage of patients in these two categories can control and eventually end the epidemic in Liberia, the following circumstances were assumed. Starting on August 24, 2014 (day 151 in the model), the percentage of patients hospitalized in ETUs was assumed to increase from 10% of all patients to 17%. In the subsequent 30 days (starting September 21, 2014), the percentage was increased to 25% and stayed at that level for the remainder of the simulation (Figure 8). In addition, starting on August 24, 2014, the percentage of patients at home or in a community setting such that there is a reduced risk for disease transmission (including safe burial when needed) was increased from 8% of all patients to 20%. This percentage was increased to 30% for the following 30 days (starting September 21, 2014). This percentage was then increased to 35% for the 30 days starting October 23, 2015, followed by increases to 40% and 45% on November 22, 2014, and December 22, 2014, respectively (Figure 7).
With the described increases of patients, by December 22, 2014, a total of 70% of patients (25% hospitalized in ETUs and 45% at home or in a community setting such that there is a reduced risk for disease transmission) are estimated to be in the two categories that are known to reduce Ebola transmission.
Fitting the Model and Goodness of Fit
As described previously, to estimate the potential impact of interventions, the input values of the distribution of patients, the risk for onward transmission, and the number of imported cases or cases with no known contacts were altered in the EbolaResponse modeling tool. The interventions are assumed to start after the date of the last reported case. Therefore, the input values for imported cases are the same as those shown for Liberia (both uncorrected and corrected) (Table 2). Similarly, the same values were used for the daily risk for transmission (Table 1). Because the interventions start after the date of the last reported case, the originally calculated input values (Table 1, Table 2, and Table 3) and the resulting goodness of fit for the Liberian data (Table 5 and Figure 6) are all valid for the intervention scenario.
Cost of Delay
To illustrate the cost of delay, in terms of additional cases and the resulting need for additional resources to end the epidemic, in starting to increase interventions that can control and eventually stop the epidemic, a separate control-and-stop scenario was first constructed as follows. Starting on September 23, 2014, and for the next 30 days, the percentage of all patients in ETUs was increased from 10% to 13%. This percentage was again increased on October 23, 2014, to 25%, on November 22, 2014, to 40%, and finally on December 22, 2014, to 70% (Figure 9) (i.e., it takes 90 days for the percentage of patients in ETUs to reach 70% of all patients). The percentage of patients at home or in a community setting such that there is a reduced risk for disease transmission was kept at 8% from September 23, 2014, through the remainder of the period covered by the model. The impact of delay of starting the increase in interventions was then estimated by twice repeating the above scenario but setting the start day on either October 23, 2014, or November 22, 2014.
Starting an intervention on September 23, 2014, such that initially the percentage of all patients in ETUs are increased from 10% to 13% and thereafter including continual increases until 70% of all patients are in an ETU by December 22, 2014, results in a peak of 1,335 daily cases (3,408 cases estimated using corrected data) and <300 daily cases by January 20, 2015 (Figure 10). Delaying the start of the intervention, until October 23, 2014, results in the peak increasing to 4,178 daily cases (10,646 cases estimated using corrected data). Delaying the start further, until November 22, results in 10,184 daily cases (25,847 estimated using corrected data) by January 20, 2015, which is the last date included in the model (Figure 10).
References
- Chowell G, Hengartner NW, Castillo-Chavez C, Fenimore PW, Hyman JM. The basic reproductive number of Ebola and the effects of public health measures: the cases of Congo and Uganda. J Theor Biol 2004;229:119–26.
- Legrand J, Grais RF, Boelle PY, Valleron AJ, Flahault A. Understanding the dynamics of Ebola epidemics. Epidemiol Infect 2007;135:610–21.
- The World Bank. Data: population, total. Washington, DC: The World Bank; 2014. Available at http://data.worldbank.org/indicator/SP.POP.TOTL.
- Eichner M, Dowell SF, Firese N. Incubation period of Ebola hemorrhagic virus subtype Zaire. Osong Public Health Res Perspect 2011;2:3–7.
- CDC. Outbreaks chronology: Ebola hemorrhagic fever. Atlanta, GA: CDC; 2014. Available at http://www.cdc.gov/vhf/ebola/resources/outbreak-table.html.
- Lekone PE, Finkenstädt BF. Statistical inference in a stochastic epidemic SEIR model with control intervention: Ebola as a case study. Biometrics 2006;62:1170–7.
- Towner JS, Rollin PE, Bausch DG, et al. Rapid diagnosis of Ebola hemorrhagic fever by reverse-transcription-PCR in an outbreak setting and assessment of patient viral load as a predictor of outcome. J Virol 2004;78:4330–41.
- Hewlett BS, Amola RP. Cultural contexts of Ebola in northern Uganda. Emerg Infect Dis 2003;9:1242–8.
- Bruce JC. Marrying modern health practices and technology with traditional practices: Issues for the African continent. Int Nurs Rev 2002;49:161–7.
- World health Organization. Unprecedented number of medical staff infected with Ebola. Geneva, Switzerland: World Health Organization; 2014. Available at http://www.who.int/mediacentre/news/ebola/25-august-2014/en.
- World Health Organization. No early end to the Ebola outbreak. Geneva, Switzerland: World Health Organization; 2014. Available at http://www.who.int/csr/disease/ebola/overview-20140814/en.
- World Health Organization. Ebola virus disease outbreak—West Africa. Geneva, Switzerland: World Health Organization; 2014. Available at http://www.who.int/csr/don/2014_09_04_ebola/en.
FIGURE 1. Estimated number of Ebola cases and daily number of beds in use,* with and without correction for underreporting,† through September 30 — EbolaResponse modeling tool, Liberia and Sierra Leone, 2014
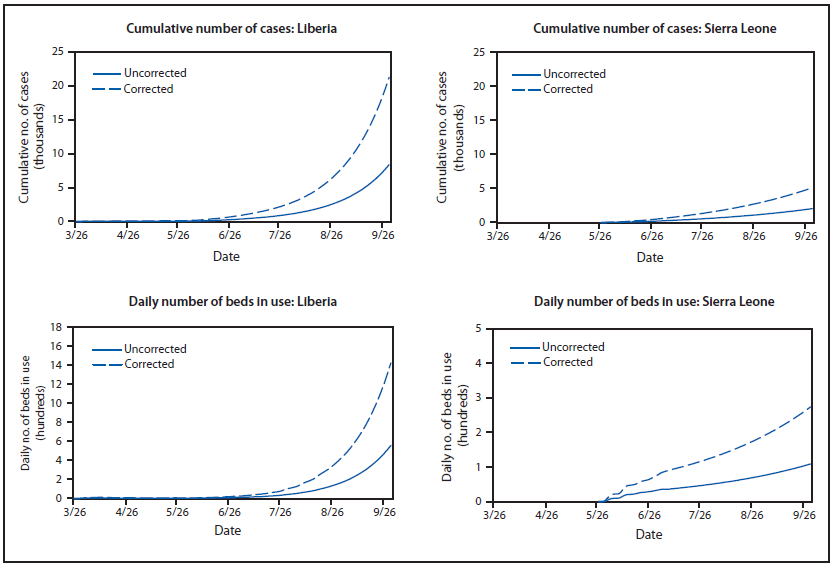
* Estimates of daily number of beds in use are calculated using estimates of likelihood of going to an Ebola treatment unit (ETU) and days in the ETU (Table 3).
† Corrected for potential underreporting by multiplying reported cases by a factor of 2.5 (Table 4).
Alternate Text: The figure above shows the estimated number of Ebola cases and daily number of beds in use, in Liberia and Sierra Leone alone during 2014, with and without correction for underreporting, according to the EbolaResponse modeling tool.
FIGURE 2. Estimated number of Ebola cases and daily number of beds in use,* with and without correction for underreporting† — EbolaResponse modeling tool, Liberia and Sierra Leone combined, 2014–2015
* Corrected for potential underreporting by multiplying reported cases by a factor of 2.5 (Table 4).
† Estimates of daily number of beds in use are calculated using estimates of likelihood of going to an Ebola treatment unit (ETU) and days in the ETU (Table 3).
Alternate Text: The figure above shows the estimated number of Ebola cases and daily number of beds in use Liberia and Sierra Leone combined during 2014, with and without correction for underreporting, according to the EbolaResponse modeling tool.
FIGURE 3. Estimated impact of intervention* on number of Ebola cases and daily number of beds in use,† with and without correction for underreporting§ — EbolaResponse modeling tool, Liberia, 2014–2015
* To construct an illustrative control scenario in Liberia, an intervention modeling scenario was created in which, starting on August 24, 2014, the percentage of patients in Ebola treatment units (ETUs) increased from 10% of all patients to 17%. In the subsequent 30 days (starting September 21, 2014), that percentage was increased to 25% and left at that level for the remainder of the period covered by the model (Figure 8). Starting on August 24, 2014, the percentage of patients at home or in a community setting such that there is a reduced risk for disease transmission (including safe burial when needed) was increased from 8% of all patients to 20%. Additional increases were included so that by December 22, 2014, a total of 70% of patients were in either one of those two settings (25% in ETUs + 45% at home or in a community setting such that there is a reduced risk for disease transmission [including safe burial when needed]) (Figure 8).
† Estimates of daily number of beds in use are calculated using estimates of likelihood of going to an ETU and days in the ETU (Table 3).
§ Corrected for potential underreporting by multiplying reported cases by a factor of 2.5 (Table 4).
Alternate Text: The figure above shows the estimated impact of intervention on number of Ebola cases and daily number of beds in use in Liberia and Sierra Leone combined during 2014, with and without correction for underreporting, according to the EbolaResponse modeling tool. The EbolaResponse modeling tool was used to construct a scenario to illustrate how control and prevention interventions. The interventions affect the cumulative numbers of cases of Ebola and daily beds in use.
Sources: Data adapted from Legrand J, Grais RF, Boelle PY, Valleron AJ, Flahault A. Understanding the dynamics of Ebola epidemics. Epidemiol Infect 2007;135:610–21; and Eichner M, Dowell SF, Firese N. Incubation period of Ebola hemorrhagic virus subtype Zaire. Osong Public Health Res Perspect 2011;2:3–7.
* Frequency relates to number of patients out of a total of 5,000 patients.
Alternate Text: The figure above shows the distribution of Ebola virus incubation period, by days of incubation. Data from two sources were used to construct a lognormal probability distribution of being in the incubation state. The mean incubation period derived from this calculation is 6.3 days (standard deviation: 3.31 days), with a median of 5.5 days and a 99th percentile at 21 days.
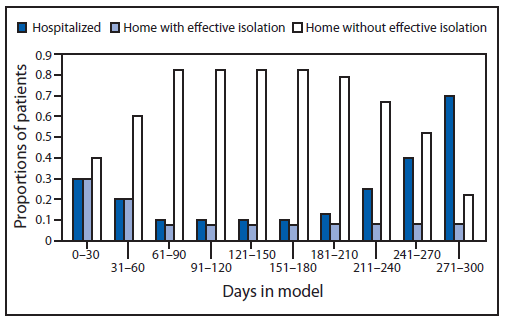
FIGURE 5. Proportion of patients* with Ebola over time, by category of patient† — EbolaResponse modeling tool, Liberia and Sierra Leone, 2014
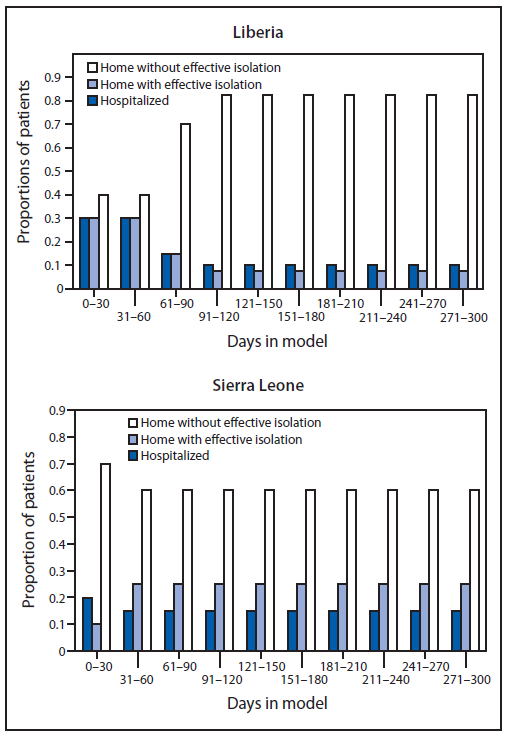
* Distribution estimated using the modeling tool, obtained after fitting the model output (cumulative number of cases) to actual data.
† Patients are distributed in the EbolaResponse modeling tool into one of three categories: 1) hospitalized, 2) home or in a community setting such that there is a reduced risk for disease transmission (including safe burial when needed), and 3) home with no effective isolation. These three categories reflect the risk for onward Ebola transmission (Table 1). EbolaResponse is programmed to make changes in the distribution of patients among the three categories of care every 30 days. For Liberia, day 1 is March 3, 2014, and for Sierra Leone, is May 27, 2014. September 22, 2014, is day 180 when the model is fitted to Liberian data and is day 119 when the model is fitted to Sierra Leone data.
Alternate Text: The figure above shows the proportion of patients with Ebola over time, by category of patient in Liberia and Sierra Leone during 2014, according to the EbolaResponse modeling tool. Patients were categorized by three types. These three categories have different levels of isolation: 1) hospitalized, 2) home or in a community setting such that there is a reduced risk for disease transmission (including safe burial when needed), and 3) home with no effective isolation. These three categories have varying risk for onward Ebola virus transmission over time. The percentage of patients in each of the three patient categories, with percentages changing over time in increments of 30 days, was one of three variables altered so that the estimates from the model more closely matched (i.e., fit) the actual reported cases.
FIGURE 6. Goodness of fit: comparison of cumulative reported and model-predicted numbers of Ebola cases* — EbolaResponse modeling tool, Liberia and Sierra Leone, 2014
* Model-predicted number of cases, obtained by altering the percentage of patients in each of the three categories of patient (Figure 5), risk for transmission of Ebola by category of patient (Table 1), and addition of imported cases (Table 2) until the estimates produced by the model for either Sierra Leone or Liberia closely matched (fit) the reported cases to date from the World Health Organization.
Alternate Text: The figure above shows the goodness of fit: comparison of cumulative reported and model-predicted numbers of Ebola cases in Liberia and Sierra Leone during 2014, according to the EbolaResponse modeling tool. The following three variables were altered so that the estimates from the model more closely matched (i.e., fit) the actual reported cases: Percentage of patients in each of the three patient categories, with percentages changing over time in increments of 30 days. Daily risk for transmission of Ebola by patient category. Addition of imported cases. For both the Sierra Leone and Liberian data, these three values were altered until the estimates of cases for either Sierra Leone or Liberia produced by the model fit the reported cases to date.
FIGURE 7. Estimated impact of interventions on cumulative number of Ebola cases, with and without corrected data*— EbolaResponse modeling tool, Liberia, 2014
* Corrected for potential underreporting by multiplying reported cases by a factor of 2.5 (Table 4).
Alternate Text: The figure above shows the estimated impact of interventions on cumulative number of Ebola cases, with and without corrected data in Liberia during 2013, according to the EbolaResponse modeling tool. The EbolaResponse modeling tool was used to construct a scenario to illustrate how control and prevention interventions. The interventions affect the cumulative numbers of cases of Ebola and daily beds in use.
FIGURE 8. Estimated impact of interventions by changing proportion of patients* with Ebola over time, by category of patient†— EbolaResponse modeling tool, Liberia, 2014
* Distribution through August 24, 2014, (day 151) estimated using the modeling tool, obtained after fitting the model output (cumulative number of cases) to actual data. Distributions after that date are based on estimates determined from the scenario to illustrate how interventions can slow and eventually stop the Ebola epidemic in Liberia.
† Patients are distributed in the EbolaResponse modeling tool into one of three categories: 1) hospitalized, 2) home or in a community setting such that there is a reduced risk for disease transmission (including safe burial when needed), and 3) home with no effective isolation. These three categories reflect the risk for onward Ebola transmission (Table 1). EbolaResponse is programmed to make changes in the distribution of patients among the three categories every 30 days. For Liberia, day 1 is March 3, 2014, and September 22, 2014, is day 180.
Alternate Text: The figure above shows the estimated impact of interventions on proportion of patients with Ebola over time, by category of patient in Liberia during 2014, according to the EbolaResponse modeling tool. To illustrate how increasing the percentage of patients in these two categories can control and eventually end the epidemic in Liberia, the following circumstances were assumed. Starting on August 24, 2014 (day 151 in the model), the percentage of patients hospitalized in Ebola treatment units was assumed to increase from 10% of all patients to 17%. In the subsequent 30 days (starting September 21, 2014), the percentage was increased to 25% and stayed at that level for the remainder of the simulation.
FIGURE 9. Estimated impact of delaying intervention* by changing proportion of patients with Ebola over time, by category of patient†— EbolaResponse modeling tool, Liberia, 2014
* Intervention: Starting on September 23, 2014, (day 181 in model) and for the next 30 days, the percentage of all patients in Ebola treatment units (ETUs) was increased from 10% to 13%. This percentage was again increased on October 23, 2014 (day 211 in model) to 25%, on November 22, 2014 (day 241 in model) to 40%, and finally on December 22, 2014 (day 271 in model) to 70%. Day 1 in model is March 3, 2014. The impact of a delay of starting the increase in interventions was then estimated by twice repeating the above scenario but setting the start day on either October 23, 2014, or November 22, 2014.
† Patients are distributed in the EbolaResponse modeling tool into one of three categories: 1) hospitalized, 2) home or in a community setting such that there is a reduced risk fordisease transmission (including safe burial when needed), and 3) home without effective isolation. These three categories reflect the risk for onward Ebola transmission (Table 1).
Alternate Text: The figure above shows the estimated impact of delaying interventions on proportion of patients with Ebola over time, by category of patient in Liberia during 2014, according to the EbolaResponse modeling tool. To illustrate how increasing the percentage of patients in these two categories can control and eventually end the epidemic in Liberia, the following circumstances were assumed. Starting on September 23, 2014 (day 181 in the model), the percentage of patients hospitalized in Ebola treatment units was assumed to increase from 10% of all patients to 17%. This percentage was increased on October 23, 2014 (day 211 in the model) to 25%, on November 22, 2014 (day 241 in the model) to 40% and on December 22, 2014 (day 271 in the model) to 70%.
FIGURE 10. Estimated impact of delaying intervention* on daily number of Ebola cases, with and without correction for underreporting† —EbolaResponse modeling tool, Liberia, 2014–2015
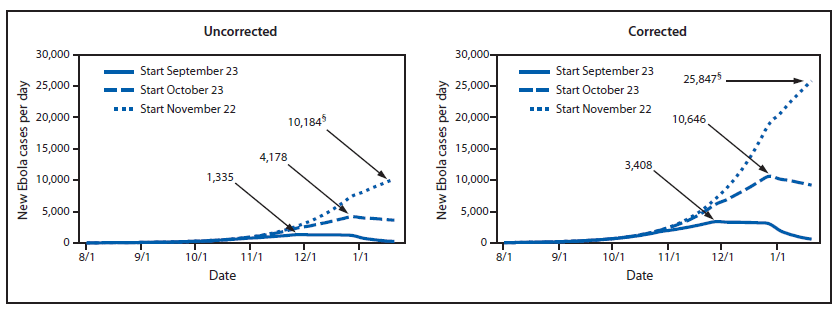
* Intervention: Starting on September 23, 2014 (day 181 in model), and for the next 30 days, the percentage of all patients in Ebola treatment units was increased from 10% to 13%. This percentage was again increased on October 23, 2014 (day 211 in model) to 25%, on November 22, 2014 (day 241 in model) to 40%, and finally on December 22, 2014 (day 271 in model) to 70%. Day 1 in model is March 3, 2014. The impact of a delay of starting the increase in interventions was then estimated by twice repeating the above scenario but setting the start day on either October 23, 2014, or November 22, 2014.
† Corrected for potential underreporting by multiplying reported cases by a factor of 2.5 (Table 4).
§ New Ebola patients at peak of each start date. (Note that when the intervention is started on November 22, 2014, the peak is not reached by January 20, 2014, which is the last date included in the model.)
Alternate Text: The figure above shows the estimated impact of delaying interventions on the daily number of patients with Ebola over time, with and without correction for underreporting in Liberia during 2014, according to the EbolaResponse modeling tool. Starting on September 23, 2014 (day 181 in the model), the percentage of patients hospitalized in Ebola treatment units was assumed to increase from 10% of all patients to 17%. This percentage was increased on October 23, 2014 (day 211 in the model) to 25%, on November 22, 2014 (day 241 in the model) to 40% and on December 22, 2014 (day 271 in the model) to 70%.
Use of trade names and commercial sources is for identification only and does not imply endorsement by the U.S. Department of
Health and Human Services.
References to non-CDC sites on the Internet are
provided as a service to MMWR readers and do not constitute or imply
endorsement of these organizations or their programs by CDC or the U.S.
Department of Health and Human Services. CDC is not responsible for the content
of pages found at these sites. URL addresses listed in MMWR were current as of
the date of publication.
All MMWR HTML versions of articles are electronic conversions from typeset documents.
This conversion might result in character translation or format errors in the HTML version.
Users are referred to the electronic PDF version (http://www.cdc.gov/mmwr)
and/or the original MMWR paper copy for printable versions of official text, figures, and tables.
An original paper copy of this issue can be obtained from the Superintendent of Documents, U.S.
Government Printing Office (GPO), Washington, DC 20402-9371;
telephone: (202) 512-1800. Contact GPO for current prices.
**Questions or messages regarding errors in formatting should be addressed to
mmwrq@cdc.gov.
