Persons using assistive technology might not be able to fully access information in this file. For assistance, please send e-mail to: mmwrq@cdc.gov. Type 508 Accommodation and the title of the report in the subject line of e-mail.
Residential Proximity to Major Highways — United States, 2010
Corresponding author: Tegan K. Boehmer, Division of Environmental Hazards and Health Effects, CDC. Telephone: 770-488-3714; E-mail: tboehmer@cdc.gov.
Introduction
Traffic-related air pollution is a main contributor to unhealthy ambient air quality, particularly in urban areas with high traffic volume. Within urban areas, traffic is a major source of local variability in air pollution levels, with the highest concentrations and risk of exposure occurring near roads. Motor vehicle emissions represent a complex mixture of criteria air pollutants, including carbon monoxide (CO), nitrogen oxides (NOx), and particulate matter (PM), as well as hydrocarbons that react with NOx and sunlight to form ground-level ozone. Individually, each of these pollutants is a known or suspected cause of adverse health effects (1–4). Taking into consideration the entire body of evidence on primary traffic emissions, a recent review determined that there is sufficient evidence of a causal association between exposure to traffic-related air pollution and asthma exacerbation and suggestive evidence of a causal association for onset of childhood asthma, nonasthma respiratory symptoms, impaired lung function, all-cause mortality, cardiovascular mortality, and cardiovascular morbidity (5).
The mixture of traffic-related air pollutants can be difficult to measure and model. For this reason, many epidemiologic studies rely on measures of traffic (e.g., proximity to major roads, traffic density on nearest road, and cumulative traffic density within a buffer) as surrogates of exposure (6–8). These traffic measures typically account for both traffic volume (i.e., number of vehicles per day), which is a marker of the type and concentration of vehicle emissions, and distance, which addresses air pollution gradients near roads. Traffic emissions are highest at the point of release and typically diminish to near background levels within 150 to 300 meters of the roadway (7,9,10); however, the potential exposure zone around roads can vary considerably depending on the pollutant, traffic volume, ambient pollution concentrations, meteorologic conditions, topography, and land use (5). Traffic exposure metrics in the published literature have used a variety of different density and distance cut-points (6). Nevertheless, numerous epidemiologic studies have consistently demonstrated that living close to major roads or in areas of high traffic density is associated with adverse health effects, including asthma, chronic obstructive pulmonary disease, and other respiratory symptoms (11–15); cardiovascular disease risk and outcomes (16–20); adverse reproductive outcomes (21,22); and mortality (23–25). Some studies have observed a dose-response gradient such that living closer to major roads is associated with increased risk (13,14,16–18). In terms of traffic density, several studies have reported adverse health effects associated with residential proximity to roads with average daily traffic volume as low as 10,000 vehicles per day (6,11,15–17).
In the United States, it is widely accepted that economically disadvantaged and minority populations share a disproportionate burden of air pollution exposure and risk (26,27). A growing body of evidence demonstrates that minority populations and persons of lower socioeconomic status experience higher residential exposure to traffic and traffic-related air pollution than nonminorities and persons of higher socioeconomic status (5,28–31). Two recent studies have confirmed that these racial/ethnic and socioeconomic disparities also exist on a national scale (32,33).
This report is part of the second CDC Health Disparities and Inequalities Report (CHDIR). The 2011 CHDIR (34) was the first CDC report to assess disparities across a wide range of diseases, behavior risk factors, environmental exposures, social determinants, and health-care access. The topic presented in this report is based on criteria that are described in the 2013 CHDIR Introduction (35). This report provides descriptive data on residential proximity to major highways, a topic that was not discussed in the 2011 CHDIR. The purposes of this report are to discuss and raise awareness of the characteristics of persons exposed to traffic-related air pollution and to prompt actions to reduce disparities.
Methods
To characterize the U.S. population living close to major highways, CDC examined data from several sources using Geographical Information Systems (GIS). Three data sources were used for this assessment: 1) the 2010 U.S. census (available at http://www.census.gov/2010census), 2) 2006–2010 American Community Survey (ACS) 5-year estimates (available at http://www.census.gov/acs), and 3) 2010 (Quarter 3) road network data from NAVTEQ, a commercial data source that provides comprehensive road information for the United States (available at http://www.navteq.com). Seven sociodemographic variables were examined. Data on age, sex, and race/ethnicity were obtained from the 2010 census; data on nativity, language spoken at home, educational attainment, and poverty status were obtained from the ACS.
The U.S. Census Bureau collects data on race and ethnicity (i.e., Hispanic origin) as two separate questions. For this analysis, persons of non-Hispanic ethnicity were classified as white, black, Asian/Pacific Islander, American Indian/Alaska Native, other race, and multiple races. Persons of Hispanic ethnicity, who might be of any race or combination of races, were grouped together as a single category. Educational attainment was defined as less than high school, high school graduate or equivalent, some college, or college graduate. For the variable nativity, "native born" includes U.S. citizens born abroad (one or both of whose parents were citizens at the time of birth) and anyone born in the United States or a U.S. territory; "foreign-born" denotes persons who were not U.S. citizens at birth. Poverty status was categorized by using the ratio of income to the federal poverty level (FPL), in which "poor" is <1.0 times FPL, "near poor" is 1.0–2.9 times FPL, and "nonpoor" is ≥3.0 times FPL.
Major highways were defined as interstates (Class 1) or as other freeways and expressways (Class 2) based on the Federal Highway Administration (FHWA) Functional Classification system. These road types represent the most heavily-trafficked, controlled-access highways in the United States. Although traffic volume is not factored directly into the Functional Classification system, FHWA statistics indicate that the majority of major highways have average daily traffic volumes exceeding 10,000 vehicles per day (i.e., 77% of rural interstates have >10,000 vehicles per day and >72% of urban interstates and other freeways and expressways have >30,000 vehicles per day) (36).
The census tract is the smallest geographic unit of analysis available for the variables of interest in the ACS data. ESRI ArcGIS v10 GIS software was used to create circular buffers of 150 meters around all major highways, and the proportion of each census tract included within the buffer area was calculated. This area proportion was then applied to the census tract-level data from the 2010 census and ACS to estimate the number of persons living within 150 meters of a major highway for the total population and by sociodemographic characteristics. Census tract count estimates were summed to obtain state and national estimates. The proportion of the population living within 150 meters of a major highway was calculated for each category of the seven sociodemographic variables, using category-specific denominators derived from the 2010 census and ACS. No sampling error is associated with the 100% population counts obtained from the 2010 census. Standard errors were not calculated for the estimated population counts derived from the ACS because of the complexity of the GIS analysis used to generate these data. Therefore, for this descriptive analysis, no statistical testing or calculation of 95% confidence intervals was conducted, and it was not possible to determine if the observed differences across population subgroups are statistically significant.
Results
Approximately 11.3 million persons (or 3.7% of the 308.7 million U.S. population) live within 150 meters of a major highway. State-level estimates ranged from 1.8% in Maine to 5.6% in New York (Figure). Regional patterns, based on U.S. Census Bureau groupings, indicate that the estimated proportion of the population living within 150 meters of a major highway ranged from 3.1% in the Midwest and 3.3% in the South to 4.3% in the Northeast and 4.4% in the West. The proportion of the population living near a major highway did not differ by sex (Table). By age group, the estimated proportion of persons living close to a major highway varied from 3.4% among those aged 45–79 years to ≥4.0% among those aged 18–34 years.
The greatest disparities were observed for race/ethnicity, nativity, and language spoken at home; the populations with the highest estimated percentage living within 150 meters of a major highway included members of racial and ethnic minority communities, foreign-born persons, and persons who speak a language other than English at home (Table). The estimated percentage of the population living within 150 meters of a major highway ranged from a low of 2.6% for American Indians/Alaska Natives and 3.1% for non-Hispanic whites to a high of 5.0% for Hispanics and 5.4% for Asians/Pacific Islanders. Likewise, the estimated proportion of the population living near a major highway was 5.1% for foreign-born persons, 5.1% for persons who speak Spanish at home, and 4.9% for persons who speak another non-English language at home.
Disparities by educational attainment and poverty status were less pronounced (Table). The estimated percentage of the population living near a major highway varied from 3.4% for high school graduates to 4.1% for those with less than a high school diploma. A more consistent pattern was observed for poverty status; the estimated proportion of the population living near a major highway was 4.2% for those in the poor category, 3.7% for those in the near-poor category, and 3.5% for those in the nonpoor category.
Discussion
Overall, approximately 4% of the total U.S. population lives within 150 meters of a major highway, suggesting increased exposure to traffic-related air pollution and elevated risk for adverse health outcomes. Estimates of residential proximity to major roads are influenced by the number and type of roads and the distance or buffer size used. In terms of quantifying the total U.S. population exposed to traffic-related air pollution, the estimate of 11.3 million people derived from this analysis should be considered conservative because only interstates, freeways, and expressways were included and a relatively small buffer distance of 150 meters was used. These conditions were selected to capture persons who are at the highest risk for exposure to traffic-related air pollution. In addition, this estimate is based on distance to a single road and does not account for cumulative exposure to traffic from multiple roads.
The percentage of the population exposed to traffic-related air pollution is expected to be larger in urban areas because of higher population density, more roads, and higher traffic volume. A case study of two North American cities (Los Angeles County and Toronto, Canada) estimated that 30%–45% of the population in these urban areas lives within 500 meters of a highway or 50–100 meters of a major road (5). Although this report does not address urban/rural differences directly, an additional state-level analysis of these data indicated that the percentage of the population living within 150 meters of a major highway was correlated positively (R = 0.65) with the percentage of the population living in urban areas. Additional studies are needed to understand potential sociodemographic disparities among populations living near major highways across levels of urbanization.
This analysis suggests that social and demographic disparities exist with respect to residential proximity to major highways. Larger disparities were observed for indicators of minority status (i.e., race/ethnicity, nativity, and language spoken at home) than for traditional indicators of socioeconomic status (i.e., poverty and educational attainment). Two other national studies have reported similar findings using alternative approaches. A study that examined the distribution of sociodemographic variables across various traffic exposure metrics assessed at the residential address found that race, ethnicity, poverty status, and education all were associated with one or more traffic exposure metrics (32). Another study demonstrated that the correlation between traffic exposure metrics and sociodemographic variables across all U.S. census tracts was stronger for race and ethnicity than it was for poverty, income, and education and that the magnitude of the correlations varied spatially by region and state (33).
The environmental justice literature suggests that socially disadvantaged groups might experience a phenomenon known as "triple jeopardy" (37). First, poor and minority groups are known to suffer negative health effects from social and behavioral determinants of health (e.g., psychosocial stress, poor nutrition, and inadequate access to health care). Second, as suggested in this analysis, certain populations (e.g., members of minority communities, foreign-born persons, and persons who speak a non-English language at home) might be at higher risk for exposure to traffic-related air pollution as a result of residential proximity to major highways. Third, there is evidence suggesting a multiplicative interaction between the first two factors, such that socially disadvantaged groups experience disproportionately larger adverse health effects from exposure to air pollution (37–39).
Limitations
The findings in this report are subject to at least three limitations. First, the area-proportion technique used assumes a homogeneous population density and population distribution by sociodemographic characteristics within each census tract, which might result in erroneous count estimates. The direction of the bias (overestimate or underestimate) could differ across population subgroups. For example, if socioeconomic disparities associated with residential proximity to major highways exist within census tracts, then the calculated percentages for minority subgroups might be underestimated and those for nonminority subgroups might be overestimated. Second, living within 150 meters of a major highway is only a surrogate for exposure to traffic-related air pollution. This study did not address the following factors that could affect exposure to traffic-related air pollution: number and type of vehicles traveling on major highways, cumulative effect of living near multiple roads, individual time-activity patterns (e.g., time spent at home vs. away, time spent inside vs. outside), meteorologic conditions, topography, and land-use patterns. Finally, it was not possible to perform testing to determine if the differences in the estimated percentages across population subgroups were statistically significant. However, the findings are consistent with other published research (32,33).
Conclusion
Primary prevention strategies to reduce traffic emissions include improving access to alternative transportation options (e.g., transit, rideshare programs, walking, and cycling), financial incentives to reduce vehicle miles traveled and congestion, diesel retrofitting, and promoting the use of electric and low emission vehicles. In addition, secondary prevention strategies to reduce exposure to traffic emissions include mitigation techniques for existing homes and buildings (e.g., roadside barriers and improved ventilation systems) and land-use policies that limit new development close to heavily-trafficked roads. For example, a recent study of roadside barriers suggests that solid barriers (i.e., noise barriers) might be more effective at mitigating traffic-related air pollution than vegetative barriers (i.e., tree stands) (41). In California, public health law has been used to restrict siting of new schools near major highways and busy traffic corridors (California Education Code §7213.c.2.C). Implementation of these strategies can help reduce exposures to traffic-related air pollution and health risks associated with these exposures.
Focusing prevention and mitigation interventions in urban areas, where there is a higher concentration of traffic-related air pollution and a greater proportion of the population residing near major roads, and in areas with the most socially disadvantaged populations will likely result in larger health benefits (37). Future and ongoing efforts to address disparities in residential proximity to major highways and traffic-related air pollution exposures will require an interdisciplinary collaboration between transportation, urban planning, and public health specialists.
References
- US Environmental Protection Agency. Integrated science assessment for carbon monoxide. Report No. EPA/600/R-09/019F. Research Triangle Park, NC: US Environmental Protection Agency; 2010.
- US Environmental Protection Agency. Integrated science assessment for particulate matter. Report No. EPA/600/R-08/139F. Research Triangle Park, NC: US Environmental Protection Agency; 2009.
- US Environmental Protection Agency. Integrated science assessment for oxides of nitrogen—health criteria. Report No. EPA/600/R-08/071. Research Triangle Park, NC: US Environmental Protection Agency; 2008.
- US Environmental Protection Agency. Air quality criteria for ozone and related photochemical oxidants. Report No. EPA/600/R-05/004aF. Research Triangle Park, NC: US Environmental Protection Agency; 2006.
- HEI Panel on the Health Effects of Traffic-Related Air Pollution. Traffic-related air pollution: a critical review of the literature on emissions, exposure, and health effects. HEI Special Report 17. Boston, MA: Health Effects Institute; 2010.
- Boothe VL, Shendell DG. Potential health effects associated with residential proximity to freeways and primary roads: review of scientific literature, 1999–2006. J Environ Health 2008;70:33–41.
- Brugge D, Durant JL, Rioux C. Near-highway pollutants in motor vehicle exhaust: a review of epidemiologic evidence of cardiac and pulmonary health risks. Environ Health 2007;6:23.
- Rioux CL, Gute DM, Brugge D, Peterson S, Parmenter B. Characterizing urban traffic exposures using transportation planning tools: an illustrated methodology for health researchers. J Urban Health 2010;87:167–88.
- Gilbert NL, Woodhouse S, Stieb DM, Brook JR. Ambient nitrogen dioxide and distance from a major highway. Sci Total Environ 2003;312:43–6.
- Zhu YF, Hinds WC, Kim S, Sioutas C. Concentration and size distribution of ultrafine particles near a major highway. J Air Waste Manag Assoc 2002;52:1032–42.
- Garshick E, Laden F, Hart JE, et al. Residence near a major road and respiratory symptoms in U.S. Veterans. Epidemiology 2003;14:728–36.
- Gauderman WJ, Vora H, McConnell R, et al. Effect of exposure to traffic on lung development from 10 to 18 years of age: a cohort study. Lancet 2007;369(9561):571–7.
- Kim JJ, Huen K, Adams S, et al. Residential traffic and children's respiratory health. Environ Health Perspect 2008;116:1274–9.
- McConnell R, Berhane K, Yao L, et al. Traffic, susceptibility, and childhood asthma. Environ Health Perspect 2006;114:766–72.
- Schikowski T, Sugiri D, Ranft U, et al. Long-term air pollution exposure and living close to busy roads are associated with COPD in women. Respir Res 2005;6:152.
- Hoffmann B, Moebus S, Mohlenkamp S, et al. Residential exposure to traffic is associated with coronary atherosclerosis. Circulation 2007;116:489–96.
- Hoffmann B, Moebus S, Stang A, et al. Residence close to high traffic and prevalence of coronary heart disease. Eur Heart J 2006;27:2696–702.
- Kan H, Heiss G, Rose KM, Whitsel EA, Lurmann F, London SJ. Prospective analysis of traffic exposure as a risk factor for incident coronary heart disease: the Atherosclerosis Risk in Communities (ARIC) study. Environ Health Perspect 2008;116:1463–8.
- Tonne C, Melly S, Mittleman M, et al. A case-control analysis of exposure to traffic and acute myocardial infarction. Environ Health Perspect 2007;115:53–7.
- Van Hee VC, Adar SD, Szpiro AA, et al. Exposure to traffic and left ventricular mass and function: the Multi-Ethnic Study of Atherosclerosis. Am J Respir Crit Care Med 2009;179:827–34.
- Wilhelm M, Ritz B. Residential proximity to traffic and adverse birth outcomes in Los Angeles county, California, 1994–1996. Environ Health Perspect 2003;111:207–16.
- Yorifuji T, Naruse H, Kashima S, et al. Residential proximity to major roads and preterm births. Epidemiology 2011;22:74–80.
- Gehring U, Heinrich J, Kramer U, et al. Long-term exposure to ambient air pollution and cardiopulmonary mortality in women. Epidemiol 2006;17:545–51.
- Jerrett M, Finkelstein MM, Brook JR, et al. A cohort study of traffic-related air pollution and mortality in Toronto, Ontario, Canada. Environ Health Perspect 2009;117:772–7.
- Medina-Ramon M, Goldberg R, Melly S, et al. Residential exposure to traffic-related air pollution and survival after heart failure. Environ Health Perspect 2008;116:481–5.
- Bell ML, O'Neill MS, Cifuentes LA, et al. Challenges and recommendations for the study of socioeconomic factors and air pollution health effects. Environ Sci Pol 2005;8:525–33.
- O'Neill MS, Jerrett M, Kawachi L, et al. Health, wealth, and air pollution: advancing theory and methods. Environ Health Perspect 2003;111:1861–70.
- Apelberg BJ, Buckley TJ, White RH. Socioeconomic and racial disparities in cancer risk from air toxics in Maryland. Environ Health Perspect 2005;113:693–9.
- Brender JD, Maantay JA, Chakraborty J. Residential proximity to environmental hazards and adverse health outcomes. Am J Public Health 2011;101:S37–52.
- Chakraborty J. Automobiles, air toxics, and adverse health risks: environmental inequities in Tampa Bay, Florida. Ann Assoc Am Geogr 2009;99:674–97.
- Gunier RB, Hertz A, Von Behren J, Reynolds P. Traffic density in California: socioeconomic and ethnic differences among potentially exposed children. J Expo Anal Environ Epidemiol 2003;13:240–46.
- Parker JD, Kravets N, Nachman K, Sapkota A. Linkage of the 1999–2008 National Health and Nutrition Examination Surveys to traffic indicators from the National Highway Planning Network. National health statistics reports; No. 45. Hyattsville, MD: US Department of Health and Human Services, CDC, National Center for Health Statistics; 2012.
- Tian N, Xue J, Barzyk TM. Evaluating socioeconomic and racial differences in traffic-related metrics in the United States using a GIS approach. J Expo Sci Environ Epidemiol 2013;23:215–22.
- CDC. CDC health disparities and inequalities report—United States, 2011. MMWR 2011;60(Suppl; January 14, 2011).
- CDC. Introduction. In: CDC health disparities and inequalities report—United States, 2013. MMWR 2013;62(No. Suppl 3).
- US Department of Transportation. Highway statistics 2008. Table HM-57: length by average daily traffic volume, arterials and collectors. Washington, DC: Federal Highway Administration; 2009. Available at http://www.fhwa.dot.gov/policyinformation/statistics/2008.
- Jerrett M, Burnett RT, Kanaroglou P, et al. A GIS- environmental justice analysis of particulate air pollution in Hamilton, Canada. Environment and Planning A 2001;33:955–73.
- Cakmak S, Dales RE, Rubio MA, Vidal CB. The risk of dying on days of higher air pollution among the socially disadvantaged elderly. Environ Res 2011;111:388–93.
- Ou C-Q, Hedley AJ, Chung RY, et al. Socioeconomic disparities in air pollution-associated mortality. Environ Res 2008;107:237–44.
- Panel on the Functionality and Usability of Data from the American Community Survey. Using the American Community Survey: benefits and challenges. Washington, DC: National Academies Press; 2007.
- Hagler GSW, Lin MY, Khlystov A, et al. Field investigation of roadside vegetative and structural barrier impact on near-road ultrafine particle concentrations under a variety of wind conditions. Sci Total Environ 2012;419:7–15.
FIGURE. Percentage* of population living within 150 meters of a major highway, by state — United States, 2010
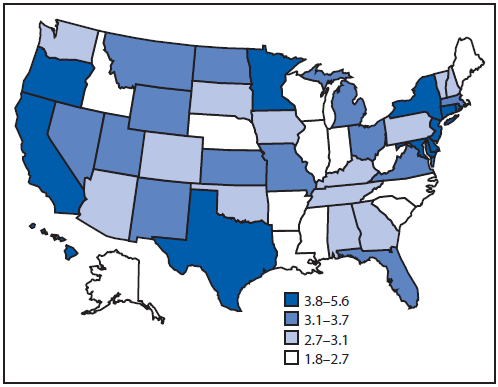
* Calculated by dividing the population within 150 meters of a major highway by the total population per state and multiplying by 100. The percentages are displayed using quartiles.
Alternate Text: The figure shows the percentage of the U.S. population living within 150 meters of a major highway, by state in 2010. The percentage was calculated by dividing the total population within 150 meters of a major highway by the total population per state and multiplying by 100. The percentages are displayed using quartiles.
|
TABLE. Number and percentage of population living within 150 meters of a major highway, by selected characteristics — United States, 2010 |
||
|---|---|---|
|
Characteristic |
No. |
(%)* |
|
Total† |
11,337,933 |
(3.7) |
|
Sex† |
||
|
Male |
5,547,223 |
(3.7) |
|
Female |
5,790,844 |
(3.7) |
|
Age group (yrs)† |
||
|
0–4 |
766,603 |
(3.8) |
|
5–9 |
727,279 |
(3.6) |
|
10–17 |
1,168,995 |
(3.5) |
|
18–24 |
1,219,887 |
(4.0) |
|
25–34 |
1,714,903 |
(4.2) |
|
35–44 |
1,523,607 |
(3.7) |
|
45–64 |
2,808,121 |
(3.4) |
|
65–79 |
977,948 |
(3.4) |
|
≥80 |
412,215 |
(3.7) |
|
Race/Ethnicity† |
||
|
Non-Hispanic |
||
|
White |
6,030,811 |
(3.1) |
|
Black |
1,676,225 |
(4.4) |
|
Asian/Pacific Islander |
800,723 |
(5.4) |
|
American Indian/Alaska Native |
59,378 |
(2.6) |
|
Other |
27,239 |
(4.5) |
|
Multiple race |
235,995 |
(4.0) |
|
Hispanic§ |
2,502,616 |
(5.0) |
|
Nativity¶ |
||
|
Native born** |
9,172,481 |
(3.5) |
|
Foreign born†† |
1,966,763 |
(5.1) |
|
Language spoken at home (≥5 yrs)¶ |
||
|
English only |
7,513,304 |
(3.3) |
|
Spanish |
1,805,261 |
(5.1) |
|
Other |
1,059,572 |
(4.9) |
|
Educational attainment (≥25 years)¶ |
||
|
Less than high school |
1,225,735 |
(4.1) |
|
High school graduate or equivalent |
1,988,228 |
(3.4) |
|
Some college |
1,977,261 |
(3.5) |
|
College graduate |
2,092,232 |
(3.8) |
|
Poverty status¶,§§ |
||
|
Poor (<1.0 times FPL) |
1,733,031 |
(4.2) |
|
Near-poor (1.0–2.9 times FPL) |
3,882,694 |
(3.7) |
|
Nonpoor (≥3.0 times FPL) |
5,227,274 |
(3.5) |
|
Abbreviation: FPL = federal poverty level. * Denominator for overall population is 308,745,348. Percentages for all other rows were calculated by using category-specific denominators. † Source: U.S. Census Bureau, 2010 census (available at http://www.census.gov/2010census). § Persons of Hispanic ethnicity might be of any race or combination of races. ¶ Source: U.S. Census Bureau, 2006–2010 American Community Survey (available at http://www.census.gov/acs). ** Includes U.S. citizens born abroad (one or both of whose parents were citizens at the time of birth) and anyone born in the United States or a U.S. territory. †† Persons who were not U.S. citizens at birth. §§ Additional information is available at http://aspe.hhs.gov/poverty/figures-fed-reg.cfm. |
||
Use of trade names and commercial sources is for identification only and does not imply endorsement by the U.S. Department of
Health and Human Services.
References to non-CDC sites on the Internet are
provided as a service to MMWR readers and do not constitute or imply
endorsement of these organizations or their programs by CDC or the U.S.
Department of Health and Human Services. CDC is not responsible for the content
of pages found at these sites. URL addresses listed in MMWR were current as of
the date of publication.
All MMWR HTML versions of articles are electronic conversions from typeset documents.
This conversion might result in character translation or format errors in the HTML version.
Users are referred to the electronic PDF version (http://www.cdc.gov/mmwr)
and/or the original MMWR paper copy for printable versions of official text, figures, and tables.
An original paper copy of this issue can be obtained from the Superintendent of Documents, U.S.
Government Printing Office (GPO), Washington, DC 20402-9371;
telephone: (202) 512-1800. Contact GPO for current prices.
**Questions or messages regarding errors in formatting should be addressed to
mmwrq@cdc.gov.
