Persons using assistive technology might not be able to fully access information in this file. For assistance, please send e-mail to: mmwrq@cdc.gov. Type 508 Accommodation and the title of the report in the subject line of e-mail.
Expected Years of Life Free of Chronic Condition–Induced Activity Limitations — United States, 1999–2008
Corresponding author: Michael T. Molla, National Center for Health Statistics, CDC. Telephone: 301-458-4379; E-mail: MMolla@cdc.gov.
Introduction
Over the 20th century, the U.S. population has witnessed major changes in fatal and nonfatal health outcomes. Mortality has declined, and life expectancy has increased continuously; chronic conditions have replaced acute diseases as leading causes of both illness and death (1). During 1900–2008, average life expectancy at birth for the total U.S. population increased from 47.3 years in 1900 to 78.1 years in 2008 (2), a gain of 30.8 years. In addition, an increasing proportion of the U.S. population is aged >65 years. According to the U.S. Census Bureau estimates, at the beginning of the 20th century, the U.S. population aged >65 years constituted only 4.1 percent of the total population; by 2008, the percentage of the total U.S. population aged >65 years was 12.8% (3,4). However, declines in mortality are not necessarily associated with declines in morbidity or the consequences of chronic conditions on life activities. The possibility that longer life might be accompanied by poor health makes it essential to develop measures that account for both mortality and morbidity at the same time. Hence, over the past 40 years, a new set of health measures (e.g., "healthy life expectancies") have been developed that account for both mortality and life spent free of the consequences of ill health. One of these newly developed set of measures (called "active life expectancy") is the average number of years expected to be lived without activity limitations.
In general, being "active" entails the continuing participation of a person in social, economic, cultural, spiritual, and civic affairs (5). In health studies, the context in which "being active" has been used has varied depending on the population group under study (6–9). In this report, "active" is used to differentiate between a person with limitations in social roles and one without such limitations. This analysis focuses on activity limitations caused by chronic conditions. Active life expectancy or active life at any age is defined as the remaining years of life free of activity limitations (YFAL) caused by chronic conditions.
This report is part of the second CDC Health Disparities and Inequalities Report (CHDIR). The 2011 CHDIR (10) was the first CDC report to assess disparities across a wide range of diseases, behavior risk factors, environmental exposures, social determinants, and health-care access. The topic presented in this report is based on criteria that are described in the 2013 CHDIR Introduction (11). This report provides information on disparities in YFAL as a result of chronic conditions, a topic that was not discussed in the 2011 CHDIR. The purposes of this report are to discuss and raise awareness of differences in the characteristics of persons who experience chronic condition–induced physical activity limitations and to prompt actions to reduce these disparities.
Methods
To assess disparities in YFAL as a result of chronic conditions, CDC analyzed data from the National Vital Statistics System (NVSS) and the National Health Interview Survey (NHIS). Demographic variables analyzed included sex and race. Period life tables for males and females and for the white and black populations of the United States for each year from 1999 through 2008 come from CDC's National Center for Health Statistics (NCHS). Expected years free of chronic condition–induced activity limitations by ethnicity, environmental, or behavior risk factors and socioeconomic determinants of access to health care were not included in this analysis because officially released NCHS life expectancy estimates by these and other similar factors for the years 1999 through 2008 were not available. Hence, because officially released annual life tables by ethnicity were not available for all the 10 years of the study period, the expected YFAL for Hispanics, non-Hispanic whites, and non-Hispanic blacks were not analyzed separately. The racial category "white" includes person of Hispanic origin who identified themselves as white, and the racial category "black" includes persons of Hispanic origin who identified themselves as black.
Data on activity status come from NHIS, which defines an activity limitation as a limit on a person's ability to perform activities normally expected of someone of his or her age. Depending on how they answered questions on activity status, survey respondents were classified into four categories: 1) not limited, 2) unable to perform major activity, 3) limited in kind or amount of major activity, and 4) limited in other activities. Whenever any form of activity limitation was identified, NHIS survey participants also were asked the health condition causing the limitation, and the cause was classified as chronic or nonchronic. Conditions were considered chronic if they cannot be cured once acquired or had existed continuously for >3 months after onset (12).
Expected years of life with and without chronic condition–induced activity limitations were estimated by using a demographic-epidemiologic model (13–16) that combined average life expectancy and the prevalence of being with and without chronic condition–induced activity limitation. The expected years without any activity limitations then were used to calculate the percentage of remaining life expected to be lived without such limitations. Expected years of life with and without chronic condition–induced activity limitations were estimated separately for four population subgroups: males, females, whites, and blacks. The definition of standard error of expected YFAL and the statistical test and level of significance used have been summarized (Appendix).
Disparities were measured as the deviations from a "referent" category rate or prevalence. Absolute difference was measured as the simple difference between the rate for a population subgroup and the rate for its respective reference group. The relative difference, a percentage, was calculated by dividing the absolute difference by the value in the referent category and multiplying by 100. Whether a disparity in expected YFAL between a male and a female or between a white person and a black person of the same age was statistically significant was tested by using a 2-tailed test at the 95% level of significance. A hypothesis of equality was rejected if the value of the absolute value of the z-score exceeded 1.96.
Results
During 1999–2008, total life expectancy improved (Table 1). During this 10-year period, total life expectancy at birth for males increased by 1.7 years, from 73.9 years in 1999 to 75.6 years in 2008, and female life expectancy at birth increased by 1.2 years, from 79.4 years in 1999 to 80.6 years in 2008. Expectation of life at birth for the white population increased by 1.2 years, from 77.3 years in 1999 to 78.5 years in 2008. Life expectancy for the black population increased by 2.6 years, from 71.4 years in 1999 to 74.0 years in 2008.
The percentage of total life expectancy that was estimated to be spent free of chronic condition–induced activity limitations fluctuated over the 10-year period, with the percentage of life expectancy spent free of activity limitations slightly lower in 2008 than in 1999. For males, the percentage of life expected to be free of activity limitations was 86.5% in 1999 and declined to 86.1% in 2008. In 1999, blacks expected to spend about 82.9% of their total expected life free of activity limitations compared with 82.6% in 2008. For whites, the percentage of life expected to be spent free of activity limitations declined from 85.6% in 1999 to 85.4% in 2008, while it remained almost the same for females (84.5% in 1999 and 84.4% in 2008).
In 1999, males would expect to spend 63.9 of their 73.9 years of life expectancy free of chronic condition–induced activity limitations compared with 67.1 years out of 79.4 years of total expected years of life free of such limitations for females. The white and black populations would expect to spend 66.2 years of 77.3 years of total life expectancy and 59.2 years of 71.4 years of total life expectancy respectively free of chronic condition–induced activity limitations.
By 2008, males would expect to live 65.1 years out of total expected years of life of 75.6 years free of activity limitations. Females would expect to live 68.0 years of the total life expectancy of 80.6 years limitation-free. The white and black populations would expect to live 67 activity limitation–free years (out of a total life expectancy of 78.5 years) and 61.1 activity limitation–free years (out of a total life expectancy of 74.0 years) respectively.
Over the 10 years, improvements in the expected YFAL were observed (Table 2). The increase in expected YFAL caused by chronic conditions during the 10-year period was 1.2 years for males (from 63.9 years in 1999 to 65.1 years in 2008), 0.9 years for females (from 67.1 years in 1999 to 68.0 years in 2008), 0.8 years for whites (from 66.2 years in 1999 to 67.0 years in 2008), and 1.9 years for blacks (from 59.2 in 1999 to 61.1 years in 2008). In the 10-year period, the black population had the largest increase both in life expectancy at birth as well as in expected YFAL caused by chronic conditions.
The changes in the differences in YFAL caused by chronic conditions between males and females and between whites and blacks from 1999 to 2008 have been calculated (Figure). In 1999, the difference in expected YFAL at birth between the white and the black populations was 7 years (Figure), and the difference between males and females was 3.2 years. After 10 years, the difference between the white and the black populations had decreased to 5.9 years, and the difference between males and females had dropped to 2.9 years.
During the 10-year period, the disparity between the white and the black populations declined by 1.1 years, and the disparity between males and females dropped by slightly more than 0.3 years. However, the observed disparities in expected YFAL caused by chronic conditions between men and women as well as that between whites and blacks remained statistically significant at the 5% level throughout the 10-year period (Table 2).
Discussion
Between 1999 and 2008, life expectancy and expected YFAL at birth increased for all the population subgroups indicating the expected improvements both in mortality and quality of life. For males, life expectancy at birth increased from 73.9 in 1999 to 75.6 years in 2008. For females, life expectancy increased from 79.4 years in 1999 to 80.4 years in 2008. For the white population, life expectancy increased from 77.3 years in 1999 to 78.5 years in 2008, and for the black population, it increased from 71.4 years in 1999 to 74.0 years in 2008. During the same 10-year period, expected male YFAL at birth increased from 63.9 years in 1999 to 65.1 years in 2008. For females, expected YAFL at birth increased from 67.1 years in 1999 to 68.0 years in 2008. For the white population, expected YFAL at birth increased from 66.2 years in 1999 to 67.0 years in 2008, and for the black population, it increased from 59.2 years in 1999 to 61.1 years in 2008.
Significant disparities in expected YFAL existed between males and females as well as between the white and the black populations throughout the 10-year period. However, the disparities in expected YFAL have been declining throughout the course of the 10-year period. Disparities in YFAL between males and females decreased by 0.3 year, from 3.2 years in 1999 to 2.9 years in 2008. In the same period, disparities between the white and the black populations decreased by more than one year from 7.0 years in 1999 to 5.9 years in 2008. These results are consistent with results of other similar studies and federal government health reports (17–18).
The 10-year health initiative Healthy People 2010 had as its two overarching goals when it was launched in 2000 increasing the quality and years of healthy life of the U.S. population and eliminating health disparities. The final assessment of this initiative has concluded that during the 10-year period 2000–2010, life expectancy improved for the populations that could be assessed; women had longer life expectancy than men, and the white population had a longer life expectancy than the black population; and differences were observed both by race and sex in life expectancy measure (at birth) and expected YFAL. On the basis of data from 2006–2007, on average, the U.S. population was expected to spend 66.2 years of their entire lives free of activity limitations (19).
During 1999–2008, expected YFAL caused by chronic conditions increased for both males and females and for both blacks and whites. During the entire 10 years, although disparities in expected YFAL existed between males and females as well as between whites and blacks, the extent of these disparities declined during the 10-year period.
Limitations
The findings provided in this report are subject to at least two limitations. First, estimates of expected YFAL caused by chronic conditions are based on current life expectancy estimates and the prevalence of activity limitations. Annual life expectancy estimates are based on the total U.S. population whereas prevalence rates on activity limitations come from NHIS, which does not include the institutionalized population of the United States. However, because the size of this population is very small compared with the total household population, the effect of the exclusion of the group on the comparison of estimates over time is assumed to be minimal. Second, estimates in this analysis might have been sensitive to the operational definition of expected YFAL caused by chronic conditions. Activity limitation is part of a larger continuum process known as the "disablement process." Hence, whenever measures such as activity limitations induced by chronic conditions (which are discrete in nature) are used, cut-off points on the continuum have to be determined to differentiate those with and without limitations. These cut-off points are functions of the operational definitions and might vary from one study to another. Although the estimates could be sensitive to these operational definitions, the effect of such definitions on the comparison of estimates over time is assumed to be minimal.
Conclusion
The findings provided in this report indicate that during the 10-year period 1999–2008, while disparities in expected years free of chronic condition caused activity limitations still existed between males and females as well as between the white and the black populations, expected YFAL increased for all four population subgroups studied, and disparities decreased. Increasing the length of life, improving the quality of life, and eliminating health disparities among population groups have been the major health goals of all the Healthy People initiatives since the decade-long health programs were initiated with the publication of the Surgeon General 's Report on Health Promotion and Disease Prevention in 1979 (20).
The overarching goals of the first Healthy People initiative were to decrease mortality and increase independence among older adults by 1990. The first two of the three major goals of the second 10-year health initiative (Healthy People 2000) were to increase the span of healthy life and to reduce disparities in health status (21). Healthy People 2010 focused on two major goals: to increase quality of years of healthy life and to eliminate health disparities. Healthy People 2020, the fourth 10-year national health initiative, has four major goals, one of which focuses on achieving health equity by eliminating health disparities.
The findings of this report as well as reports of the first three Healthy People programs demonstrate that expected years of life are getting longer, health-related quality of life is improving, and health disparities between population groups are decreasing. However, group comparisons also demonstrate that disparities in mortality (as measured by expectation of life at birth) and health-related quality of life (as measured by expected YFAL caused by chronic conditions) still exist.
References
- Fries JF. Aging, natural death, and the compression of morbidity. N Engl J Med 1980;303:130–5.
- Miniño AM, Murphy SL, Xu J, Kochanek KD. Death: final data for 2008. Natl Vital Stat Rep 2011;59(10).
- US Census Bureau. Resident population estimates of the United States by age and sex: April 1, 1990 to July 1, 1999, with short-term projection to November 1, 2000. Washington, DC: US Census Bureau; 2001.
- US Census Bureau. Resident population—estimates by age, sex, and race: July 1, 1900 (excluding Alaska and Hawaii). Washington, DC: US Census Bureau; 2004.
- World Health Organization. Active ageing: a policy framework: a contribution of the second United Nations World Assembly on Ageing. Geneva, Switzerland: World Health Organization; 2002.
- Katz S, Branch LG, Branson MH, Papsidero JA, Beck JC, Greer DS. Active life expectancy. N Engl J Med 1983;309:1218–24.
- Manton KG, Stallard E. Cross-sectional estimates of active life expectancy for the U.S. elderly and oldest-old population. J Gerontol 1991;46(Suppl):S170–82.
- Crimmins EM, Hayward MD, Saito Y. Differentials in active life expectancy in the older population of the United States. J Gerontol 1996;51(Suppl):S111–20.
- Wolf DA, Laditka SB, Laditka JN. Patterns of active life among older women: differences within and between groups. J Women Aging 2002;14:9–26.
- CDC. CDC health disparities and inequalities report—United States, 2011. MMWR 2011;60(Suppl; January 14, 2011).
- CDC. Introduction: In: CDC health disparities and inequalities report—United States, 2013. MMWR 2013;62(No. Suppl 3).
- CDC. 2008 National Health Interview Survey (NHIS): public use data release. NHIS survey description. Hyattsville, MD: US Department of Health and Human Services, CDC, National Center for Health Statistics; 2009.
- Sanders BS. Measuring community health levels. Am J Public Health 1964;54:1063–70.
- Sullivan DF. A single index of mortality and morbidity. Health Services and Mental Health Administration. Health Reports 1971;86:347–54.
- Rogers A, Rogers RG, Belanger A. Longer life but worse health? Measurement and dynamics. Gerontologist 1990;30:640–9.
- Molla MT, Wagener DK, Madans JH. Summary measures of population health: methods for calculating healthy life expectancy. Healthy People 2010 Statistical Notes No 21. Hyattsville, MD: US Department of Health and Human Services, CDC, National Center for Health Statistics; 2001.
- Manton KG, Gu X, Lamb VL. Long-term trends in life expectancy and active life expectancy in the United States. Popul Dev Rev 2006;32:81–105.
- Molla MT, Madans JH. Life Expectancy free of chronic condition induced activity limitations among white and black Americans, 2000–2006. Vital Health Stat 2010;3(34).
- CDC. Healthy people 2010: final review. Atlanta, GA: US Department of Health and Human Services, US Public Health Service, CDC; 2011. Available at http://www.cdc.gov/nchs/data/hpdata2010/hp2010_final_review.pdf.
- Department of Health, Education, and Welfare, Public Health Service. Healthy people: the Surgeon General's report on health promotion and disease prevention. Washington, DC: Government Printing Office; 1979.
- US Department of Health and Human Services. Healthy people 2010: understanding and improving health. Washington, DC: US Department of Health and Human Services; 2000.
FIGURE. Disparities in expected (at birth) years free of activity limitations caused by chronic conditions, by race and sex — United States, 1999 and 2008
Source: National Vital Statistics System and National Health Interview Survey, 1999 and 2008.
Alternate Text: The figure shows disparities in expected (at birth) years free of activity limitations caused by chronic conditions, by race and sex for the white and black populations of the United States for 1999 and 2008. By race, white versus black disparities were 7.0 years in 1999 and 5.9 years in 2008. By sex, male versus female disparities were 3.2 years in 1999 and 2.9 years in 2008.
Appendix: Definition of Terms Used in This Report
Standard Errors for Expected Years Free of Activity Limitations
Expected years free of activity limitations (YFAL) (e'x) at age x is defined as the remaining years of life that is free of limitations caused by chronic conditions and is given by:
Alternate Text: The first equation is used to determine the remaining years of life that are free of limitations caused by chronic conditions where ex is the remaining years free of activity limitation due to chronic conditions for persons who have reached age x; lx is the number of survivors at age x; (1 - nπx) represents the age-specific health state free of activity limitations due to chronic conditions; nLx is the total number of years lived by a cohort in the age interval (x, x+n); and ω is the oldest age category.
where
e'x is the remaining years free of activity limitation due to chronic conditions for persons who have reached age x;
lx is the number of survivors at age x;
(1 - nπx) represents the age-specific health state free of activity limitations due to chronic conditions;
nLx is the total number of years lived by a cohort in the age interval (x, x+n); and
ω is the oldest age category.
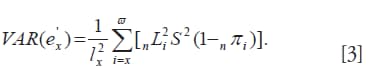
The variance and standard errors of the estimated YFAL can be calculated based on the variances of the prevalence rates of the different health states. Within each age group, the prevalence of each health state is a proportion with an associated standard error. Since there are only two health states, the variance of the health state with activity limitations equals to the variance of its complement. The variance S2 of (nπx ) or (1- nπx) is given by the variance of a binomial distribution as follows:
Alternate Text: The second equation presents how the variance and standard errors of estimated years free of activity limitation are calculated where nNx is the number of persons in the interval (x, x+n) of the sample from which the prevalence rates were computed.
where nNx is the number of persons in the interval (x, x+n) of the sample from which the prevalence rates were computed.
Equation 2 can then be used to calculate the variance of expected YFAL, ex using the following formula:
Alternate Text: Equation 2 can then be used to calculate the variance of expected YFAL using the third formula.
The standard error of the expected YFAL caused by chronic conditions at age x is simply the square root of its variance.
Test of Significance
Disparities between the expected years of life free of activity limitations of two population subgroups of the same age group can be tested by using a statistical method commonly used for testing the significance of a difference between two means using the following formula:
Alternate Text: The fourth formula is used to determine disparities between the expected years of life free of activity limitations of two population subgroups of the same age group; such disparities can be tested by using a statistical method commonly used for testing the significance of a difference between two means where ex,1 and ex,2 are the expected years free of activity limitations of two different population subgroups of the same age x.
where, e'x,1 and e'x,2 are the expected YFAL of two different population subgroups of the same age x.
The critical value of a z-score for a 2-tailed test at the 95% level of significance is 1.96, i.e., the hypothesis of equality is rejected if the absolute value of z exceeds 1.96.
Use of trade names and commercial sources is for identification only and does not imply endorsement by the U.S. Department of
Health and Human Services.
References to non-CDC sites on the Internet are
provided as a service to MMWR readers and do not constitute or imply
endorsement of these organizations or their programs by CDC or the U.S.
Department of Health and Human Services. CDC is not responsible for the content
of pages found at these sites. URL addresses listed in MMWR were current as of
the date of publication.
All MMWR HTML versions of articles are electronic conversions from typeset documents.
This conversion might result in character translation or format errors in the HTML version.
Users are referred to the electronic PDF version (http://www.cdc.gov/mmwr)
and/or the original MMWR paper copy for printable versions of official text, figures, and tables.
An original paper copy of this issue can be obtained from the Superintendent of Documents, U.S.
Government Printing Office (GPO), Washington, DC 20402-9371;
telephone: (202) 512-1800. Contact GPO for current prices.
**Questions or messages regarding errors in formatting should be addressed to
mmwrq@cdc.gov.
