Persons using assistive technology might not be able to fully access information in this file. For assistance, please send e-mail to: mmwrq@cdc.gov. Type 508 Accommodation and the title of the report in the subject line of e-mail.
Motor Vehicle--Related Deaths --- United States, 2003--2007
Motor vehicle crashes are the leading cause of death for persons in the United States aged 5--34 years (1). In 2007, approximately 44,000 persons were killed in motor vehicle crashes, and racial/ethnic minorities were affected disproportionally (1,2). Approximately 7% of all American Indian/Alaska Native (AI/AN) deaths and 5% of all Hispanic deaths are attributed to crashes, whereas crashes are the cause of death for<2% of blacks and whites (2).
To assess the extent of disparities in motor vehicle--related crashes among persons of all ages, CDC analyzed data from the National Vital Statistics System (NVSS). This report summarizes the results of that analysis, which examined racial/ethnic death rates from motor vehicle crashes by sex. AI/ANs and males had the highest motor vehicle--related death rates. Overall motor vehicle--related mortality can be reduced through increased adoption of evidence-based strategies, including primary seat belt laws (legislation allowing police to stop a vehicle solely for a safety belt violation), legislation for ignition interlock devices (devices that disable a vehicle's ignition after detection of alcohol in the driver's breath), and multicomponent programs with community mobilization (programs that include numerous components such as sobriety checkpoints, education and awareness-raising efforts, and training in responsible beverage service, as well as, an active community coalition) (3). Tailoring these strategies to the unique cultures of different racial/ethnic groups also can help reduce disparities in motor vehicle--related mortality (4,5).
NVSS data were accessed through the CDC Web-based Injury Statistics Query and Reporting System (WISQARS) online database, which provides customized reports of injury-related mortality data from CDC annual mortality data files (1). CDC mortality data are derived from the multiple cause of death data, which are based on death certificate records from vital statistics offices in all 50 states and the District of Columbia. Motor vehicle--related death data were examined for the most recent years available, 2003--2007. Bridged-race postcensal population estimates from the U.S. Census Bureau were used to calculate death rates (6). All reported death rates and corresponding confidence intervals are age adjusted to the 2000 standard U.S. population. Differences between death rates in 2003 and 2007 were compared using the z statistic based on a normal approximation, and p values <0.05 were considered statistically significant. Data were examined for all ages by race/ethnicity and sex. NVSS race categories were coded as white, black, AI/AN, and Asian/Pacific Islander (A/PI). Ethnicity was coded separately as Hispanic or non-Hispanic. Race/ethnicity was divided into five mutually exclusive categories: non-Hispanic whites, non-Hispanic blacks, non-Hispanic AI/ANs, non-Hispanic A/PIs, and Hispanics of all races. All Hispanics were grouped in the Hispanic category; therefore, references to race refer to non-Hispanic members of that race (e.g., blacks are non-Hispanic blacks). NVSS does not collect information on other characteristics such as income level; therefore disparities in motor vehicle-related deaths for other characteristics are not included in this report. In addition, this report does not assess geographical variations in death rates.
During 2007, the overall motor vehicle--related age-adjusted death rate was 14.5 deaths per 100,000 population. The death rate was highest among AI/ANs (29.1 per 100,000 population), approximately twice that of whites (15.0 per 100,000 population). For all racial/ethnic groups, males had death rates that were 2--3 times higher than the rates for females (21.5 per 100,000 population versus 8.8 for whites; 23.2 versus 7.3 for blacks; 40.0 versus 18.8 for AI/ANs; 9.5 versus 5.3 for A/PIs; and 19.5 versus 7.0 for Hispanics, for males and females, respectively) (Table, Figure 1).
During 2003--2007, AI/ANs consistently had the highest motor vehicle--related death rates among both males and females (Figures 2 and 3), a finding that is consistent with previous reports (7). Among males, AI/ANs had rates that were 2--4 times higher than the rates of other races/ethnicities, with annual rates of approximately 43 deaths per 100,000 population per year (Figure 2). Black males had the second-highest death rates (approximately 23 deaths per 100,000 population per year), followed by whites and Hispanics, who had similar rates (both approximately 21 deaths per 100,000 population per year). A/PI males consistently had the lowest death rates, with rates that were half those of whites and Hispanics (approximately 9--10 deaths per 100,000 population per year).
Among females, AI/ANs also had the highest motor vehicle--related death rates, with approximately 21 deaths per 100,000 population per year (Figure 3). White females had the second-highest death rates (approximately nine deaths per 100,000 population per year), followed by blacks and Hispanics, with A/PIs again having the lowest death rates (approximately six deaths per 100,000 population per year).
From 2003 to 2007, age-adjusted death rates remained relatively stable among all men except Hispanics (Table). Death rates among Hispanic men decreased significantly from 22.2 in 2003 to 19.5 in 2007 (p<0.001). Death rates for women of all races/ethnicities decreased significantly from 2003 to 2007, with the greatest decrease occurring among AI/AN women, whose death rate decreased from 25.0 in 2003 to 18.8 in 2007 (p<0.001).
During a motor vehicle crash, seat belts are one of the most effective tools available for avoiding severe injury and saving lives (8). Seat belt use has increased during the past 2 decades, from 58% in 1994 to 84% in 2009; however, millions of vehicle occupants still do not use belts (9,10). Racial/ethnic groups with the highest death rates also have higher proportions of risky motor vehicle behaviors, including seat belt nonuse and alcohol-impaired driving. For example, among persons killed in crashes, AI/ANs had the highest percentage of seat belt nonuse (75% of passenger vehicle occupants) followed by blacks (62%); A/PIs had the lowest percentage of nonuse (31%) (11).
Within racial/ethnic groups, driver age is also an important factor affecting the likelihood of restraint use. Although adolescents have the highest percentage of restraint nonuse overall, the percentages vary by racial/ethnic group. Among students in grades 9--12, AI/ANs have the highest percentage of self-reported seat belt nonuse (13.6%), followed by blacks (11.7%), whites (9.5%), Hispanics (8.8%), and Asians (7.0%) (12). Moreover, in fatal crashes for which restraint use is known, black youths aged 15--20 years have the highest percentage of seat belt nonuse or incorrect belt use (69.8%), followed by AI/ANs (68.5%), Hispanics (64.5%), whites (58.9%), and A/PIs (56.1%) (13).
Similarly, restraint use among children differs by race/ethnicity and age, with younger children having higher rates of restraint use (14). Depending on race/ethnicity, children aged <1 year have restraint use ranging from 94% to 100%, whereas children aged 8--12 years have restraint use ranging from 72% to 91%. White and Asian children have higher restraint use rates than black and Hispanic children (14). Among children killed in crashes and for which restraint use is known, black children have the highest percentage of restraint nonuse; 52% of black children were unrestrained at the time of a fatal crash (11).
In addition to differences in restraint use, racial/ethnic groups with the highest motor vehicle--related death rates also have higher proportions of alcohol-involved motor vehicle--related crash deaths. In 2006, among all persons killed in crashes, AI/ANs had the highest proportion killed in alcohol-impaired crashes (48%), followed by Hispanics (36%), blacks and whites (both 31%), and A/PIs (23%) (11).
Enacting primary seat belt laws where needed and strong enforcement of such legislation can help reduce sex and racial/ethnic disparities in motor vehicle--related mortality (3,15). The highest reported seat belt use rates are observed in states and on tribal reservations with primary seat belt laws, followed by those with secondary seat belt laws (legislation allowing police to administer a citation for a seat belt violation only after the vehicle has been stopped for another reason) (16,17). Nineteen states do not have primary seat belt legislation in place (18). For children, safety seats reduce the risk for death among infants aged <1 year by 71% and reduce the risk for toddlers aged 1--4 years by 54% (19). For children aged 4--7 years, booster seats can reduce the risk for death by 59%, compared with seat belts alone (20). Focused child restraint distribution and education programs can help increase restraint use among children of minority races/ethnicities (3,5). In addition, evidence-based strategies can be used to reduce the incidence of alcohol-impaired driving. Successful strategies include sobriety checkpoints, multicomponent programs with community mobilization, minimum drinking age (21 years) laws, 0.08 g/dL blood alcohol concentration laws, and ignition interlock programs (3).
The findings in this report are subject to at least one limitation. Because NVSS data are extracted from death certificates and are not self-reported, some racial misclassification is likely, particularly for AI/ANs (21).
Although motor vehicle safety interventions have been tailored to communities of different racial/ethnic and cultural backgrounds successfully, additional translational research is needed regarding scalability of these interventions (4,5). Additional programs for and research on increasing seat belt use, child safety seat use, and reducing alcohol-impaired driving among minority groups are necessary to eliminate these disparities.
References
- CDC, National Center for Injury Prevention and Control (NCIPC). Web-based Injury Statistics Query and Reporting System (WISQARS) [Online database]. Atlanta, GA: US Department of Health and Human Services, CDC, NCIPC; 2010. Available at http://www.cdc.gov/injury/wisqars/index.html.
- Hilton J. Race and ethnicity: factors in fatal motor vehicle traffic crashes 1999--2004. Washington, DC: US Department of Transportation, National Highway Traffic Safety Administration; 2006. Publication no. DOT HS 809 956. Available at http://www-nrd.nhtsa.dot.gov/Pubs/809956.PDF.
- Task Force on Community Preventive Services. Motor vehicle--related injury prevention. Atlanta, GA: Task Force on Community Preventive Services; 2010. Available at http://www.thecommunityguide.org/mvoi/index.html.
- Reede C, Pionkowski S, Tsatoke G. Using evidence-based strategies to reduce motor vehicle injuries on the San Carlos Apache Reservation. IHS Primary Care Provider 2007;32:209--12.
- Letourneau RJ, Crump CD, Thunder N, Voss R. Increasing occupant restraint use among Ho-Chunk Nation members: tailoring evidence-based strategies to local context. The IHS Primary Care Provider 2009;34:212--7.
- CDC. U.S. Census populations with bridged race categories. Hyattsville, MD: US Department of Health and Human Services, CDC, National Center for Health Statistics; 2009. Available at http://www.cdc.gov/nchs/nvss/bridged_race.htm.
- Wallace LJD, Sleet DA, James SP. Injuries and the ten leading causes of death for Native Americans in the U.S.: opportunities for prevention. The IHS Primary Care Provider 1997;22:140--5.
- National Highway Traffic Safety Administration (NHTSA). Traffic safety facts: 2008 data; occupant protection. Washington, DC: US Department of Transportation, NHTSA; 2009. Publication no. DOT HS 811 160. Available at http://www-nrd.nhtsa.dot.gov/Pubs/811160.pdf.
- National Highway Traffic Safety Administration (NHTSA). Research note: national occupant protection use survey---1996: controlled intersection study. Washington, DC: US Department of Transportation, NHTSA; 1997. Available at http://ntl.bts.gov/lib/000/700/799/00303.pdf.
- National Highway Traffic Safety Administration (NHTSA). Traffic safety facts: seat belt use in 2009---overall results. Washington, DC: U.S. Department of Transportation, NTHSA; 2009. Publication no. DOT HS 811 100. Available at http://www.dmv.ne.gov/highwaysafety/pdf/TSFSeatBeltOverall2009.pdf.
- National Highway Traffic Safety Administration (NHTSA). Traffic safety facts: 2006 data; race and ethnicity. Washington, DC: US Department of Transportation, NHTSA; 2009. Publication no. DOT HS 810 995. Available at http://www-nrd.nhtsa.dot.gov/Pubs/810995.PDF.
- CDC. Youth online: high school YRBS. Atlanta, GA: US Department of Health and Human Services, CDC; 2010. Available at http://apps.nccd.cdc.gov/youthonline/App/Default.aspx?SID=HS.
- National Highway Traffic Safety Administration (NHTSA). Fatality Analysis Reporting System (FARS) query system [Online database]. Washington, DC: US Department of Transportation, NHTSA; 2010. Available at http://www-fars.nhtsa.dot.gov/QueryTool/QuerySection/SelectYear.aspx.
- National Highway Traffic Safety Administration (NHTSA). Traffic safety facts: research note: child restraint use in 2008---demographic results. Washington, DC: U.S. Department of Transportation, NHTSA; 2009. Publication no. DOT HS 811 148. Available at http://www-nrd.nhtsa.dot.gov/Pubs/811148.pdf.
- Beck, LF, Shults RA, Mack KA, Ryan GW. Associations between sociodemographics and safety belt use in states with and without primary enforcement laws. Am J Public Health 2007;97:1619--24.
- Beck LF, Shults RA. Seat belt use in states and territories with primary and secondary laws---United States, 2006. J Safety Res 2009;40:469--72.
- National Highway Traffic Safety Administration (NHTSA). Safety belt use estimate for Native American tribal reservations. Washington, DC: US Department of Transportation, NHTSA; 2006. Publication no. DOT HS 809 921. Available at http://www.nhtsa.gov/people/injury/research/SBUseIndianNation/images/textfinal.pdf.
- Insurance Institute for Highway Safety. Safety belt use laws; July 2010. Arlington, VA: Insurance Institute for Highway Safety, Highway Loss Data Institute; 2010. Available at http://www.iihs.org/laws/safetybeltuse.aspx.
- National Highway Traffic Safety Administration (NHTSA). Traffic safety facts: 2008 data; children. Washington, DC: U.S. Department of Transportation, NHTSA; 2009. Publication no. DOT HS 811 157. Available at http://www-nrd.nhtsa.dot.gov/pubs/811157.pdf.
- Durbin DR, Elliott MR, Winston FK. Belt-positioning booster seats and reduction in risk of injury among children in vehicle crashes. JAMA 2003;289:2835--40.
- US Department of Health and Human Services; Westat. Data on health and well-being of American Indians, Alaska Natives, and other Native Americans: data catalog. December 2006. Available at http://aspe.hhs.gov/hsp/06/Catalog-AI-AN-NA/index.htm.
FIGURE 1. Motor vehicle--related death rates, by sex and race/ethnicity --- National Vital Statistics System, United States, 2007
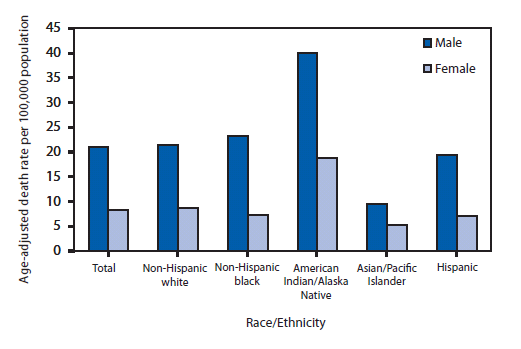
Alternate Text: The figure is a bar graph showing that in 2007, American Indians/Alaska Natives had a higher death rate per 100,000 population from motor vehicle-related deaths than non-Hispanic whites, non-Hispanic blacks, Asians/Pacific Islanders, and Hispanics. For all racial/ethnic groups, males had death rates that were 2-3 times higher than the rates for females.
FIGURE 2. Motor vehicle--related death rates among males, by race/ethnicity --- National Vital Statistics System, United States, 2003--2007
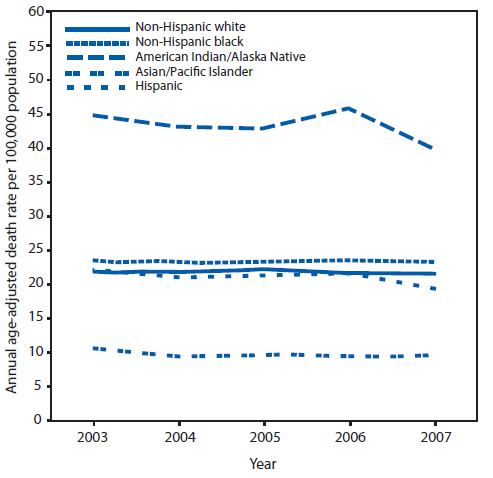
Alternate Text: The figure is a line graph showing that during 2003-2007, American Indian/Alaska Native males had a higher death rate per 100,000 population from motor vehicle-related deaths than non-Hispanic white males, non-Hispanic black males, Asians/Pacific Islander males, and Hispanic males. Asian/Pacific Islander males had the lowest death rate.
FIGURE 3. Motor vehicle--related death rates among females, by race/ethnicity --- National Vital Statistics System, United States, 2003--2007
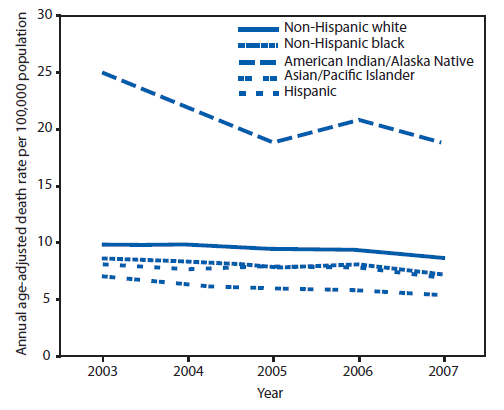
Alternate Text: The figure is a line graph showing that during 2003-2007, American Indian/Alaska Native females had a higher death rate per 100,000 population from motor vehicle-related deaths than non-Hispanic white females, non-Hispanic black females, Asians/Pacific Islander females, and Hispanic females. Asian/Pacific Islander females had the lowest death rate.
Use of trade names and commercial sources is for identification only and does not imply endorsement by the U.S. Department of
Health and Human Services.
References to non-CDC sites on the Internet are
provided as a service to MMWR readers and do not constitute or imply
endorsement of these organizations or their programs by CDC or the U.S.
Department of Health and Human Services. CDC is not responsible for the content
of pages found at these sites. URL addresses listed in MMWR were current as of
the date of publication.
All MMWR HTML versions of articles are electronic conversions from typeset documents.
This conversion might result in character translation or format errors in the HTML version.
Users are referred to the electronic PDF version (http://www.cdc.gov/mmwr)
and/or the original MMWR paper copy for printable versions of official text, figures, and tables.
An original paper copy of this issue can be obtained from the Superintendent of Documents, U.S.
Government Printing Office (GPO), Washington, DC 20402-9371;
telephone: (202) 512-1800. Contact GPO for current prices.
**Questions or messages regarding errors in formatting should be addressed to
mmwrq@cdc.gov.
