|
TABLE. Sampling methods, data collected, and descriptions of surveillance systems that include active transportation assessments — United States, 1999–2012 |
||||
|---|---|---|---|---|
|
Data source and website |
Sampling method and analytic notes |
Data collection |
Year |
Active transportation assessment questions and calculation |
|
American Community Survey (ACS) |
ACS uses an address-based, stratified, multistage random sample of households and, starting in 2006, group quarters (>10 inhabitants). ACS includes all eligible household members and a subsample of group quarters. |
Three-stage follow-up during data collection: mailed questionnaires, computer-assisted telephone interview, and computer-assisted in-person interview (in that order); mandatory participation |
2006–2012 |
"How did this person usually get to work last week?" |
|
National Household Travel Survey (NHTS) |
NHTS uses list-assisted, stratified, random-digit dialing of households with landline telephones. Analyses are restricted to respondents aged ≥16 years |
Telephone recruitment, paper trip log, telephone data retrieval interview |
2001 and 2009 |
Participants logged all trips on 1 day, including mode of travel and purpose. Any trip with a mode of bicycle or walk and any purpose other than "go to gym/exercise/play sports" was considered an active transportation trip. |
|
American Time Use Survey (ATUS) |
ATUS uses a stratified random sample of persons aged ≥15 years from households having completed Current Population Survey interviews. |
Computer-assisted telephone conversational interview, recalling activities from 4 a.m. the previous day to 4 a.m. the day of the interview |
2003–2012 |
For a given time on the day of recall, participants could report a primary activity of travel (code 18). |
|
National Health and Nutrition Examination Survey (NHANES) |
NHANES uses a stratified multistage probability sample of U.S. residents aged ≥12 years. |
In-home interview |
1999–2006 |
"Over the past 30 days, have you walked or bicycled as part of getting to and from work, or school, or to do errands?" |
|
Computer-assisted in-home interview |
2007–2012 |
"Do you walk or use a bicycle for at least 10 minutes continuously to get to and from places?" |
||
Active Transportation Surveillance — United States, 1999–2012
MMWR in Brief summarizes key points from Active Transportation Surveillance — United States, 1999–2012. MMWR 2015; Vol 64 (No. SS-7). Available at http://www.cdc.gov/mmwr/pdf/ss/ss6407.pdf. Certain text might not have appeared in the original publication.
New information
This is the first report to compare the prevalence of six distinct active transportation (AT) measurements from five national surveillance systems across multiple years (1999–2012).
Analysis
Assessments of AT were grouped by type: commute modes to work, single-day behavior or trips, and recent (past month or week) AT behaviors. The prevalence of AT calculated from each system was presented by year and stratified by sex, age, race/ethnicity, educational attainment, and, when possible, urbanicity and/or population density. For measurements that provide estimates of minutes per week of AT, the proportion meeting the aerobic component of the 2008 Physical Activity Guidelines (1) through AT alone is presented.
Summary findings
Results varied widely across assessment types. The prevalence of primarily walking or bicycling to work in the past week ranged from 2.6% to 3.4%; the prevalence of any AT assessed by single-day measures ranged from 10.5% to 18.5%; and the prevalence of any recent, habitual AT ranged from 23.9% to 31.4%. Regardless of assessment type, AT was usually more common among men, younger respondents, minority racial/ethnic groups, and those at either end of the education spectrum (i.e., less than high school and college graduate). AT also tended to be more prevalent in densely populated urban areas. No trends over time were evident.
Data source and methods
The American Community Survey (ACS) and the National Household Travel Survey (NHTS) both assess the primary mode of transportation to work in the past week. From these systems, the proportion of respondents who reported walking or bicycling to work was calculated. NHTS and the American Time Use Survey (ATUS) include 1-day assessments of trips or activities, from which the proportion of respondents who reported any walking or bicycling for transportation was calculated. The National Health and Nutrition Examination Survey (NHANES) and the National Health Interview Survey (NHIS) both assess recent (i.e., in the past week or past month) habitual physical activity behaviors performed for transportation. From these systems, the proportion of respondents who reported any recent habitual AT was calculated. All publicly available data for the period 1999-2012 were analyzed according to each system's analytic guidelines (Table).
Main results
The prevalence of AT varied by a factor of 10 across all assessment types, with the lowest prevalence found for primary past-week commute mode to work and the highest prevalence found in assessments of recent, habitual AT. Results from similar types of assessments (i.e. commute mode to work, single day, or recent habitual AT) were comparable. The prevalence of AT as the primary past-week commute mode to work ranged from a low of 2.6% in the 2001 NHTS to highs of 3.4% in several years of ACS. The prevalence of any AT from a single-day assessment ranged from a low of 10.5% in the 2012 ATUS to 18.5% in the 2009 NHTS. The prevalence of any habitual AT ranged from 23.9% in the 2001–2002 NHANES to 31.4% in the 2011–2012 NHANES (Figure)
Although no trends over time were detected, certain patterns emerged in analyses stratified by covariates hypothesized to be related to AT. Across systems, men often reported more AT than women, younger respondents tended to report more AT than older respondents, and non-Hispanic whites tended to report less AT than other racial/ethnic groups. Among education groups, the highest prevalence of AT was usually in the least or most educated groups. Also, AT was more prevalent in densely populated urban areas versus sparsely-populated rural or suburban areas.
AT is only one of several types of activity that could be used to meet the aerobic component of the 2008 Physical Activity Guidelines for Americans (1). Only two systems collect the data needed to determine which respondents perform sufficient AT to meet the guideline. Based on estimates from NHANES and NHIS, this prevalence ranges from 4.7% (NHIS 2010) to 18.0% (NHANES 2011–2012), and interpretation of findings is complicated by an assessment change in NHANES in 2007.
Limitations
The findings in this report are subject to at least three limitations. First, all are self-reported measures and subject to recall and social desirability biases. Second, survey questions and methods are subject to changes from year to year, limiting comparability across time. Finally, inclusion and exclusion of questions about AT measures in periodic surveys vary. The comparability of results over time is contingent on repeated cycles of data collection, analysis, and dissemination.
Public Health Implications
The range of AT prevalence estimates is attributable to the different way each surveillance system assesses AT. There is no single best assessment type; each has limitations and strengths and might be useful in different situations. For example, assessments of past-week mode of travel to work likely underestimate total AT by not including AT to work that is performed infrequently or AT for nonwork travel. As a result, these estimates likely have low sensitivity for identifying persons who participate in any AT, but high specificity by discouraging those who truly participate in no AT from selecting active modes in their response. Such results might provide an estimate of regular, committed AT participants, which could inform infrastructure decisions regarding active commuters.
Single-day assessments also have limitations and strengths. First, because only 1 day is assessed per person, calculating weekly statistics of activity volume is impossible, limiting the ability to assess compliance with activity guidelines. Conversely, 1-day assessments are amenable to recall aids like logs (as in NHTS) or guided interviewing (as in ATUS), which might improve validity and provide information on destination or purpose. Such details about places that attract AT trips could be important to urban and transportation planners.
Assessments of typical AT behaviors (NHANES and NHIS) also have unique limiting factors and strengths. These assessments can be cognitively challenging for respondents when asked to recall frequency and duration of a routine behavior over multiple days and limit responses only to instances where the activity was performed for transportation purposes (2). However, using a recall period longer than a single day might increase the likelihood that infrequent AT is captured, which could yield higher sensitivity than other assessments. Further, the additional frequency and duration data allow estimation of activity volume attributable to AT and classification relative to physical activity guidelines.
Continued monitoring of AT can help identify any national changes in AT prevalence. Such changes might reflect demographic shifts such as increased urban living (3) or AT initiatives including Safe Routes to Schools (4) or Complete Streets (5). At the local level, AT surveillance data might be used to evaluate new AT programs or infrastructure and thereby identify best practices for others to implement. Data that characterize who is performing AT in various contexts and locations might also help local officials plan AT infrastructure projects (e.g. sidewalks, pedestrian signals, and bicycle lanes) to meet the population needs. However, of the existing national systems, only ACS provides estimates at geographic scales smaller than metropolitan areas. To obtain local data, states or municipalities might need to supplement national surveillance with additional data collection efforts. Similarly, novel sources of AT data, such as user-generated data from mobile applications, might supplement the established surveillance techniques (6,7).
Corresponding author: Geoffrey P Whitfield, PhD, Division of Emergency and Environmental Health Services, National Center for Environmental Health, CDC. Telephone: 770.488.3976. E-mail: xdh5@cdc.gov.
References
- US Department of Health and Human Services. Physical activity guidelines for Americans. Washington, DC: US Department of Health and Human Services; 2008. Available at http://www.health.gov/PAGuidelines/guidelines/.
- Pettee Gabriel KK, Morrow JR Jr, Woolsey AL. Framework for physical activity as a complex and multidimensional behavior. J Phys Act Health 2012;9(Suppl 1):S11–8.
- US Census Bureau. Growth in urban population outpaces rest of nation. Release CB12-50. Washington, DC: US Census Bureau; 2012. Available at http://www.census.gov/2010census/news/releases/operations/cb12-50.html.
- Safe Routes to School National Partnership. Safe Routes to School: Helping Communities Save Lives and Dollars. 2012. Available at http://saferoutespartnership.org/sites/default/files/pdf/SRTS-policy-report-fact-sheet.pdf.
- Smart Growth America. National Complete Streets Coalition. 2015. Available at http://www.smartgrowthamerica.org/complete-streets.
- Albergotti R. Strava, Popular With Cyclists and Runners, Wants to Sell Its Data to Urban Planners. The Wall Street Journal Blog. Ney York, NY; 2014. Available at: http://blogs.wsj.com/digits/2014/05/07/strava-popular-with-cyclists-and-runners-wants-to-sell-its-data-to-urban-planners/
- US Centers for Disease Control and Prevention. Mobile Applications, Health, and Built Environment: Considerations for developers. Washington, DC: US Department of Health and Human Services; 2014. Available at: http://www.cdc.gov/healthyplaces/mobile.htm.
|
TABLE. (Continued) Sampling methods, data collected, and descriptions of surveillance systems that include active transportation assessments — United States, 1999–2012 |
||||
|---|---|---|---|---|
|
Data source and website |
Sampling method and analytic notes |
Data collection |
Year |
Active transportation assessment questions and calculation |
|
National Health Interview Survey (NHIS) |
NHIS uses multistage area probability sampling, representative of households and noninstitutional group quarters. Individual respondents were weighted to represent the U.S. general population. |
Personal household interview |
2005 |
"First I will ask about walking for transportation that is, walking to get some place. Please include all walks that involved an errand or to get some place. During the past 7 days, did you walk to get to some place that took you at least 10 minutes?" |
|
2010 |
"The next questions are about walking for transportation: |
|||
FIGURE. Prevalence of active transportation (walking or bicycling) — five surveillance systems, United States, 1999–2012
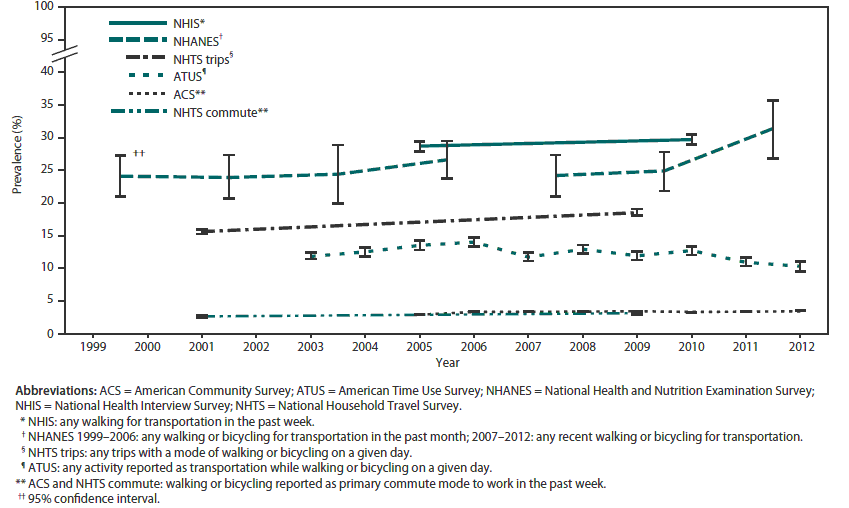
Alternate Text: This figure is a line graph with six different lines indicating the prevalence of active transportation (walking or bicycling) from five surveillance systems in the United States during 1999-2012: the American Community Survey (ACS); the American Time Use Survey (ATUS); the National Health and Nutrition Examination Survey (NHANES); the National Health Interview Survey (NHIS); and the National Household Travel Survey (NHTS). NHIS measured any walking for transportation in the past week. NHANES 1999-2006 measured any walking or bicycling for transportation in the past month, and 2007-2012 measured any recent walking or bicycling for transportation. NHTS trips measured any trips with a mode of walking or bicycling on a given day. ATUS measured any activity reported as transportation while walking or bicycling on a given day. ACS and NHTS commute measured walking or bicycling reported as primary commute mode to work in the past week. Bars indicate 95% confidence intervals. The prevalence of active transportation as the primary past-week commute mode to work (ACS and NHTS) ranged from a low of 2.6% in the 2001 NHTS to highs of 3.4% in ACS for the years 2008, 2009, and 2011. The prevalence of any active transportation from a single-day assessment ranged from a low of 10.5% in the 2012 ATUS to 18.5% in the 2009 NHTS. The prevalence of any habitual active transportation in behavioral assessments ranged from 23.9% in the 2001-2002 NHANES to 31.4% in the 2011-2012 NHANES.
Use of trade names and commercial sources is for identification only and does not imply endorsement by the U.S. Department of
Health and Human Services.
References to non-CDC sites on the Internet are
provided as a service to MMWR readers and do not constitute or imply
endorsement of these organizations or their programs by CDC or the U.S.
Department of Health and Human Services. CDC is not responsible for the content
of pages found at these sites. URL addresses listed in MMWR were current as of
the date of publication.
All MMWR HTML versions of articles are electronic conversions from typeset documents.
This conversion might result in character translation or format errors in the HTML version.
Users are referred to the electronic PDF version (http://www.cdc.gov/mmwr)
and/or the original MMWR paper copy for printable versions of official text, figures, and tables.
An original paper copy of this issue can be obtained from the Superintendent of Documents, U.S.
Government Printing Office (GPO), Washington, DC 20402-9371;
telephone: (202) 512-1800. Contact GPO for current prices.
**Questions or messages regarding errors in formatting should be addressed to
mmwrq@cdc.gov.
