HIV Risk, Prevention, and Testing Behaviors Among Heterosexuals at Increased Risk for HIV Infection — National HIV Behavioral Surveillance System, 21 U.S. Cities, 2010
Corresponding author: Catlainn Sionean, PhD, Division of HIV/AIDS Prevention, National Center for HIV/AIDS, Viral Hepatitis, STD, and TB Prevention, CDC. Telephone: 404-639-8702; E-mail: csionean@cdc.gov.
Abstract
Problem/Condition: At the end of 2010, an estimated 872,990 persons in the United States were living with a diagnosis of human immunodeficiency virus (HIV) infection. Approximately one in four of the estimated HIV infections diagnosed in 2011 were attributed to heterosexual contact. Heterosexuals with a low socioeconomic status (SES) are disproportionately likely to be infected with HIV.
Reporting Period: June–December 2010.
Description of System: The National HIV Behavioral Surveillance System (NHBS) collects HIV prevalence and risk behavior data in selected metropolitan statistical areas (MSAs) from three populations at high risk for HIV infection: men who have sex with men, injecting drug users, and heterosexuals at increased risk for HIV infection. Data for NHBS are collected in rotating cycles in these three different populations. For the 2010 NHBS cycle among heterosexuals, men and women were eligible to participate if they were aged 18–60 years, lived in a participating MSA, were able to complete a behavioral survey in English or Spanish, and reported engaging in vaginal or anal sex with one or more opposite-sex partners in the 12 months before the interview. Persons who consented to participate completed an interviewer-administered, standardized questionnaire about HIV-associated behaviors and were offered anonymous HIV testing. Participants were sampled using respondent-driven sampling, a type of chain-referral sampling. Sampling focused on persons of low SES (i.e., income at the poverty level or no more than a high school education) because results of a pilot study indicated that heterosexual adults of low SES were more likely than those of high SES to be infected with HIV. To assess risk and testing experiences among persons at risk for acquiring HIV infection through heterosexual sex, analyses excluded participants who were not low SES, those who reported ever having tested positive for HIV, and those who reported recent (i.e., in the 12 months before the interview) male-male sex or injection drug use. This report summarizes unweighted data regarding HIV-associated risk, prevention, and testing behaviors from 9,278 heterosexual men and women interviewed in 2010 (the second cycle of NHBS data collection among heterosexuals).
Results: The median age of participants was 35 years; 47% were men. The majority of participants were black or African American (hereafter referred to as black) (72%) or Hispanic/Latino (21%). Most participants (men: 88%; women: 90%) reported having vaginal sex without a condom with one or more opposite-sex partners in the past 12 months; approximately one third (men: 30%; women: 29%) reported anal sex without a condom with one or more opposite-sex partners. The majority of participants (59%) reported using noninjection drugs in the 12 months before the interview; nearly one in seven (15%) had used crack cocaine. Although most participants (men: 71%; women: 77%) had ever been tested for HIV, this percentage was lower among Hispanic/Latino participants (men: 52%; women: 62%). Approximately one third (34%) of participants reported receiving free condoms in the 12 months before the interview; 11% reported participating in a behavioral HIV prevention program.
Interpretation: A substantial proportion of heterosexuals interviewed for the 2010 NHBS heterosexual cycle reported engaging in behaviors that increase the risk for HIV infection. However, HIV testing was suboptimal among the overall sample, including among groups disproportionately affected by HIV infection (i.e., blacks and Hispanics/Latinos).
Public Health Action: Increasing coverage of HIV testing and other HIV prevention services among heterosexuals at increased risk is important, especially among groups disproportionately affected by HIV infection, such as blacks and Hispanics/Latinos. The National HIV/AIDS Strategy for the United States delineates a coordinated national response to reduce infections and HIV-related health disparities among disproportionately affected groups. NHBS data can guide national and local planning efforts to maximize the impact of HIV prevention programs.
Introduction
In the United States, an estimated 872,990 persons were living with a diagnosis of human immunodeficiency virus (HIV) infection at the end of 2010 (1). Heterosexual sex is the second most common route of transmission of HIV in the United States and is estimated to account for approximately one out of every four (27%) infections diagnosed in adolescents and adults during 2011 (1). Heterosexual sex is the primary route of transmission of HIV for women; approximately four out of every five new HIV infections among women diagnosed in 2010 were attributed to heterosexual contact (1). In addition, blacks or African Americans (hereafter referred to as blacks) and Hispanics/Latinos are disproportionately affected by HIV. Estimated rates of diagnosed HIV infection in 2011 were 9 times as high for blacks and 3 times as high for Hispanics or Latinos compared with the rate for whites. Racial and ethnic differences among women were greater, with an estimated rate of diagnosed HIV infection among black women that was 20 times as high and among Hispanic/Latino women that was 4 times as high as the rate among white women (1). The National HIV/AIDS Strategy for the United States addresses these issues by calling for a coordinated national response for reducing HIV incidence and HIV-related health disparities (2).
One objective of the National HIV/AIDS Strategy, released in 2010 (2), is to decrease the annual number of new infections by 25% by 2016. As outlined in the National HIV/AIDS Strategy (2), this objective can be achieved by implementing three key steps to reduce HIV infections: intensifying HIV prevention efforts in communities where HIV is most heavily concentrated (such as urban areas, which have the highest prevalence) (3); expanding efforts to prevent HIV infection by using a combination of effective, evidence-based approaches; and educating the general public about the threat of HIV and how to prevent infection. State and local health departments as well as federal agencies are expected to monitor progress toward the strategy's goals.
The National HIV Behavioral Surveillance System (NHBS) was designed to help state and local health departments in areas with a high prevalence of AIDS monitor selected risk behaviors, HIV testing experiences, use of prevention programs, and HIV infection in three populations at high risk for HIV infection: gay, bisexual, and other men who have sex with men (collectively referred to as MSM); injecting drug users (IDUs); and heterosexuals at increased risk for HIV infection (4). NHBS is an important component of CDC's comprehensive approach to reducing the spread of HIV in the United States and is the primary source of data for monitoring the behaviors of populations at risk for HIV infection. Findings from NHBS enhance the understanding of HIV risk and testing behaviors and identify gaps in prevention efforts. NHBS data are used at the state and local levels to renew and maintain efforts to prevent HIV infection as well as other bloodborne and sexually transmitted diseases (STDs). The data from this system could be used locally and nationally to monitor efforts toward reducing HIV infections and HIV-related health disparities in these populations.
The target population for the NHBS heterosexual cycle is adults in areas of high AIDS prevalence who are at risk for acquiring HIV infection through heterosexual sex (5). In the MSM and IDU data collection cycles, all persons who report engaging in the risk behavior (male-male sex and injection drug use, respectively) in the 12 months before the interview are considered at risk for HIV infection because of the higher prevalence of HIV infection among persons who engage in these behaviors (6). However, not all persons with opposite-sex partners are at equal risk for HIV. An evaluation of the first (pilot) NHBS data collection cycle among heterosexuals (2006–2007) indicated that low socioeconomic status (SES) (household income at or below the federal poverty guidelines or no more than a high school education) was an accurate marker of HIV acquisition risk among heterosexual adults in 24 U.S. cities with high AIDS prevalence (5). Therefore, the 2010 NHBS heterosexual cycle focused on heterosexuals of low SES who lived in urban communities with high AIDS prevalence. Use of low SES to identify heterosexuals at increased risk for HIV is consistent with other published studies of HIV infection among heterosexuals documenting the association between low SES and HIV infection (7–9).
This report summarizes unweighted data from the second NHBS data collection cycle among heterosexuals at increased risk for HIV, which was conducted during June–December 2010. In the 2010 NHBS heterosexual cycle, 2.3% of participants were HIV-positive (10). This report expands on the previous report (10) of HIV infection status among participants in the 2010 heterosexual NHBS cycle by 1) reporting the distribution of HIV risk, prevention, and testing behaviors by sociodemographic characteristics and metropolitan statistical area (MSA) and 2) including data from participants who reported a lifetime history but not recent history of male-male sex or injection drug use (i.e., the behavior had ever occurred but the most recent event was >12 months before the interview). Detailed data regarding HIV-related risk behaviors from the NHBS heterosexual cycle have not been reported previously. Monitoring these data is useful for 1) assessing the extent to which heterosexuals at increased risk for HIV (i.e., those of low SES living in communities with high AIDS prevalence) engage in HIV risk and preventive behaviors and 2) identifying opportunities for HIV prevention in this population.
Methods
NHBS collects HIV prevalence and risk behavior data in selected MSAs from three populations at high risk for HIV infection: MSM, IDUs, and heterosexuals at increased risk for HIV infection. Data for NHBS are collected in rotating cycles. Each of the three NHBS populations (MSM, IDUs, and heterosexuals at increased risk for HIV infection) is surveyed once every 3 years. A period of data collection with a specific population is referred to as a cycle. The survey for each cycle is anonymous. For each survey cycle, an anonymous standardized questionnaire is used to collect information about HIV-associated behaviors, specifically sexual behaviors, substance use, HIV testing, and use of HIV prevention services. The face-to-face survey is administered by a trained interviewer using a portable computer. All participants who consent to the survey are offered an anonymous HIV test, the results of which are linked to the survey data through a unique anonymous survey identifier and provided to participants in accordance with local policy. Participants may complete the survey even if they decline the HIV test. All participating state and local jurisdictions obtained human subject protections approval before initiating data collection for the 2010 NHBS heterosexual cycle. As a component of HIV/AIDS surveillance, NHBS data are protected by an Assurance of Confidentiality under Section 308(d) of the Public Health Service Act (42 U.S.C. 242 m(d)). As a part of this assurance, funded health departments applied and trained NHBS staff members to follow data security standards consistent with those for CDC guidelines for HIV/AIDS surveillance data (11).
Participating Areas
State and local health departments that were eligible to participate in NHBS were those whose jurisdictions included an MSA or a specified MSA division with the highest AIDS prevalence in 2006 (CDC, unpublished data, 2006). The 2010 heterosexual cycle of NHBS was conducted in the following MSAs (or if a metropolitan division is indicated, the survey was conducted within that specific division of the MSA): 1) Atlanta-Sandy Springs-Marietta, Georgia; 2) Baltimore-Towson, Maryland; 3) Boston-Cambridge-Quincy, Massachusetts-New Hampshire: Boston-Quincy Division; 4) Chicago-Joliet-Naperville, Illinois-Indiana-Wisconsin: Chicago-Joliet-Naperville Division; 5) Dallas-Fort Worth-Arlington, Texas: Dallas-Plano-Irving Division; 6) Denver-Aurora-Broomfield, Colorado; 7) Detroit-Warren-Livonia, Michigan: Detroit-Livonia-Dearborn Division; 8) Houston-Sugar Land-Baytown, Texas; 9) Los Angeles-Long Beach-Santa Ana, California: Los Angeles-Long Beach-Glendale Division; 10) Miami-Ft. Lauderdale-Pompano Beach, Florida: Miami Division; 11) New Orleans-Metairie-Kenner, Louisiana; 12) New York-Northern New Jersey-Long Island, New York-New Jersey-Pennsylvania: New York-White Plains-Wayne Division; 13) New York-Northern New Jersey-Long Island, New York-New Jersey-Pennsylvania: Nassau-Suffolk Division; 14) New York-Northern New Jersey-Long Island, New York-New Jersey-Pennsylvania: Newark-Union Division; 15) Philadelphia-Camden-Wilmington, Pennsylvania, New Jersey, Delaware, Maryland: Philadelphia Division; 16) San Diego-Carlsbad-San Marcos, California; 17) San Francisco-Oakland-Fremont, California: San Francisco-San Mateo-Redwood City Division; 18) San Juan-Caguas-Guaynabo, Puerto Rico; 19) Seattle-Tacoma-Bellevue, Washington: Seattle-Bellevue-Everett Division; 20) St. Louis, Missouri-Illinois; and 21) Washington-Arlington-Alexandria, District of Columbia (DC)-Virginia-Maryland-West Virginia: Washington-Arlington-Alexandria Division. Nearly one half of all persons living with HIV in the United States and Puerto Rico as of the end of 2009 lived in one of these MSAs (12). Throughout this report, MSAs are referred to by the name of the primary principal city (Figure 1).
Eligibility
The same basic eligibility criteria are used in each NHBS cycle: age ≥18 years, a current resident of a participating MSA or specified MSA division, not a previous participant in NHBS during the current survey cycle, ability to complete the survey in either English or Spanish, and ability to provide informed consent. In addition to these basic eligibility criteria, participation in the NHBS heterosexual cycle is limited to men and women aged ≤60 years who had vaginal or anal sex with an opposite-sex partner in the 12 months before the interview. The maximum eligible age was limited to 60 years because the estimated rates of HIV diagnoses are relatively low among persons aged >60 years (1). Low SES was not an eligibility criterion but was used in the sampling strategy as described in the following section.
Sampling Method
Participants for the 2010 heterosexual cycle of NHBS were recruited using respondent-driven sampling (RDS), a type of chain-referral sampling. The RDS sampling strategy used in NHBS heterosexual cycles is similar to the strategy used in NHBS IDU cycles, the details of which have been described elsewhere (13). RDS starts with a limited number of persons (seeds) chosen by referrals from those who know the local target population well or through outreach to areas where the target population can be found. Eligible seeds who participate are asked to recruit other members of the target population. These persons, in turn, complete the survey and are asked to recruit others. This recruitment process continues until the sample size has been reached or the sampling period ends.
To reach the target population of heterosexuals at increased risk for HIV, in the 2010 NHBS heterosexual cycle, seeds were recruited from poverty areas within each MSA based on estimated 2009 poverty rates for census tracts within the participating MSAs. Poverty areas are defined by the U.S. Census Bureau as census tracts in which at least 20% of residents live below the poverty threshold (14). Seeds completed the eligibility screener; those who were eligible and consented to participate were administered the survey. Seeds who completed the survey were asked to recruit three to five persons they knew personally to participate and were given coupons with information about the project, such as phone number, hours, and locations, to provide to their recruits.
Data Collection
All persons who brought a valid coupon to a field site for the 2010 NHBS heterosexual cycle were escorted to a private area for eligibility screening. Trained interviewers obtained informed consent for the survey from eligible participants and offered an anonymous HIV test to participants who consented to the survey. Interviewers administered the survey in person using a portable computer. The survey instrument included questions regarding participants' demographic characteristics, sexual and drug-use behaviors, HIV testing history, hepatitis vaccination, STD diagnoses, and use of HIV behavioral interventions. Interviews were an average of 32 minutes. In exchange for their time and effort in taking part in the survey, participants received approximately $25 in cash or a gift certificate; participants who also agreed to the HIV test received additional compensation, typically $25. The specific amount and form of incentives for the interview and HIV test were determined locally. Participants who agreed to recruit other participants were given one to five uniquely numbered recruitment coupons. Participants received approximately $10 in cash or a gift certificate for each new participant recruited who completed the interview. The specific amount of the incentive was determined locally.
To focus recruitment on the target population, opportunity to recruit other participants was limited to those who met the NHBS definition of a heterosexual at increased risk for HIV (low SES) and who reported no recent (i.e., in the past 12 months) injection drug use. Low SES was defined as having completed no more than a high school education or having a household income that was at or below the U.S. Department of Health and Human Services poverty guidelines (15). Each participating MSA attempted to interview 450 heterosexuals at increased risk for HIV infection (i.e., heterosexual sexually active, low SES men and women aged 18–60 years who had not injected drugs in the 12 months before the interview).
Data Analysis
This report summarizes unweighted data from 9,278 heterosexual men and women interviewed in 21 MSAs during the second cycle of NHBS data collection among heterosexuals, which was conducted in 2010. Inclusion in this report is limited to participants who 1) were eligible for and consented to the interview and 2) reported low SES (i.e., either no more than high school education or an income at or below the poverty level). In addition, to assess risk and testing experiences among persons at risk for acquiring HIV infection through heterosexual sex, all analyses excluded data from participants who reported a previous positive HIV test and those who reported recent (i.e., in the 12 months before the interview) male-male sex or injection drug use or did not provide this information (Figure 2). Data from participants who did not report a previous positive HIV test during the interview but who subsequently had a positive NHBS HIV test result are included in this report because persons who do not know their HIV status are an important focus of HIV prevention efforts. Data from participants with a previous but not recent (i.e., >12 months before the interview) history of injection drug use or male-male sex were included because the reported behaviors indicated exclusively heterosexual risk in the 12 months before the interview.
Four time frames for risk and testing experiences are included in this report: 1) ever (i.e., at any point in the participant's lifetime), 2) in the 12 months before the date of the interview, 3) in the 30 days before the date of the interview, and 4) the most recent time the participant engaged in the behavior. All numbers and percentages included in this report are unweighted. Weighting methods for RDS data are still under development and are limited to estimation of outcomes with sufficient local sample sizes. In addition, unweighted analysis allows reporting of outcomes by subgroups for which the number of participants is not sufficient for weighted analysis but aggregation into a single "other" category would obscure important information (e.g., American Indians/Alaska Natives). Between-group differences of >5 percentage points are noted in the text for key outcomes deemed meaningful in the public health context, given the NHBS sample size. However, the data are descriptive; no statistical tests were conducted, and group differences should be interpreted with caution. To ensure that anonymous data reporting standards of CDC and all state and local health departments were met, numbers and percentages for numbers or numerators of fewer than six participants were suppressed.
Measures
Participant Characteristics
Data were analyzed according to the following characteristics of participants: sex, age group, race/ethnicity, marital status, education level, annual household income, health insurance status, census region, and MSA. Reponses for race/ethnicity were categorized into six mutually exclusive categories: American Indian/Alaska Native, black, Hispanic/Latino, Asian/Native Hawaiian/Other Pacific Islander, white, and multiple races. Persons of Hispanic/Latino ethnicity might be of any race. Asian was combined with Native Hawaiian/Other Pacific Islander to prevent suppression of data for each of these groups in several tables. Marital status was categorized as married or cohabiting, formerly married (separated, divorced, or widowed) and not cohabiting, and never married and not cohabiting. Education level was categorized as less than high school graduate, high school diploma or equivalent (e.g., general educational development [GED] certificate), and some college or higher level education. Participants were asked to identify which range in a list of ranges included their annual household income; in this report, income ranges were combined into four categories: $0–$4,999; $5,000–$9,999; $10,000–$19,999; and ≥$20,000. Participants were classified as living in poverty if the household income range reported during the interview was at or below the federal poverty guidelines for the total number of dependents, including the participant, for the reported income (15). Nearly all participants in the analysis sample were classified as living in poverty (men: 85%; women: 90%); approximately two thirds (67%) had at least one dependent in addition to the participant on their reported income, and approximately two thirds (63%) reported an income of <$10,000, which is below the federal poverty guidelines for persons with no additional dependents. Among participants with more than one dependent, the median number of dependents was three (interquartile range [IQR]: two to four). Therefore, income is reported rather than poverty status to demonstrate the extreme poverty among the 2010 NHBS heterosexual cycle participants. Consistent with the Stewart B. McKinney Homeless Act of 1987 (42 U.S.C. §11331 et seq.), homelessness was defined as living on the street, living in a shelter, or staying with friends or relatives. Health insurance was categorized as none; private only (i.e., health insurance obtained through a private insurance policy or employer, TRICARE, CHAMPUS, or membership in a health maintenance organization); public only (i.e., Medicare, Medicaid, or Veterans Administration coverage); or other coverage, including both public and private. Male-male sex (male participants only) was defined as oral or anal sex with another man. Injection drug use was defined as injection of drugs not prescribed for the participant. As described previously, all participants who reported male-male sex or injection drug use in the 12 months before the interview or did not provide this information were excluded from all analyses. Participants' region of residence was classified for each MSA according to the U.S. Census Bureau for each of the NHBS MSAs in the continental United States (16); an additional category (territories) was used for the San Juan, Puerto Rico, MSA.
Sexual Behaviors
Details about the number of opposite-sex partners (overall and by type) and about vaginal and anal sex with opposite-sex partners in the 12 months before the interview are presented for male and female participants. Participants were asked the number of opposite-sex partners overall and by type. Sex was defined as oral, vaginal, or anal sex. Sex partners were categorized as main or casual partners. A main partner was someone to whom the participant felt most committed (e.g., girlfriend or boyfriend, wife or husband, significant other, or life partner). A casual partner was someone to whom the participant did not feel committed, whom the participant did not know very well, or with whom the participant had sex in exchange for something such as money or drugs. Participants could report having more than one main or casual partner in the past 12 months. Within each partner type, participants were asked the number of partners with whom they had engaged in each of the following behaviors: vaginal sex, vaginal sex without a condom, anal sex, and anal sex without a condom. In this report and the accompanying tables, unless otherwise specified, sex partner refers to opposite-sex partners.
Alcohol and Drug Use
Participants were asked about their use of alcohol in the 30 days before and the 12 months before the interview and of their use, in the 12 months before the interview, of specific noninjection drugs that had not been prescribed for them. Current alcohol use was defined as drinking any alcohol, such as beer, wine, malt liquor, or hard liquor, in the 30 days before the interview. Participants reporting current alcohol use were asked on how many days they had consumed alcohol in the past 30 days and on average how many alcoholic beverages they consumed on the days they drank. Men were asked the number of times in the past 30 days they had consumed five or more alcoholic beverages at one sitting; women were asked the number of times they had consumed four or more alcoholic beverages at one sitting. Heavy drinking was defined as drinking, on average, more than two alcoholic beverages per day for men and more than one alcoholic beverage per day for women. Binge drinking was defined as having at least once, in the past 30 days, at least five alcoholic beverages at one sitting for men and at least four alcoholic beverages at one sitting for women.
Participants were asked about their noninjection drug use in the past 12 months of multiple types of drugs that had not been prescribed for them, including marijuana, crack, cocaine, heroin, methamphetamine, downers (e.g., Valium, Ativan, or Xanax), painkillers (e.g., Oxycontin, Vicodin, or Percocet), or any other noninjection drugs. Use of any noninjection drug was defined as use of one or more of the drugs listed above.
Sexually Transmitted Disease Diagnoses
Participants were asked whether they had been diagnosed by a health-care provider with any of the following in the 12 months before the interview: chlamydia, gonorrhea, syphilis, genital herpes, genital warts, or another STD. The percentages of participants reporting any STD, chlamydia, gonorrhea, or another STD are reported by sex and participant characteristics.
Use of Prevention Services and Programs
HIV Testing
History of HIV testing (lifetime or in the 12 months before the interview) is presented for all participants. The type of facility that administered the most recent HIV test and receipt of test result by facility type are reported for all participants tested in the 12 months before the interview. Reasons for not having received an HIV test in the 12 months before the interview are presented for all participants who reported their most recent test was >12 months before the interview or reported they had never been tested for HIV. Participants were asked to select from a list of reasons for not having been tested in the past 12 months (e.g., thought they were at low risk for HIV infection, fear of finding out they had HIV infection, and lack of time, money, or transportation). Participants could select more than one reason, and those who did were asked to indicate the most important reason.
Hepatitis B Vaccination
All participants were asked whether they had ever received a diagnosis of hepatitis; those reporting a previous hepatitis diagnosis were asked to indicate the type (A, B, C, or other). All participants were asked whether they had ever been vaccinated against hepatitis; those reporting hepatitis vaccination were asked the type. Hepatitis B vaccination was defined as having ever received a hepatitis B vaccine, regardless of whether it was a single or combination vaccine (i.e., against hepatitis B virus only or against both hepatitis A virus and B virus ).
Prevention Materials and Behavioral Interventions
Participants were asked whether they had received free condoms (excluding those given by a friend, relative, or sex partner) and whether they had participated in individual- or group-level HIV-related behavioral interventions in the 12 months before the interview. The definitions for both intervention types were based on those in CDC's evaluation system (17). Conversations that took place solely as a part of HIV testing (e.g., pretest or posttest counseling) were not considered HIV behavioral interventions. Participants who reported receiving free condoms or behavioral interventions were asked to report the type of organization that provided the condoms or intervention.
Results
A total of 12,544 persons were recruited to participate in the 2010 NHBS heterosexual cycle (Figure 2). Of the 12,478 participants screened for whom data were available, 11,066 (89%) were eligible for the interview. (Interview data for 66 participants were lost during electronic upload.) A total of 1,412 were not eligible for the interview: 49 lived outside the MSA; 53 did not identify as male or female; 193 were aged <18 years or >60 years; 230 had already participated; 830 did not report vaginal or anal sex with an opposite-sex partner in the 12 months before the interview; and 184 were not able to provide their consent to the survey (e.g., were too intoxicated or did not speak either English or Spanish well). Exclusion categories are not mutually exclusive. Of the 11,066 eligible persons, 11,061 agreed to participate and 10,933 completed the interview with valid data. A total of 1,655 completed interviews were excluded: 1) 730 participants did not meet the definition of a heterosexual at increased risk for HIV infection (i.e., reported income above poverty level and education greater than high school, 2) 816 participants reported engaging in male-male sex or injection drug use in the 12 months before the interview or did not provide this information, and 3) 197 participants reported a previous HIV-positive test result; exclusion categories were not mutually exclusive. A total of 9,278 participants met all inclusion criteria for analysis, including 126 participants (1.4%) who did not report a previous positive HIV test during the interview but who subsequently had a positive NHBS HIV test result.
Participant Characteristics
Approximately half (58%) of participants were aged 40–60 years. The majority of participants reported black race (72%) or Hispanic/Latino ethnicity (21%); the sample was evenly distributed by sex (Table 1). The majority of participants (64%) had never married and were not cohabiting. Most participants reported no more than a high school education (men: 86%; women: 83%) and very low incomes. For instance, most participants (87%) reported annual incomes of <$20,000, which is lower than the federal poverty guidelines for a family of four; approximately one in three (36%) reported annual incomes of <$5,000. Nearly three out of four (men: 72%; women: 73%) reported both income at or below poverty and no more than a high school education (data not shown). Approximately one third (31%) of participants were currently or had been homeless in the 12 months before the interview, and nearly half (46%) were uninsured.
With the exception of homelessness and health insurance, the demographic characteristics were similar for male and female participants. Approximately one third of male (35%) and female (27%) participants had been homeless at some time in the 12 months before the interview. Approximately one half (58%) of male and one third (36%) of female participants had no health insurance. For both male and female participants, the most frequently reported insurance was a publicly funded plan. Among those with publicly funded plans, the majority of both male (75%) and female (80%) participants reported coverage by Medicaid (data not shown).
Although the analysis sample excluded data from participants who reported they had recently (within 12 months of interview) injected drugs or had male-male sex, 14% of male participants reported that they had injected drugs or had sex with another man >12 months before the interview; 5% of female participants had injected drugs >12 months before the interview (data not shown). Each participating area contributed an average of 442 interviews (range: 131–565) to this analysis.
Sexual Behaviors
Number and Types of Partners
Among the 4,323 male participants, the median number of female sex partners in the 12 months before the interview was three (IQR: one to six); a total of 3,234 (75%) reported having more than one female sex partner in the 12 months before the interview (median: four; IQR: three to eight). A total of 3,266 (76%) reported a female main sex partner (median: one; IQR: one to two), and 3,112 (72%) reported having a female casual sex partner (median: three; IQR: two to seven). Overall, 2,055 (48%) reported having both main and casual female partners, and 801 (19%) reported having one or more female partners with whom they had exchanged money or drugs for sex in the 12 months before the interview (data not shown).
Among the 4,955 female participants, the median number of male sex partners in the 12 months before the interview was two (IQR: one to four); a total of 3,138 (63%) reported having more than one male sex partner in the 12 months before the interview (median: three; IQR: two to five). A total of 4,172 (84%) reported a male main sex partner (median: one; IQR: one to one), and 2,898 (58%) reported having a male casual sex partner (median: two; IQR: one to five). Overall, 2,115 (43%) reported having both main and casual male partners, and 910 (18%) reported having one or more male partners with whom they had exchanged money or drugs for sex in the 12 months before the interview (data not shown).
Types of Sexual Behaviors
Overall, 3,793 (88%) male participants reported having vaginal sex without a condom with a female partner in the 12 months before the interview, and 1,304 (30%) reported having anal sex without a condom with a female partner (Table 2). The percentages of men who had vaginal sex without a condom were similar among men in all categories of education and income. Anal sex without a condom was more common among male participants with lower levels of income.
A total of 4,467 (90%) female participants reported having vaginal sex without a condom with a male partner in the 12 months before the interview, and 1,420 (29%) reported having anal sex without a condom with a male partner (Table 3). The percentages of women who had vaginal sex without a condom were similar among women in all categories of education and income. Anal sex without a condom was more common among those with lower levels of income.
A total of 3,252 (75%) male participants reported having vaginal or anal sex with a female main partner, and 3,063 (71%) reported having vaginal or anal sex with a female casual partner (Table 4). Both vaginal or anal sex and vaginal or anal sex without a condom with main partners were more common among male participants who were married or cohabiting and those with higher incomes and less common among white men. Vaginal or anal sex and vaginal or anal sex without a condom with female casual partners were less common among male participants who were married or cohabiting and among those with higher incomes and were more common among white men.
A total of 4,154 (84%) of female participants reported having vaginal or anal sex with a male main partner, and 2,837 (57%) reported having vaginal or anal sex with a male casual partner (Table 5). Both vaginal or anal sex and vaginal or anal sex without a condom with a male main partner were more common among female participants who were married or cohabiting or had a higher income. Both vaginal or anal sex and vaginal or anal sex without a condom with male casual partners were less common among female participants who were married or cohabiting and those with higher incomes.
Alcohol Use
Approximately three fourths of male and two thirds of female participants had consumed an alcoholic beverage in the 30 days before the interview (i.e., were current drinkers) (Table 6). One fourth of male (25%) and female (25%) participants were classified as heavy drinkers. Heavy drinking increased with age and was most common among participants who had annual incomes of <$5,000 (men: 27%, women: 29%). Nearly one half of male participants (48%) and 40% of female participants reported binge drinking in the 30 days before the interview (Table 6). Among female participants, binge drinking was reported most frequently by those who were formerly married or had never been married and were not cohabiting. Among both male and female participants, binge drinking was least common among those aged 18–19 years (men: 36%, women: 28%) and most common among participants who participated in an alcohol or drug treatment program >12 months before the interview (men: 56%; women: 53%).
Noninjection Drug Use
Among the 9,278 participants, 5,440 (59%) had used noninjection drugs in the 12 months before the interview (Table 7). Most participants interviewed used marijuana (51%), followed by crack cocaine (15%), powdered cocaine (12%), painkillers (11%), and ecstasy (11%) (Table 7). For marijuana and powdered cocaine, a higher percentage of male participants reported use in the 12 months before the interview than did female participants. Compared with other racial/ethnic groups, lower percentages of Hispanics/Latinos reported using all drugs except powdered cocaine. Crack cocaine use was more commonly reported by participants who were aged ≥40 years (40–49 years: 28%; 50–60 years: 31%), were American Indian/Alaska Native (25%), were white (23%), or reported an annual income of <$5,000 (20%).
Sexually Transmitted Disease Diagnoses
Six percent of male and 14% of female participants reported receiving an STD diagnosis in the 12 months before the interview (Table 8). Among male participants, the percentages reporting an STD diagnosis were highest among those aged 20–29 years (8%–10%). Among female participants, percentages reporting an STD diagnosis decreased with increasing age and were highest among participants who were Asian/Native Hawaiian/Other Pacific Islander (16%), were black (16%), reported multiple racial identities (18%), reported public or other insurance (16%), or were sampled in one of the MSAs in the Midwest (22%). Chlamydia was the most commonly reported STD (men: 3%; women: 7%).
Use of Prevention Services and Programs
HIV Testing
Approximately three fourths of participants (men: 71%; women: 77%) had been tested for HIV infection during their lifetime, and approximately one third (men: 30%; women: 35%) had been tested in the 12 months before the interview (Table 9). Among both male and female participants, the percentages reporting that they had ever been tested for HIV were lowest among Asian/Native Hawaiian/Other Pacific Islander and Hispanic/Latino participants (men: 30% and 52%; women: 58% and 62%, respectively). Among male participants, the percentage ever tested was lowest among the two youngest age groups (18–19 years: 46%; 20–24 years: 63%); among female participants, the percentage ever tested was lowest among the youngest and oldest age groups (18–19 years: 61%; 50–60 years: 70%). Among participants who had visited a health-care provider in the 12 months before the interview, approximately three fourths (men: 76%; women: 81%) had ever been tested for HIV. Therefore, among participants who had visited a health-care provider in the 12 months before the interview, approximately one in four male participants and nearly one in five female participants had never been tested for HIV. Among both male and female participants, fewer than half of participants who reported being diagnosed with an STD in the 12 months before the interview reported receiving an HIV test during that same time frame (men: 44%; women: 42%).
Participants who had been tested in the 12 months before the interview were asked the location of their most recent HIV test and whether they received their HIV test result (Table 10). Among both male and female participants, the most commonly reported location for testing was public health clinics or community health centers (men: 23%; women: 27%). Most participants (men: 93%; women: 94%) had received the results of their most recent HIV test.
A total of 2,989 (69%) male and 3,212 (65%) female participants had not been tested for HIV in the 12 months before the interview. Among these participants, the most frequently reported main reason for not having an HIV test was low perceived risk for HIV infection (men: 31%; women: 23%) and fear of testing positive (men: 21%; women: 26%) (Table 11).
Hepatitis B Vaccination
Two percent of female participants and 1% of male participants reported ever having received a diagnosis of hepatitis B. Among the 4,260 male and 4,878 female participants who did not report a previous hepatitis B diagnosis, 21% and 30%, respectively, reported they had ever received a hepatitis B vaccine (Table 12); similar percentages were reported among male and female participants who reported that in the 12 months before the interview they had having received an STD diagnosis (men: 24%; women: 35%) or had two or more sex partners (men: 22%; women: 30%).
Prevention Materials and Behavioral Interventions
Approximately one third of participants (34%) reported having received free condoms in the 12 months before the interview, the majority of whom (66%) reported use of these condoms (Table 13). Among participants who received them, the percentage reporting use of free condoms was highest among male participants (71%), participants aged <30 years (18–19 years: 74%; 20–24 years: 71%; 25–29 years: 71%) and those who had never been married and were not cohabiting (69%); the percentage was lowest among white participants (58%). Overall, 995 (11%) participants interviewed had participated in an individual-level (7%) or group-level (5%) behavioral intervention in the 12 months before the interview (Table 13). The percentage of those participating in either an individual-level or group-level HIV behavioral intervention was lowest among participants who had not visited a health-care provider in the 12 months before the interview (6%) and was highest among participants aged 18–19 years (18%).
The most commonly reported sources of free condoms were health-care providers (men: 53%; women: 63%) and HIV/AIDS organizations (men: 35%; women: 31%) (Table 14). Among the 460 male and 535 female participants who participated in an HIV behavioral intervention in the 12 months before the interview, the most commonly reported sources of the intervention were health-care providers (men: 52%; women: 56%) and HIV/AIDS organizations (men: 46%; women: 41%).
Discussion
The 2010 NHBS heterosexual data-collection cycle focused on low SES as a marker of increased HIV acquisition risk among heterosexual adults who lived in 21 MSAs with a high percentage of AIDS. The majority of participants reported very low income levels, and many reported other social and economic vulnerabilities, including homelessness and lack of health insurance. A study conducted in 2014 (6) using nationally representative data collected during 1999–2010 reported lower HIV prevalence among low SES heterosexuals than was reported for participants in the 2010 NHBS heterosexual cycle (10). In addition, the percentage of the 2010 NHBS heterosexual participants reporting incomes of <$20,000 and the percentage uninsured were higher than among low SES men and women in a study conducted in 2014 using nationally representative data collected during 1999–2010 (6). Therefore, the NHBS heterosexual cycle RDS might reach a subgroup of low SES heterosexuals at particularly high risk for HIV relative to other low SES heterosexuals.
Sexual Behaviors
Having multiple sex partners has been found to be associated with HIV risk among heterosexuals (18). The number of partners reported by participants in the NHBS 2010 heterosexual cycle was substantially higher than in the general population. In the 2010 NHBS heterosexual cycle, 75% of men and 63% of women reported having more than one opposite-sex partner in the 12 months before the interview. Data from the National Survey of Family Growth indicate that 19% of males aged 15–44 years and 13% of females aged 15–44 years had more than one opposite-sex partner in the 12 months before the interview (19). However, having more than one sex partner in a 12-month period is more common among persons who are neither married nor cohabiting (19), and the percentage of NHBS participants who were neither married nor cohabiting was higher than the percentage that has been reported for men and women of reproductive age in the general population (20).
Exchange of sex for money or drugs has been associated with HIV infection in both male (21) and female (22) heterosexuals in the United States. Approximately one in five participants in the 2010 NHBS heterosexual sample reported having one or more exchange sex partners in the 12 months before the interview, a percentage that is substantially higher than has been reported for men and women in the general population (1%) (23) but that is similar to percentages in studies of low SES heterosexually active women that used similar sampling strategies as those used for the 2010 NHBS heterosexual sample (9,24).
Both vaginal and anal sex without the use of condoms poses a risk for HIV transmission. Nearly all male and female participants interviewed reported vaginal sex, and almost all reported vaginal sex without a condom with one or more partners. The high percentages of participants who reported vaginal sex without a condom is consistent with reports of other studies indicating that among heterosexually active adults in the United States, vaginal sex without a condom is common. For instance, a nationally representative study of black and Hispanic/Latino men and women found that 70%–80% did not use a condom during the last act of vaginal sex with a main partner, and 60%–90% did not use a condom during the last act vaginal sex with a casual partner (25). Among both men and women, nearly one out of three participants interviewed reported engaging in anal sex without a condom in the 12 months before the interview. Unprotected anal sex presents an even greater risk for HIV transmission than unprotected vaginal sex (26) and even if practiced relatively infrequently, unprotected anal sex might substantially increase the epidemic potential of HIV in heterosexual populations (27). Given the high percentages of participants reporting vaginal and anal sex without a condom, HIV transmission might be most effectively reduced by implementing prevention programs that are comprehensive with respect to various routes of transmission.
Alcohol
Alcohol use affects the transmission of HIV by increasing risky sexual behaviors (28–30) and has been shown to decrease adherence to HIV treatment (31,32). The proportion of participants in this survey who reported alcohol use and binge drinking was more than double the proportion observed in the general population (33–35). In the general population, binge drinking decreases with age and increases with income (33–35). Among participants in the 2010 NHBS heterosexual cycle, the majority of whom earned <$20,000 annually, at least 40% of participants in nearly all age and income categories reported binge drinking. Alcohol treatment can be effective at reducing problematic alcohol use (36); however, binge drinking was reported by approximately 50% of participants who had participated in a drug or alcohol treatment program >12 months before the interview. These results highlight opportunities for alcohol prevention efforts among low-income urban populations. Prevention strategies demonstrated to reduce alcohol misuse include those that focus on persons who are at risk, such as screening and brief intervention in clinical settings, as recommended by the U.S. Preventive Services Task Force (USPSTF) (37), and evidence-based structural interventions, such as regulation of alcohol outlet density and increasing alcohol excise taxes, as recommended by the Community Preventive Services Task Force (38).
Noninjection Drug Use
Drug use, including use of noninjection drugs, is associated with multiple negative health outcomes, including increased risk for HIV/AIDS (39). An estimated 64% of persons with HIV infection have never injected drugs but have used a noninjection drug at some point in their lifetime (40). The percentage of participants in the NHBS 2010 heterosexual cycle reporting noninjection drug use (59%) was higher than the overall percentage of adults in the United States general population that reported illicit (injection or noninjection) drug use (15%) and notably higher than adults across all categories of race, ethnicity, and education (range: 9%–22%) (41). Moreover, the percentage of participants in the NHBS 2010 heterosexual cycle who reported use of crack cocaine in the 12 months before the interview (15%) was substantially higher than the percentage reported for the general U.S. population (<1%) (23). Use of crack cocaine has been associated with HIV infection among heterosexuals in the United States (7,10,42). These results highlight opportunities for drug use prevention efforts among low-income urban populations. Strategies with demonstrated efficacy include screening, brief intervention, referral, and treatment (SBIRT) in general health-care settings (39).
Sexually Transmitted Disease Diagnoses
STDs are more common among low-income populations, including black and Hispanic/Latino heterosexuals (43,44), and might increase the likelihood of both transmission and acquisition of HIV (45–48). The percentage of NHBS participants reporting a recent STD diagnosis was higher than the percentage observed for men and women in the general U.S. household population with characteristics similar to the 2010 NHBS heterosexual cycle participants (e.g., low education or income, black race, or residence in a metropolitan central city) (23). Monitoring STD diagnoses among heterosexuals at increased risk for HIV might help in the development of HIV prevention planning through identification of subgroups that might benefit most from focused prevention efforts.
Use of Prevention Services and Programs
In 2010, the National HIV/AIDS Strategy for the United States (2) identified three primary goals to address HIV/AIDS in the United States (1): reduce the number of persons who become infected with HIV (2), increase access to care and optimize health outcomes for person living with HIV, and (3) reduce HIV-related health disparities. To accomplish these goals, a coordinated national response of HIV programs among federal, state, territorial, tribal, and local governments and agencies is required, as is the development of improved mechanisms to monitor and report on each goal's progress. Guided by the national strategy and evidence-based findings, CDC has adopted a high-impact HIV prevention approach toward reducing the number of new HIV infections in the United States (49). For persons at high risk for HIV infection, prevention interventions with evidence of effectiveness include such strategies as HIV testing, condom distribution, and selected behavioral interventions.
HIV Testing
Although HIV testing is considered the cornerstone of HIV prevention efforts (50), an estimated 18% of persons infected with HIV in the United States are unaware of their HIV status (51) and contribute disproportionately to the number of new infections (52). HIV-infected persons must know they are infected so that they can seek and receive treatment and prevention services, which are designed to improve health and reduce the likelihood that they will transmit HIV to others. In 2006, CDC revised the recommendations for HIV testing of adults, adolescents, and pregnant women in health-care settings. The CDC HIV testing recommendations include 1) routine HIV testing in health-care settings with a prevalence of ≥0.1% for undiagnosed infections, 2) at least annual testing for persons at high risk for HIV infection, and 3) routine testing for pregnant women (53). Persons likely to be at high risk include persons seeking treatment for an STD; persons who exchange sex for money or drugs; IDUs; MSM; sex partners of IDUs, MSM, and HIV-infected persons; and persons who have had a new sex partner since their last HIV test (53). USPSTF recently released recommendations that are consistent with the 2006 CDC HIV testing recommendations (54). These recommendations were written with the goal of increasing HIV status awareness, detecting HIV infection earlier, and linking persons with previously unrecognized HIV infection to medical care and prevention services (54,55).
The percentage of participants ever tested and tested in the 12 months before the interview was higher than has been reported from samples of the general U.S. population (56); however, they are comparable to those reported for men and women in the general population with characteristics similar to those in the sample in this report (e.g., low education or income, black race or Hispanic/Latino ethnicity, and residence in a metropolitan central city) (57).
Nevertheless, the data in this report suggest that increasing the percentage of heterosexuals at increased risk for HIV infection who are tested at least once might contribute to HIV prevention efforts in this group. In 2010, HIV was a leading cause of death for reproductive-age black and Hispanic/Latino women in the United States (58). However, nearly one third of Hispanic/Latino female participants and nearly one fifth of black female participants had never been tested for HIV. In addition, although HIV testing is recommended for persons who are seeking treatment for or have a diagnosis of another STD (53), less than one half of participants who reported that they received an STD diagnosis in the 12 months before the interview had received an HIV test in that time. Routine HIV testing, as recommended by CDC and USPSTF, can be used to identify persons infected with HIV who have yet to receive the diagnosis and link them with primary and secondary prevention services (59).
Hepatitis B Vaccination
In the United States, the most common source of hepatitis B infection is sexual contact, and heterosexual contact accounts for more than one third (39%) of infections among adults (60). Hepatitis B vaccination is recommended for all unvaccinated persons at increased risk for infection, including sexually active heterosexual males and females with more than one partner and persons seeking STD evaluation or treatment (60). However, less than half of participants with hepatitis B risk factors (e.g., an STD diagnosis or multiple sex partners) reported having ever been vaccinated for hepatitis B. A strategy that might facilitate hepatitis B vaccination includes informing all adult patients of the benefits of hepatitis B vaccination during visits with health-care professionals (60).
Behavioral Interventions
Behavioral interventions can substantially reduce sexual risk behaviors and therefore the likelihood of acquiring HIV (61). Interventions found to be most effective in changing behavior are those that include skill training and negotiation practice (61). Individual-level and group-level structural and behavioral interventions with demonstrated effectiveness have been a focus of CDC prevention efforts (62). Such interventions have been shown to reduce HIV-associated behaviors among black and Hispanic/Latino populations (63–65). However, the percentage of participants in the 2010 heterosexual cycle who reported participating in such an intervention was very low.
CDC's high-impact prevention strategy prioritizes interventions that are most cost-effective in reducing new HIV infections, can be implemented on a large scale, and reach large numbers of the groups most affected by HIV. Condom distribution and HIV testing have been demonstrated to be cost-effective (66–68). HIV behavioral surveillance among heterosexuals at increased risk for HIV infection can help in the development of prevention planning by helping state and local health departments and federal agencies identify groups that might benefit from more resource-intensive efforts, such as individual-level or group-level behavioral interventions. As HIV prevention activities for heterosexuals at increased risk continue to be developed and implemented, NHBS will provide updated data on the delivery of these services and programs to the populations who most need them.
Limitations
The findings in this report are subject to at least three limitations. First, the data in this report were obtained from heterosexuals at increased risk for HIV infection (i.e., low SES residents of select MSAs with high AIDS prevalence), and the data were not weighted to account for variations in recruitment pattern or network size or the likelihood of being selected to participate in the survey. Therefore, the results might not be generalizable to other heterosexuals outside of or within the participating MSAs. Second, data on risk and protective behaviors and HIV status were obtained through participant self-report. Social desirability bias might have led to overreporting of socially valued behaviors, such as HIV testing, and underreporting of socially stigmatized behaviors or conditions, such as sex without a condom or an HIV diagnosis. In addition, recall error and lack of information might have affected participants' reports of whether certain behaviors and experiences occurred within the reporting period or at all. Finally, no statistical tests were conducted; differences between groups should be interpreted with caution.
Conclusion
The National HIV/AIDS Strategy for the United States delineates a coordinated national response to reduce infections and HIV-related health disparities among disproportionately affected groups. State and local health departments as well as federal agencies are expected to monitor progress toward the strategy's goals. A nationally united effort and strategy will help reduce the prevalence and sequelae of HIV in groups at risk for infection and help reduce the disproportionate effects of HIV among groups such as blacks, Hispanics/Latinos, and persons of low SES. NHBS data can be used to guide national and local planning efforts to maximize the impact of HIV prevention programs.
NHBS is a key component of the comprehensive CDC approach to reducing the spread of HIV infection in the United States and will continue to be the primary source of data for monitoring the behaviors of populations at high risk for HIV, including heterosexuals at increased risk for infection. Data from NHBS can be used to monitor specific risk behaviors, HIV testing experiences, and use of HIV prevention activities; identify demographic and behavioral correlates of HIV risk-related behaviors; and develop future prevention activities to reduce HIV transmission.
References
- CDC. Diagnoses of HIV infection in the United States and dependent areas. HIV Surveillance Report, 2011. Vol. 23. Atlanta, GA: US Department of Health and Human Services, CDC; 2013. Available at http://www.cdc.gov/hiv/pdf/statistics_2011_HIV_Surveillance_Report_vol_23.pdf.
- Office of National AIDS Policy. National HIV/AIDS strategy for the United States. Washington, DC: Office of National AIDS Policy; 2010. Available at http://www.whitehouse.gov/sites/default/files/uploads/NHAS.pdf.
- Hall HI, Espinoza L, Benbow N, Hu YW. Urban Areas HIV Surveillance Workgroup. Epidemiology of HIV infection in large urban areas in the United States. PLoS ONE 2010;5:e12756.
- Gallagher KM, Sullivan PS, Lansky A, Onorato IM. Behavioral surveillance among people at risk for HIV infection in the U.S.: the National HIV Behavioral Surveillance System. Public Health Rep 2007;122(Suppl 1):32–8.
- DiNenno EA, Oster AM, Sionean C, Denning P, Lansky A. Piloting a system for behavioral surveillance among heterosexuals at increased risk of HIV in the United States. Open AIDS 2012;6(Suppl 1: M15):169–76.
- Oster AM, Sternberg M, Nebenzahl S, et al. Prevalence of HIV, sexually transmitted infections, and viral hepatitis by urbanicity, among men who have sex with men, injection drug users, and heterosexuals in the United States. Sex Transm Dis 2014;41:272–9.
- Adimora AA, Schoenbach VJ, Martinson FEA, et al. Heterosexually transmitted HIV infection among African Americans in North Carolina. J Acquir Immune Defic Syndr 2006;41:616–23.
- CDC. Social determinants of health among adults with diagnosed HIV infection in 18 areas, 2005–2009. HIV Surveillance Supplemental Report. Vol. 18, No. 4. Atlanta, GA: US Department of Health and Human Services, CDC; 2013. Available at http://www.cdc.gov/hiv/pdf/statistics_2005_2009_HIV_Surveillance_Report_vol_18_n4.pdf.
- Hodder SL, Justman J, Hughes JP, et al.; HIV Prevention Trials Network 064; Women's HIV SeroIncidence Study Team. HIV acquisition among women from selected areas of the United States: a cohort study. Ann Intern Med 2013;158:10–8.
- CDC. HIV infection among heterosexuals at increased risk—United States, 2010. MMWR Morb Mortal Wkly Rep 2013;62:183–8.
- CDC. Data security and confidentiality guidelines for HIV, viral hepatitis, sexually transmitted disease, and tuberculosis programs: standards to facilitate sharing and use of surveillance data for public health action. Atlanta, GA: US Department of Health and Human Services, CDC. Available at http://www.cdc.gov/nchhstp/programintegration/docs/PCSIDataSecurityGuidelines.pdf.
- CDC. Diagnosed HIV infection among adults and adolescents in metropolitan statistical areas—United States and Puerto Rico, 2010. HIV Surveillance Supplemental Report. Vol. 18, No. 1. Atlanta, GA: US Department of Health and Human Services, CDC; 2013. Available at http://www.cdc.gov/hiv/surveillance/resources/reports/2010supp_vol18no1/index.htm.
- Lansky A, Abdul-Quader AS, Cribbin M, et al. Developing an HIV behavioral surveillance system for injecting drug users: the National HIV Behavioral Surveillance System. Public Health Rep 2007;122(Suppl 1):48–55.
- United States Census Bureau. Poverty. Washington, DC: United States Census Bureau. Available at http://www.census.gov/hhes/www/poverty/methods/definitions.html.
- US Department of Health and Human Services. Annual update of the HHS poverty guidelines. Federal Register 2009;74:4199–201. Available at http://aspe.hhs.gov/poverty/09fedreg.pdf.
- United States Census Bureau. Census bureau regions and divisions with state FIPS codes. Washington, DC: United States Census Bureau. Available at http://www.census.gov/geo/reference/gtc/gtc_census_divreg.html.
- CDC. High-impact HIV prevention. US Department of Health and Human Services, CDC. Available at http://www.effectiveinterventions.org.
- Mermin J, Musinguzi J, Opio A, et al. Risk factors for recent HIV infection in Uganda. JAMA 2008;300:540–9.
- Chandra A, Mosher WD, Copen C, Sionean C. Sexual behavior, sexual attraction, and sexual identity in the United States: data from the 2006–2008 National Survey of Family Growth. Natl Health Stat Report 2011:1–36. Available at http://www.cdc.gov/nchs/data/nhsr/nhsr036.pdf.
- Goodwin PY, Mosher WD, Chandra A. Marriage and cohabitation in the United States: A statistical portrait based on Cycle 6 (2002) of the National Survey of Family Growth. Vital Health Stat 2010;23(28).
- Jenness SM, Kobrak P, Wendel T, Neaigus A, Murrill CS, Hagan H. Patterns of exchange sex and HIV infection in high-risk heterosexual men and women. J Urban Health 2011;88:329–41.
- Polk S, Ellen JM, Fichtenberg C, Huettner S, Jennings JM. HIV prevalence overall and among high-HIV-risk behaviorally defined subgroups among heterosexuals at community-based venues in a mid-Atlantic, U.S. city. J Urban Health 2013;90:747–57.
- Chandra A, Billioux VG, Copen CE, Sionean C. HIV risk-related behaviors in the United States household population aged 15–44 years: data from the National Survey of Family Growth, 2002 and 2006–2010. Natl Health Stat Report 2012;46:1–19. Available at http://www.cdc.gov/nchs/data/nhsr/nhsr046.pdf.
- Koblin BA, Metch B, Novak RM, et al. Feasibility of identifying a cohort of U.S. women at high risk for HIV infection for HIV vaccine efficacy trials: longitudinal results of HVTN 906. J Acquir Immune Defic Syndr 2013;53:239–44.
- Dodge B, Reece M, Herbenick D, Schick V, Sanders SA, Fortenberry JD. Sexual health among U.S. black and Hispanic men and women: a nationally representative study. J Sex Med 2010;7(Suppl 5):330–45.
- Baggaley RF, White RG, Boily MC. HIV transmission risk through anal intercourse: systematic review, meta-analysis and implications for HIV prevention. Int J Epidemiol 2010;39:1048–63.
- Baggaley RF, Dimitrov D, Owen BN, et al. Heterosexual anal intercourse: a neglected risk factor for HIV? Am J Reprod Immunol 2013;69(Suppl 1):95–105.
- Fisher JC, Cook PA, Kapiga SH. Alcohol use before sex and HIV risk: situational characteristics of protected and unprotected encounters among high-risk African women. Sex Transm Dis 2010;37:571–8.
- Fisher JC, Cook PA, Sam NE, Kapiga SH. Patterns of alcohol use, problem drinking, and HIV infection among high-risk African women. Sex Transm Dis 2008;35:537–44.
- Raj A, Reed E, Santana MC, et al. The associations of binge alcohol use with HIV/STI risk and diagnosis among heterosexual African American men. Drug Alcohol Depend 2009;101:101–6.
- Lucas GM, Gebo KA, Chaisson RE, Moore RD. Longitudinal assessment of the effects of drug and alcohol abuse on HIV-1 treatment outcomes in an urban clinic. AIDS 2002;16:767–74.
- Azar MM, Springer SA, Meyer JP, Altice FL. A systematic review of the impact of alcohol use disorders on HIV treatment outcomes, adherence to antiretroviral therapy and health care utilization. Drug Alcohol Depend 2010;112:178–93.
- CDC. Binge drinking—United States, 2009. MMWR Suppl 2011;60(Suppl):101–4.
- CDC. Sociodemographic differences in binge drinking among adults—14 states, 2004. MMWR Morb Mortal Wkly Rep 2009;58:301–4.
- CDC. Vital signs: binge drinking among high school students and adults—United States, 2009. MMWR Morb Mortal Wkly Rep 2010;59:1274–9.
- Berglund M, Thelander S, Salaspuro M, Franck J, Andréasson S, Ojehagen A. Treatment of alcohol abuse: an evidence-based review. Alcohol Clin Exp Res 2003;27:1645–56.
- Moyer VA; Preventive Services Task Force. Screening and behavioral counseling interventions in primary care to reduce alcohol misuse: U.S. preventive services task force recommendation statement. Ann Intern Med 2013;159:210–8.
- CDC. Preventing excessive alcohol consumption. Atlanta, GA: US Department of Health and Human Services, CDC. Available at http://www.thecommunityguide.org/alcohol/index.html.
- CDC. Integrated prevention services for HIV infection, viral hepatitis, sexually transmitted diseases, and tuberculosis for persons who use drugs illicitly: summary guidance from CDC and the U.S. Department of Health and Human Services. MMWR Recomm Rep 2012;61(No. RR-5).
- Substance Abuse and Mental Health Services Administration. HIV/AIDS and substance abuse. The NSDUH Report. Rockville, MD: US Department of Health and Human Services, Substance Abuse and Mental Health Services Administration; 2010. Available at http://oas.samhsa.gov/2k10/210/HIV-AIDS-html.pdf.
- Substance Abuse and Mental Health Services Administration. Results from the 2010 National Survey on Drug Use and Health: summary of national findings. NSDUH Series H-41. HHS Publication No. (SMA) 11-4658. Rockville, MD: Substance Abuse and Mental Health Services Administration; 2011.
- CDC. Characteristics associated with HIV infection among heterosexuals in urban areas with high AIDS prevalence—24 cities, United States, 2006–2007. MMWR Morb Mortal Wkly Rep 2011;60:1045–9.
- CDC. Sexually transmitted disease surveillance, 2010. Atlanta, GA: US Department of Health and Human Services, CDC; 2011. Available at http://www.cdc.gov/std/stats10/surv2010.pdf.
- Datta SD, Sternberg M, Johnson RE, et al. Gonorrhea and chlamydia in the United States among persons 14 to 39 years of age, 1999 to 2002. Ann Intern Med 2007;147:89–96.
- Freeman EE, Weiss HA, Glynn JR, Cross PL, Whitworth JA, Hayes RJ. Herpes simplex virus 2 infection increases HIV acquisition in men and women: systematic review and meta-analysis of longitudinal studies. AIDS 2006;20:73–83.
- Johnson LF, Lewis DA. The effect of genital tract infections on HIV-1 shedding in the genital tract: a systematic review and meta-analysis. Sex Transm Dis 2008;35:946–59.
- Mayer KH, Venkatesh KK. Interactions of HIV, other sexually transmitted diseases, and genital tract inflammation facilitating local pathogen transmission and acquisition. Am J Reprod Immunol 2011;65:308–16.
- Ward H, Rönn M. Contribution of sexually transmitted infections to the sexual transmission of HIV. Curr Opin HIV AIDS 2010;5:305–10.
- CDC. High-impact HIV prevention: CDC's approach to reducing HIV infections in the United States. Atlanta, GA: US Department of Health and Human Services, CDC; 2011. Available at http://www.cdc.gov/hiv/policies/hip.html.
- Heffelfinger JD, Owen SM, Hendry RM, Lansky A. HIV testing: the cornerstone of HIV prevention efforts in the USA. Future Virol 2011;6:1299–317.
- CDC. Monitoring selected national HIV prevention and care objectives by using HIV surveillance data—United States and 6 U.S. dependent areas—2010. HIV Surveillance Supplemental Report, 2012. Vol. 17, No. 3, Part A. Atlanta, GA: US Department of Health and Human Services, CDC; 2012. Available at http://www.cdc.gov/hiv/pdf/statistics_2010_HIV_Surveillance_Report_vol_17_no_3.pdf.
- Marks G, Crepaz N, Janssen RS. Estimating sexual transmission of HIV from persons aware and unaware that they are infected with the virus in the USA. AIDS 2006;20:1447–50.
- CDC. Revised recommendations for HIV testing of adults, adolescents, and pregnant women in health-care settings. MMWR Recomm Rep 2006;55(No. RR-14).
- Moyer VA; US Preventive Services Task Force. Screening for HIV: U.S. Preventive Services Task Force recommendation statement. Ann Intern Med 2013;159:51–60.
- CDC. Evolution of HIV/AIDS prevention programs—United States, 1981–2006. MMWR Morb Mortal Wkly Rep 2006;55:597–603.
- CDC. HIV testing trends in the United States, 2000–2011. Atlanta, GA: US Department of Health and Human Services, CDC; 2013. Available at http://www.cdc.gov/hiv/pdf/testing_trends.pdf.
- Chandra A, Billioux VG, Copen CE, Balaji A, DiNenno E. HIV testing in the U.S. household population aged 15–44: data from the National Survey of Family Growth, 2006–2010. Natl Health Stat Report 2012;58:1–26. Available at http://www.cdc.gov/nchs/data/nhsr/nhsr058.pdf
- CDC. Deaths, percent of total deaths, and death rates for the 15 leading causes of death in 5-year age groups, by Hispanic origin, race for non-Hispanic population and sex: United States, 2010. National Vital Stat System. Atlanta, GA: US Department of Health and Human Services, CDC; 2012. Available at http://www.cdc.gov/nchs/data/dvs/LCWK4_2010.pdf.
- Steiner RJ, Aquino G, Fenton KA. Enhancing HIV/AIDS, viral hepatitis, sexually transmitted disease, and tuberculosis prevention in the United States through program collaboration and service integration: the case for broader implementation. Sex Transm Dis 2013;40:663–8.
- CDC. A comprehensive immunization strategy to eliminate transmission of hepatitis B virus infection in the United States: recommendations of the Advisory Committee on Immunization Practices (ACIP) Part II: immunization of adults. MMWR Recomm Rep 2006;55(No. RR-16).
- Lyles CM, Kay LS, Crepaz N, et al.; HIV/AIDS Prevention Research Synthesis Team. Best-evidence interventions: findings from a systematic review of HIV behavioral interventions for U.S. populations at high risk, 2000–2004. Am J Public Health 2007;97:133–43.
- CDC. Compendium of evidence-based HIV behavioral interventions. Atlanta, GA: US Department of Health and Human Services, CDC; 2013. Available at http://www.cdc.gov/hiv/prevention/research/compendium/index.html.
- Crepaz N, Horn AK, Rama SM, et al.; HIV/AIDS Prevention Research Synthesis Team. The efficacy of behavioral interventions in reducing HIV risk sex behaviors and incident sexually transmitted disease in black and Hispanic sexually transmitted disease clinic patients in the United States: a meta-analytic review. Sex Transm Dis 2007;34:319–32.
- Darbes L, Crepaz N, Lyles C, Kennedy G, Rutherford G. The efficacy of behavioral interventions in reducing HIV risk behaviors and incident sexually transmitted diseases in heterosexual African Americans. AIDS 2008;22:1177–94.
- Henny KD, Crepaz N, Lyles CM, et al. Efficacy of HIV/STI behavioral interventions for heterosexual African American men in the United States: a meta-analysis. AIDS Behav 2012;16:1092–114.
- Bedimo AL, Pinkerton SD, Cohen DA, Gray B, Farley TA. Condom distribution: a cost-utility analysis. Int J STD AIDS 2002;13:384–92.
- Farnham PG, Sansom SL, Hutchinson AB. How much should we pay for a new HIV diagnosis? A mathematical model of HIV screening in U.S. clinical settings. Med Decis Making 2012;32:459–69.
- Metsch LR, Feaster DJ, Gooden L, et al. Effect of risk-reduction counseling with rapid HIV testing on risk of acquiring sexually transmitted infections: the AWARE randomized clinical trial. JAMA 2013;310:1701–10.
National HIV Behavioral Surveillance System Study Group
Jianglan White, Laura Salazar, Jeff Todd, Atlanta, Georgia; Colin Flynn, Danielle German, Baltimore, Maryland; Maura Driscoll, Rose Doherty, Chris Wittke, Boston, Massachusetts; Nikhil Prachand, Nanette Benbow, Chicago, Illinois; Sharon Melville, Shane Sheu, Alicia Novoa, Dallas, Texas; Mark Thrun, Alia Al-Tayyib, Ralph Wilmoth, Denver, Colorado; Vivian Griffin, Emily Higgins, Karen MacMaster, Detroit, Michigan; Jan Risser, Aaron Sayegh, Hafeez Rehman, Houston, Texas; Trista Bingham, Ekow Kwa Sey, Los Angeles, California; Marlene LaLota, Lisa Metsch, David Forrest, Miami, Florida; Bridget J. Anderson, Carol-Ann Watson, Lou Smith, Nassau-Suffolk, New York; DeAnn Gruber, William T. Robinson, Narquis Barak, New Orleans, Louisiana; Alan Neaigus, Samuel Jenness, Holly Hagan, New York City, New York; Barbara Bolden, Sally D'Errico, Henry Godette Newark, New Jersey; Kathleen A. Brady, Andrea Sifferman Philadelphia, Pennsylvania; Vanessa Miguelino-Keasling, Al Velasco, San Diego, California; H. Fisher Raymond, San Francisco, California; Sandra Miranda De León, Yadira Rolón-Colón, Melissa Marzan, San Juan, Puerto Rico; Hanne Thiede, Richard Burt, Seattle, Washington; Michael Herbert, Yelena Friedberg, Dale Wrigley, St. Louis, Missouri; Manya Magnus, Irene Kuo, Tiffany West, Washington, DC; Behavioral Surveillance Team, Division of HIV/AIDS Prevention, CDC.
FIGURE 1. Participating metropolitan statistical areas — National HIV Behavioral Surveillance System: heterosexuals at increased risk for HIV infection, 21 U.S. cities, 2010
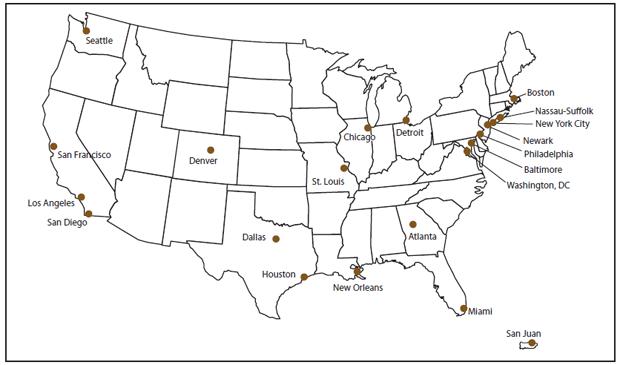
Alternate Text: This figure is a map of the United States showing the 21 participating metropolitan statistical areas for the National HIV Behavioral Surveillance System (heterosexuals at increased risk for HIV infection), 2010: Atlanta, Georgia; Baltimore, Maryland; Boston, Massachusetts; Chicago, Illinois; Dallas, Texas; Denver, Colorado; Detroit, Michigan; Houston, Texas; Los Angeles, California; Miami, Florida; Nassau-Suffolk, New York; New Orleans, Louisiana; New York City, New York; Newark, New Jersey; Philadelphia, Pennsylvania; San Diego, California; San Francisco, California; San Juan, Puerto Rico; Seattle, Washington; St. Louis, Missouri; and Washington, DC.
FIGURE 2. Exclusion criteria and analysis sample — National HIV Behavioral Surveillance System: heterosexuals at increased risk for HIV infection, 21 U.S. cities, 2010
![This figure is a flow chart showing the exclusion criteria and analysis sample for the National HIV Behavioral Surveillance System (heterosexuals at increased risk for HIV infection), 2010. Recruited (n = 12,544): excluded (n = 1,478); survey data lost during upload (66); not eligible (1,412) (includes participants who lived outside a participating metropolitan statistical area [49], did not identify as male or female [53], were aged <18 years or >60 years [193], had previously participated [230], had not had sex with an opposite-sex partner in the 12 months before the interview [830], or were unable to provide consent [184]. Categories are not mutually exclusive.) Eligible to participate (n = 11,066): excluded (n = 133); did not consent to interview (5); incomplete or invalid survey data (128). Completed interviews with valid data (n = 10,933): excluded (1,655) (reasons for exclusion not mutually exclusive); did not meet definition of heterosexual at increased risk (730) (reported income greater than federal poverty guidelines and education greater than high school); male-male sex or injection drug use within 12 months before the interview (816) (includes those who did not provide this information); reported a previous HIV-positive test result (197). Heterosexual participants at increased risk for HIV infection (n = 9,278) (includes 126 participants who did not report a previous HIV-positive test result during the interview but who subsequently had a positive NHBS test result).](figures/s6314a1f2.gif)
Abbreviations: HIV = human immunodeficiency virus; NHBS = National HIV Behavioral Surveillance System.
* Includes participants who lived outside a participating metropolitan statistical area (49), did not identify as male or female (53), were aged <18 years or >60 years (193), had previously participated (230), had not had sex with an opposite-sex partner in the 12 months before interview (830), or were unable to provide consent (184). Categories are not mutually exclusive.
† Reasons for exclusion were not mutually exclusive.
§ Reported income greater than federal poverty guidelines and education greater than high school.
¶ Includes those who did not provide this information.
** Includes 126 participants who did not report a previous HIV-positive test result during the interview but who subsequently had a positive NHBS test result.
Alternate Text: This figure is a flow chart showing the exclusion criteria and analysis sample for the National HIV Behavioral Surveillance System (heterosexuals at increased risk for HIV infection), 2010. Recruited (n = 12,544): excluded (n = 1,478); survey data lost during upload (66); not eligible (1,412) (includes participants who lived outside a participating metropolitan statistical area [49], did not identify as male or female [53], were aged <18 years or >60 years [193], had previously participated [230], had not had sex with an opposite-sex partner in the 12 months before the interview [830], or were unable to provide consent [184]. Categories are not mutually exclusive.) Eligible to participate (n = 11,066): excluded (n = 133); did not consent to interview (5); incomplete or invalid survey data (128). Completed interviews with valid data (n = 10,933): excluded (1,655) (reasons for exclusion not mutually exclusive); did not meet definition of heterosexual at increased risk (730) (reported income greater than federal poverty guidelines and education greater than high school); male-male sex or injection drug use within 12 months before the interview (816) (includes those who did not provide this information); reported a previous HIV-positive test result (197). Heterosexual participants at increased risk for HIV infection (n = 9,278) (includes 126 participants who did not report a previous HIV-positive test result during the interview but who subsequently had a positive NHBS test result).
|
TABLE 1. (continued) Number* and percentage† of participants, by selected characteristics and metropolitan statistical area — National HIV Behavioral Surveillance System: heterosexuals at increased risk for HIV infection, 21 U.S. cities, 2010 |
||||||
|---|---|---|---|---|---|---|
|
Characteristic |
Male |
Female |
Total |
|||
|
No. |
(%) |
No. |
(%) |
No. |
(%) |
|
|
Region¶¶ |
||||||
|
Northeast |
889 |
(21) |
904 |
(18) |
1,793 |
(19) |
|
South |
1,359 |
(31) |
1,590 |
(32) |
2,949 |
(32) |
|
Midwest |
760 |
(18) |
800 |
(16) |
1,560 |
(17) |
|
West |
1,147 |
(27) |
1,354 |
(27) |
2,501 |
(27) |
|
Territories |
168 |
(4) |
307 |
(6) |
475 |
(5) |
|
Metropolitan statistical area |
||||||
|
Atlanta, Georgia |
112 |
(3) |
139 |
(3) |
251 |
(3) |
|
Baltimore, Maryland |
144 |
(3) |
167 |
(3) |
311 |
(3) |
|
Boston, Massachusetts |
77 |
(2) |
133 |
(3) |
210 |
(2) |
|
Chicago, Illinois |
275 |
(6) |
178 |
(4) |
453 |
(5) |
|
Dallas, Texas |
199 |
(5) |
269 |
(5) |
468 |
(5) |
|
Denver, Colorado |
210 |
(5) |
309 |
(6) |
519 |
(6) |
|
Detroit, Michigan |
227 |
(5) |
324 |
(7) |
551 |
(6) |
|
Houston, Texas |
242 |
(6) |
274 |
(6) |
516 |
(6) |
|
Los Angeles, California |
272 |
(6) |
251 |
(5) |
523 |
(6) |
|
Miami, Florida |
242 |
(6) |
215 |
(4) |
457 |
(5) |
|
Nassau-Suffolk, New York |
92 |
(2) |
39 |
(1) |
131 |
(1) |
|
New Orleans, Louisiana |
209 |
(5) |
286 |
(6) |
495 |
(5) |
|
New York City, New York |
244 |
(6) |
191 |
(4) |
435 |
(5) |
|
Newark, New Jersey |
266 |
(6) |
247 |
(5) |
513 |
(6) |
|
Philadelphia, Pennsylvania |
210 |
(5) |
294 |
(6) |
504 |
(5) |
|
San Diego, California |
250 |
(6) |
315 |
(6) |
565 |
(6) |
|
San Francisco, California |
174 |
(4) |
246 |
(5) |
420 |
(5) |
|
San Juan, Puerto Rico |
168 |
(4) |
307 |
(6) |
475 |
(5) |
|
Seattle, Washington |
241 |
(6) |
233 |
(5) |
474 |
(5) |
|
St. Louis, Missouri |
258 |
(6) |
298 |
(6) |
556 |
(6) |
|
Washington, DC |
211 |
(5) |
240 |
(5) |
451 |
(5) |
|
Total |
4,323 |
(47) |
4,955 |
(53) |
9,278 |
(100) |
|
Abbreviation: HIV = human immunodeficiency virus. * Numbers might not add to total because of missing data. † Percentages might not add to 100 because of rounding. All percentages are column percentages. § Persons of Hispanic/Latino ethnicity might be of any race. ¶ Living on the street, in a shelter, or in a single room occupancy hotel; temporarily staying with friends or family; or living in a car. ** Coverage through private insurance policies or employer, TRICARE, CHAMPUS, or membership in a health maintenance organization. †† Coverage through Medicare, Medicaid, plans funded by state or local governments, or the Veterans Administration. §§ Visited a physician, nurse, or other health-care provider in the past 12 months. ¶¶ Northeast: Boston, Massachusetts; Nassau-Suffolk, New York; New York City, New York; Newark, New Jersey; Philadelphia, Pennsylvania. South: Atlanta, Georgia; Baltimore, Maryland; Dallas, Texas; Houston, Texas; Miami, Florida; New Orleans, Louisiana; Washington, DC. Midwest: Chicago, Illinois; Detroit, Michigan; St. Louis, Missouri. West: Denver, Colorado; Los Angeles, California; San Diego, California; San Francisco, California; Seattle, Washington. Territories: San Juan, Puerto Rico. |
||||||
|
TABLE 2. (continued) Number* and percentage† of male participants who reported engaging in specified sexual behaviors with one or more female partners in the 12 months before the interview, by selected characteristics and metropolitan statistical area — National HIV Behavioral Surveillance System: heterosexuals at increased risk for HIV infection, 21 U.S. cities, 2010 |
|||||||||
|---|---|---|---|---|---|---|---|---|---|
|
Characteristic |
Male participants with female sex partners |
||||||||
|
Vaginal sex |
Vaginal sex without |
Anal sex |
Anal sex without |
Total |
|||||
|
No. |
(%)¶ |
No. |
(%)¶ |
No. |
(%)¶ |
No. |
(% )¶ |
||
|
Boston, Massachusetts |
76 |
(99) |
65 |
(84) |
31 |
(40) |
25 |
(32) |
77 |
|
Chicago, Illinois |
275 |
(100) |
252 |
(92) |
137 |
(50) |
115 |
(42) |
275 |
|
Dallas, Texas |
199 |
(100) |
182 |
(91) |
69 |
(35) |
55 |
(28) |
199 |
|
Denver, Colorado |
209 |
(100) |
193 |
(92) |
66 |
(31) |
57 |
(27) |
210 |
|
Detroit, Michigan |
226 |
(100) |
191 |
(84) |
91 |
(40) |
60 |
(26) |
227 |
|
Houston, Texas |
242 |
(100) |
216 |
(89) |
80 |
(33) |
61 |
(25) |
242 |
|
Los Angeles, California |
270 |
(99) |
250 |
(92) |
118 |
(43) |
100 |
(37) |
272 |
|
Miami, Florida |
240 |
(99) |
211 |
(87) |
94 |
(39) |
83 |
(34) |
242 |
|
Nassau-Suffolk, New York |
92 |
(100) |
79 |
(86) |
35 |
(38) |
22 |
(24) |
92 |
|
New Orleans, Louisiana |
207 |
(99) |
182 |
(87) |
69 |
(33) |
60 |
(29) |
209 |
|
New York City, New York |
244 |
(100) |
205 |
(84) |
110 |
(45) |
80 |
(33) |
244 |
|
Newark, New Jersey |
265 |
(100) |
228 |
(86) |
107 |
(40) |
79 |
(30) |
266 |
|
Philadelphia, Pennsylvania |
209 |
(100) |
173 |
(82) |
46 |
(22) |
36 |
(17) |
210 |
|
San Diego, California |
250 |
(100) |
221 |
(88) |
95 |
(38) |
79 |
(32) |
250 |
|
San Francisco, California |
173 |
(99) |
138 |
(79) |
59 |
(34) |
37 |
(21) |
174 |
|
San Juan, Puerto Rico |
167 |
(99) |
158 |
(94) |
126 |
(75) |
111 |
(66) |
168 |
|
Seattle, Washington |
241 |
(100) |
210 |
(87) |
72 |
(30) |
51 |
(21) |
241 |
|
St. Louis, Missouri |
258 |
(100) |
229 |
(89) |
67 |
(26) |
46 |
(18) |
258 |
|
Washington, DC |
210 |
(100) |
178 |
(84) |
79 |
(37) |
63 |
(30) |
211 |
|
Total |
4,308 |
(100) |
3,793 |
(88) |
1,657 |
(38) |
1,304 |
(30) |
4,323 |
|
Abbreviation: HIV = human immunodeficiency virus. * Numbers might not add to total because of missing data. † Percentages might not add to 100 because of rounding. § Neither participant nor his partner used a condom. ¶ Percentages are of all participants in row category. ** Persons of Hispanic/Latino ethnicity might be of any race. †† Northeast: Boston, Massachusetts; Nassau-Suffolk, New York; New York City, New York; Newark, New Jersey; Philadelphia, Pennsylvania. South: Atlanta, Georgia; Baltimore, Maryland; Dallas, Texas; Houston, Texas; Miami, Florida; New Orleans, Louisiana; Washington, DC. Midwest: Chicago, Illinois; Detroit, Michigan; St. Louis, Missouri. West: Denver, Colorado; Los Angeles, California; San Diego, California; San Francisco, California; Seattle, Washington. Territories: San Juan, Puerto Rico. |
|||||||||
|
TABLE 3. (continued) Number* and percentage† of female participants who reported engaging in specified sexual behaviors with one or more male partners in the 12 months before the interview, by selected characteristics and metropolitan statistical area — National HIV Behavioral Surveillance System: heterosexuals at increased risk for HIV infection, 21 U.S. cities, 2010 |
|||||||||
|---|---|---|---|---|---|---|---|---|---|
|
Characteristic |
Female participants with male sex partners |
||||||||
|
Vaginal sex |
Vaginal sex without a condom§ |
Anal sex |
Anal sex without |
Total |
|||||
|
No. |
(%)¶ |
No. |
(%)¶ |
No. |
(%)¶ |
No. |
(%)¶ |
||
|
Boston, Massachusetts |
132 |
(99) |
117 |
(88) |
52 |
(39) |
44 |
(33) |
133 |
|
Chicago, Illinois |
178 |
(100) |
166 |
(93) |
80 |
(45) |
73 |
(41) |
178 |
|
Dallas, Texas |
269 |
(100) |
250 |
(93) |
87 |
(32) |
79 |
(29) |
269 |
|
Denver, Colorado |
309 |
(100) |
285 |
(92) |
65 |
(21) |
57 |
(18) |
309 |
|
Detroit, Michigan |
323 |
(100) |
276 |
(85) |
119 |
(37) |
86 |
(27) |
324 |
|
Houston, Texas |
274 |
(100) |
253 |
(92) |
76 |
(28) |
68 |
(25) |
274 |
|
Los Angeles, California |
251 |
(100) |
221 |
(88) |
84 |
(33) |
68 |
(27) |
251 |
|
Miami, Florida |
215 |
(100) |
191 |
(89) |
79 |
(37) |
69 |
(32) |
215 |
|
Nassau-Suffolk, New York |
39 |
(100) |
34 |
(87) |
6 |
(15) |
— |
— |
39 |
|
New Orleans, Louisiana |
282 |
(99) |
247 |
(86) |
57 |
(20) |
51 |
(18) |
286 |
|
New York City, New York |
191 |
(100) |
179 |
(94) |
102 |
(53) |
89 |
(47) |
191 |
|
Newark, New Jersey |
244 |
(99) |
212 |
(86) |
81 |
(33) |
66 |
(27) |
247 |
|
Philadelphia, Pennsylvania |
291 |
(99) |
254 |
(86) |
77 |
(26) |
62 |
(21) |
294 |
|
San Diego, California |
315 |
(100) |
285 |
(90) |
94 |
(30) |
83 |
(26) |
315 |
|
San Francisco, California |
246 |
(100) |
222 |
(90) |
82 |
(33) |
64 |
(26) |
246 |
|
San Juan, Puerto Rico |
306 |
(100) |
278 |
(91) |
195 |
(64) |
166 |
(54) |
307 |
|
Seattle, Washington |
233 |
(100) |
213 |
(91) |
67 |
(29) |
56 |
(24) |
233 |
|
St. Louis, Missouri |
298 |
(100) |
275 |
(92) |
77 |
(26) |
65 |
(22) |
298 |
|
Washington, DC |
239 |
(100) |
219 |
(91) |
81 |
(34) |
63 |
(26) |
240 |
|
Total |
4,941 |
(100) |
4,467 |
(90) |
1,687 |
(34) |
1,420 |
(29) |
4,955 |
|
Abbreviation: HIV = human immunodeficiency virus. * Numbers might not add to total because of missing data. † Percentages might not add to 100 because of rounding. § Neither participant nor her partner used a condom. ¶ Percentages are of all participants in row category. ** Suppressed because the number or numerator was five or fewer persons. †† Persons of Hispanic/Latino ethnicity might be of any race. §§ Northeast: Boston, Massachusetts; Nassau-Suffolk, New York; New York City, New York; Newark, New Jersey; Philadelphia, Pennsylvania. South: Atlanta, Georgia; Baltimore, Maryland; Dallas, Texas; Houston, Texas; Miami, Florida; New Orleans, Louisiana; Washington, DC. Midwest: Chicago, Illinois; Detroit, Michigan; St. Louis, Missouri. West: Denver, Colorado; Los Angeles, California; San Diego, California; San Francisco, California; Seattle, Washington. Territories: San Juan, Puerto Rico. |
|||||||||
|
TABLE 4. (continued) Number* and percentage† of male participants who reported engaging in specified sexual behaviors with one or more female partners in the 12 months before the interview, by partner type,§ selected characteristics, and metropolitan statistical area — National HIV Behavioral Surveillance System: heterosexuals at increased risk for HIV infection, 21 U.S. cities, 2010 |
|||||||||
|---|---|---|---|---|---|---|---|---|---|
|
Characteristic |
Female main partner |
Female casual partner |
Total |
||||||
|
Vaginal or anal sex |
Vaginal or anal sex without a condom¶ |
Vaginal or anal sex |
Vaginal or anal sex without a condom¶ |
||||||
|
No. |
(%)** |
No. |
(%)** |
No. |
(%)** |
No. |
(%)** |
||
|
Boston, Massachusetts |
61 |
(79) |
53 |
(69) |
56 |
(73) |
34 |
(44) |
77 |
|
Chicago, Illinois |
202 |
(73) |
178 |
(65) |
218 |
(79) |
178 |
(65) |
275 |
|
Dallas, Texas |
163 |
(82) |
151 |
(76) |
131 |
(66) |
101 |
(51) |
199 |
|
Denver, Colorado |
162 |
(77) |
152 |
(72) |
130 |
(62) |
107 |
(51) |
210 |
|
Detroit, Michigan |
176 |
(78) |
129 |
(57) |
172 |
(76) |
133 |
(59) |
227 |
|
Houston, Texas |
186 |
(77) |
168 |
(69) |
177 |
(73) |
141 |
(58) |
242 |
|
Los Angeles, California |
195 |
(72) |
186 |
(68) |
213 |
(78) |
176 |
(65) |
272 |
|
Miami, Florida |
167 |
(69) |
150 |
(62) |
156 |
(64) |
113 |
(47) |
242 |
|
Nassau-Suffolk, New York |
65 |
(71) |
59 |
(64) |
71 |
(77) |
52 |
(57) |
92 |
|
New Orleans, Louisiana |
135 |
(65) |
119 |
(57) |
144 |
(69) |
115 |
(55) |
209 |
|
New York City, New York |
191 |
(78) |
169 |
(69) |
189 |
(77) |
118 |
(48) |
244 |
|
Newark, New Jersey |
174 |
(65) |
147 |
(55) |
201 |
(76) |
149 |
(56) |
266 |
|
Philadelphia, Pennsylvania |
171 |
(81) |
141 |
(67) |
129 |
(61) |
96 |
(46) |
210 |
|
San Diego, California |
199 |
(80) |
179 |
(72) |
138 |
(55) |
104 |
(42) |
250 |
|
San Francisco, California |
137 |
(79) |
113 |
(65) |
125 |
(72) |
73 |
(42) |
174 |
|
San Juan, Puerto Rico |
114 |
(68) |
96 |
(57) |
154 |
(92) |
140 |
(83) |
168 |
|
Seattle, Washington |
177 |
(73) |
161 |
(67) |
178 |
(74) |
119 |
(49) |
241 |
|
St. Louis, Missouri |
224 |
(87) |
200 |
(78) |
154 |
(60) |
99 |
(38) |
258 |
|
Washington, DC |
151 |
(72) |
132 |
(63) |
140 |
(66) |
95 |
(45) |
211 |
|
Total |
3,252 |
(75) |
2,869 |
(66) |
3,063 |
(71) |
2,279 |
(53) |
4,323 |
|
Abbreviation: HIV = human immunodeficiency virus. * Numbers might not add to total because of missing data. † Percentages might not add to 100 because of rounding. § A main partner was someone to whom the participant felt most committed (e.g., girlfriend, wife, significant other, or life partner). A casual partner was someone to whom the participant did not feel committed, whom the participant did not know very well, or with whom the participant had sex in exchange for something such as money or drugs. ¶ Neither the participant nor his partner used a condom. ** Percentages are of all participants in row category. †† Persons of Hispanic/Latino ethnicity might be of any race. §§ Northeast: Boston, Massachusetts; Nassau-Suffolk, New York; New York City, New York; Newark, New Jersey; Philadelphia, Pennsylvania. South: Atlanta, Georgia; Baltimore, Maryland; Dallas, Texas; Houston, Texas; Miami, Florida; New Orleans, Louisiana; Washington, DC. Midwest: Chicago, Illinois; Detroit, Michigan; St. Louis, Missouri. West: Denver, Colorado; Los Angeles, California; San Diego, California; San Francisco, California; Seattle, Washington. Territories: San Juan, Puerto Rico. |
|||||||||
|
TABLE 5. (continued) Number* and percentage† of female participants who reported engaging in specified sexual behaviors with one or more male partners in the 12 months before the interview, by partner type,§ selected characteristics, and metropolitan statistical area — National HIV Behavioral Surveillance System: heterosexuals at increased risk for HIV infection, 21 U.S. cities, 2010 |
|||||||||
|---|---|---|---|---|---|---|---|---|---|
|
Characteristic |
Male main partner |
Male casual partner |
Total |
||||||
|
Vaginal or anal sex |
Vaginal or anal sex without a condom¶ |
Vaginal or anal sex |
Vaginal or anal sex without a condom¶ |
||||||
|
No. |
(%)** |
No. |
(%)** |
No. |
(%)** |
No. |
(%)** |
||
|
Chicago, Illinois |
141 |
(79) |
129 |
(72) |
129 |
(72) |
101 |
(57) |
178 |
|
Dallas, Texas |
247 |
(92) |
227 |
(84) |
137 |
(51) |
95 |
(35) |
269 |
|
Denver, Colorado |
262 |
(85) |
248 |
(80) |
155 |
(50) |
120 |
(39) |
309 |
|
Detroit, Michigan |
242 |
(75) |
189 |
(58) |
231 |
(71) |
193 |
(60) |
324 |
|
Houston, Texas |
226 |
(82) |
209 |
(76) |
177 |
(65) |
138 |
(50) |
274 |
|
Los Angeles, California |
212 |
(84) |
184 |
(73) |
149 |
(59) |
121 |
(48) |
251 |
|
Miami, Florida |
176 |
(82) |
159 |
(74) |
119 |
(55) |
79 |
(37) |
215 |
|
Nassau-Suffolk, New York |
37 |
(95) |
32 |
(82) |
14 |
(36) |
10 |
(26) |
39 |
|
New Orleans, Louisiana |
251 |
(88) |
221 |
(77) |
92 |
(32) |
72 |
(25) |
286 |
|
New York City, New York |
159 |
(83) |
148 |
(77) |
139 |
(73) |
100 |
(52) |
191 |
|
Newark, New Jersey |
202 |
(82) |
168 |
(68) |
161 |
(65) |
125 |
(51) |
247 |
|
Philadelphia, Pennsylvania |
253 |
(86) |
223 |
(76) |
131 |
(45) |
92 |
(31) |
294 |
|
San Diego, California |
288 |
(91) |
261 |
(83) |
109 |
(35) |
83 |
(26) |
315 |
|
San Francisco, California |
205 |
(83) |
189 |
(77) |
154 |
(63) |
111 |
(45) |
246 |
|
San Juan, Puerto Rico |
235 |
(77) |
184 |
(60) |
232 |
(76) |
208 |
(68) |
307 |
|
Seattle, Washington |
194 |
(83) |
179 |
(77) |
142 |
(61) |
93 |
(40) |
233 |
|
St. Louis, Missouri |
258 |
(87) |
240 |
(81) |
156 |
(52) |
114 |
(38) |
298 |
|
Washington, DC |
209 |
(87) |
191 |
(80) |
123 |
(51) |
91 |
(38) |
240 |
|
Total |
4,154 |
(84) |
3,710 |
(75) |
2,837 |
(57) |
2,161 |
(44) |
4,955 |
|
Abbreviation: HIV = human immunodeficiency virus. * Numbers might not add to total because of missing data. † Percentages might not add to 100 because of rounding. § A main partner was someone to whom the participant felt most committed (e.g., boyfriend, husband, significant other, or life partner). A casual partner was someone to whom the participant did not feel committed, whom the participant did not know very well, or with whom the participant had sex in exchange for something such as money or drugs. ¶ Neither the participant nor her partner used a condom. ** Percentages are of all participants in row category. †† Persons of Hispanic/Latino ethnicity might be of any race. §§ Northeast: Boston, Massachusetts; Nassau-Suffolk, New York; New York City, New York; Newark, New Jersey; Philadelphia, Pennsylvania. South: Atlanta, Georgia; Baltimore, Maryland; Dallas, Texas; Houston, Texas; Miami, Florida; New Orleans, Louisiana; Washington, DC. Midwest: Chicago, Illinois; Detroit, Michigan; St. Louis, Missouri. West: Denver, Colorado; Los Angeles, California; San Diego, California; San Francisco, California; Seattle, Washington. Territories: San Juan, Puerto Rico. |
|||||||||
|
TABLE 6. (continued) Number* and percentage† of participants who reported current, heavy, and binge drinking, by sex, selected characteristics, and metropolitan statistical area — National HIV Behavioral Surveillance System: heterosexuals at increased risk for HIV infection, 21 U.S. cities, 2010 |
||||||||||||||||||
|---|---|---|---|---|---|---|---|---|---|---|---|---|---|---|---|---|---|---|
|
Characteristic |
Current§ |
Heavy¶ |
Binge** |
Total |
Total |
|||||||||||||
|
Male |
Female |
Total |
Male |
Female |
Total |
Male |
Female |
Total |
Male |
Female |
||||||||
|
No. |
(%)†† |
No. |
(%)†† |
No. |
No. |
(%)†† |
No. |
(%)†† |
No. |
No. |
(%)†† |
No. |
(%)†† |
No. |
No. |
No. |
||
|
Dallas, Texas |
151 |
(76) |
156 |
(58) |
307 |
45 |
(23) |
60 |
(22) |
105 |
85 |
(43) |
94 |
(35) |
179 |
199 |
269 |
468 |
|
Denver, Colorado |
182 |
(87) |
217 |
(70) |
399 |
62 |
(30) |
90 |
(29) |
152 |
124 |
(59) |
159 |
(51) |
283 |
210 |
309 |
519 |
|
Detroit, Michigan |
177 |
(78) |
224 |
(69) |
401 |
68 |
(30) |
99 |
(31) |
167 |
112 |
(49) |
146 |
(45) |
258 |
227 |
324 |
551 |
|
Houston, Texas |
189 |
(78) |
193 |
(70) |
382 |
56 |
(23) |
64 |
(23) |
120 |
111 |
(46) |
100 |
(36) |
211 |
242 |
274 |
516 |
|
Los Angeles, California |
170 |
(63) |
181 |
(72) |
351 |
54 |
(20) |
60 |
(24) |
114 |
119 |
(44) |
105 |
(42) |
224 |
272 |
251 |
523 |
|
Miami, Florida |
171 |
(71) |
135 |
(63) |
306 |
56 |
(23) |
59 |
(27) |
115 |
92 |
(38) |
68 |
(32) |
160 |
242 |
215 |
457 |
|
Nassau-Suffolk, New York |
72 |
(78) |
22 |
(56) |
94 |
27 |
(29) |
11 |
(28) |
38 |
60 |
(65) |
19 |
(49) |
79 |
92 |
39 |
131 |
|
New Orleans, Louisiana |
143 |
(68) |
171 |
(60) |
314 |
57 |
(27) |
41 |
(14) |
98 |
100 |
(48) |
83 |
(29) |
183 |
209 |
286 |
495 |
|
New York City, New York |
197 |
(81) |
136 |
(71) |
333 |
41 |
(17) |
50 |
(26) |
91 |
109 |
(45) |
86 |
(45) |
195 |
244 |
191 |
435 |
|
Newark, New Jersey |
186 |
(70) |
134 |
(54) |
320 |
75 |
(28) |
63 |
(26) |
138 |
125 |
(47) |
96 |
(39) |
221 |
266 |
247 |
513 |
|
Philadelphia, Pennsylvania |
142 |
(68) |
171 |
(58) |
313 |
50 |
(24) |
55 |
(19) |
105 |
96 |
(46) |
95 |
(32) |
191 |
210 |
294 |
504 |
|
San Diego, California |
168 |
(67) |
168 |
(53) |
336 |
37 |
(15) |
43 |
(14) |
80 |
103 |
(41) |
98 |
(31) |
201 |
250 |
315 |
565 |
|
San Francisco, California |
129 |
(74) |
183 |
(74) |
312 |
36 |
(21) |
76 |
(31) |
112 |
83 |
(48) |
120 |
(49) |
203 |
174 |
246 |
420 |
|
San Juan, Puerto Rico |
123 |
(73) |
186 |
(61) |
309 |
62 |
(37) |
101 |
(33) |
163 |
94 |
(56) |
135 |
(44) |
229 |
168 |
307 |
475 |
|
Seattle, Washington |
182 |
(76) |
167 |
(72) |
349 |
42 |
(17) |
53 |
(23) |
95 |
115 |
(48) |
97 |
(42) |
212 |
241 |
233 |
474 |
|
St. Louis, Missouri |
218 |
(84) |
207 |
(69) |
425 |
66 |
(26) |
63 |
(21) |
129 |
107 |
(41) |
103 |
(35) |
210 |
258 |
298 |
556 |
|
Washington, DC |
173 |
(82) |
174 |
(73) |
347 |
73 |
(35) |
61 |
(25) |
134 |
115 |
(55) |
109 |
(45) |
224 |
211 |
240 |
451 |
|
Total |
3,273 |
(76) |
3,269 |
(66) |
6,542 |
1,068 |
(25) |
1,249 |
(25) |
2,317 |
2,054 |
(48) |
2,002 |
(40) |
4,056 |
4,323 |
4,955 |
9,278 |
|
Abbreviation: HIV = human immunodeficiency virus. * Numbers might not add to total because of missing data. † Percentages might not add to 100 because of rounding. § Participants who drank at least one alcoholic beverage in the 30 days before the interview. Alcoholic beverage was defined as a 12-oz beer, 5-oz glass of wine, or 1.5 shot of liquor. ¶ Participants who drank on average more than two (men) or more than one (women) alcoholic beverages per day in the 30 days before the interview. ** Participants who drank more than five (men) or four (women) alcoholic beverages at one sitting in the 30 days before the interview. †† Within each sex, percentages are of all participants in row category. §§ Suppressed because the number or numerator was five or fewer persons. ¶¶ Persons of Hispanic/Latino ethnicity might be of any race. *** Northeast: Boston, Massachusetts; Nassau-Suffolk, New York; New York City, New York; Newark, New Jersey; Philadelphia, Pennsylvania. South: Atlanta, Georgia; Baltimore, Maryland; Dallas, Texas; Houston, Texas; Miami, Florida; New Orleans, Louisiana; Washington, DC. Midwest: Chicago, Illinois; Detroit, Michigan; St. Louis, Missouri. West: Denver, Colorado; Los Angeles, California; San Diego, California; San Francisco, California; Seattle, Washington. Territories: San Juan, Puerto Rico. |
||||||||||||||||||
|
TABLE 7. (continued) Number* and percentage† of participants reporting noninjection drug use in the 12 months before the interview, by type of drug,§ selected characteristics, and metropolitan statistical area — National HIV Behavioral Surveillance System: heterosexuals at increased risk for HIV infection, 21 U.S. cities, 2010 |
|||||||||||||||
|---|---|---|---|---|---|---|---|---|---|---|---|---|---|---|---|
|
Characteristic |
Any drug |
Marijuana |
Crack cocaine |
Powdered cocaine |
Painkillers |
Ecstasy |
Other¶ |
Total |
|||||||
|
No. |
(%)** |
No. |
(%)** |
No. |
(%)** |
No. |
(%)** |
No. |
(%)** |
No. |
(%)** |
No. |
(%)** |
||
|
West |
1,509 |
(60) |
1,344 |
(54) |
398 |
(16) |
356 |
(14) |
312 |
(12) |
311 |
(12) |
380 |
(15) |
2,501 |
|
Territories |
148 |
(31) |
116 |
(24) |
23 |
(5) |
47 |
(10) |
44 |
(9) |
— |
— |
37 |
(8) |
475 |
|
Metropolitan statistical area |
|||||||||||||||
|
Atlanta, Georgia |
166 |
(66) |
157 |
(63) |
28 |
(11) |
26 |
(10) |
24 |
(10) |
33 |
(13) |
23 |
(9) |
251 |
|
Baltimore, Maryland |
210 |
(68) |
183 |
(59) |
34 |
(11) |
21 |
(7) |
77 |
(25) |
61 |
(20) |
69 |
(22) |
311 |
|
Boston, Massachusetts |
143 |
(68) |
132 |
(63) |
20 |
(10) |
33 |
(16) |
32 |
(15) |
25 |
(12) |
23 |
(11) |
210 |
|
Chicago, Illinois |
330 |
(73) |
267 |
(59) |
113 |
(25) |
52 |
(11) |
51 |
(11) |
60 |
(13) |
130 |
(29) |
453 |
|
Dallas, Texas |
258 |
(55) |
230 |
(49) |
61 |
(13) |
55 |
(12) |
43 |
(9) |
51 |
(11) |
82 |
(18) |
468 |
|
Denver, Colorado |
325 |
(63) |
289 |
(56) |
115 |
(22) |
82 |
(16) |
74 |
(14) |
38 |
(7) |
61 |
(12) |
519 |
|
Detroit, Michigan |
354 |
(64) |
323 |
(59) |
71 |
(13) |
43 |
(8) |
74 |
(13) |
50 |
(9) |
58 |
(11) |
551 |
|
Houston, Texas |
338 |
(66) |
304 |
(59) |
76 |
(15) |
58 |
(11) |
80 |
(16) |
85 |
(16) |
121 |
(23) |
516 |
|
Los Angeles, California |
330 |
(63) |
295 |
(56) |
89 |
(17) |
73 |
(14) |
71 |
(14) |
81 |
(15) |
102 |
(20) |
523 |
|
Miami, Florida |
260 |
(57) |
220 |
(48) |
67 |
(15) |
119 |
(26) |
16 |
(4) |
34 |
(7) |
41 |
(9) |
457 |
|
Nassau-Suffolk, New York |
64 |
(49) |
58 |
(44) |
— |
— |
19 |
(15) |
— |
— |
10 |
(8) |
8 |
(6) |
131 |
|
New Orleans, Louisiana |
174 |
(35) |
141 |
(28) |
72 |
(15) |
40 |
(8) |
58 |
(12) |
19 |
(4) |
52 |
(11) |
495 |
|
New York City, New York |
328 |
(75) |
270 |
(62) |
80 |
(18) |
81 |
(19) |
27 |
(6) |
46 |
(11) |
88 |
(20) |
435 |
|
Newark, New Jersey |
310 |
(60) |
202 |
(39) |
119 |
(23) |
84 |
(16) |
58 |
(11) |
49 |
(10) |
134 |
(26) |
513 |
|
Philadelphia, Pennsylvania |
200 |
(40) |
163 |
(32) |
49 |
(10) |
34 |
(7) |
15 |
(3) |
— |
— |
30 |
(6) |
504 |
|
San Diego, California |
191 |
(34) |
161 |
(28) |
19 |
(3) |
50 |
(9) |
33 |
(6) |
28 |
(5) |
47 |
(8) |
565 |
|
San Francisco, California |
322 |
(77) |
299 |
(71) |
51 |
(12) |
63 |
(15) |
61 |
(15) |
100 |
(24) |
84 |
(20) |
420 |
|
San Juan, Puerto Rico |
148 |
(31) |
116 |
(24) |
23 |
(5) |
47 |
(10) |
44 |
(9) |
— |
— |
37 |
(8) |
475 |
|
Seattle, Washington |
341 |
(72) |
300 |
(63) |
124 |
(26) |
88 |
(19) |
73 |
(15) |
64 |
(14) |
86 |
(18) |
474 |
|
St. Louis, Missouri |
363 |
(65) |
344 |
(62) |
79 |
(14) |
47 |
(8) |
74 |
(13) |
60 |
(11) |
68 |
(12) |
556 |
|
Washington, DC |
285 |
(63) |
248 |
(55) |
203 |
(45) |
35 |
(8) |
51 |
(11) |
81 |
(18) |
68 |
(15) |
451 |
|
Total |
5,440 |
(59) |
4,702 |
(51) |
1,362 |
(15) |
1,150 |
(12) |
1,037 |
(11) |
982 |
(11) |
1,412 |
(15) |
9,278 |
|
Abbreviation: HIV = human immunodeficiency virus. * Numbers might not add to total because of missing data. † Percentages might not add to 100 because of rounding. § Types of drugs used are not mutually exclusive. ¶ Includes downers (7.5%), heroin (6.3%), crystal methamphetamine (2.8%), hallucinogens (1.3%), poppers (0.5%), ketamine (0.2%), gamma hydroxybutyrate ([GHB], 0.1%), and other drugs (1.2%). ** Percentages are of all participants in row category. †† Suppressed because the number or numerator was five or fewer persons. §§ Persons of Hispanic/Latino ethnicity might be of any race. ¶¶ Northeast: Boston, Massachusetts; Nassau-Suffolk, New York; New York City, New York; Newark, New Jersey; Philadelphia, Pennsylvania. South: Atlanta, Georgia; Baltimore, Maryland; Dallas, Texas; Houston, Texas; Miami, Florida; New Orleans, Louisiana; Washington, DC. Midwest: Chicago, Illinois; Detroit, Michigan; St. Louis, Missouri. West: Denver, Colorado; Los Angeles, California; San Diego, California; San Francisco, California; Seattle, Washington. Territories: San Juan, Puerto Rico. |
|||||||||||||||
|
TABLE 8. (continued) Number* and percentage† of participants diagnosed with a sexually transmitted disease§ in the 12 months before the interview, by sex, selected characteristics and metropolitan statistical area — National HIV Behavioral Surveillance System: heterosexuals at increased risk for HIV infection, 21 U.S. cities, 2010 |
||||||||||||||||||
|---|---|---|---|---|---|---|---|---|---|---|---|---|---|---|---|---|---|---|
|
Characteristic |
Any STD¶ |
Chlamydia |
Gonorrhea |
Other STD** |
Total |
|||||||||||||
|
Male |
Female |
Male |
Female |
Male |
Female |
Male |
Female |
Male |
Female |
|||||||||
|
No. |
(%)†† |
No. |
(%)†† |
No. |
(%)†† |
No. |
(%)†† |
No. |
(%)†† |
No. |
(%)†† |
No. |
(%)†† |
No. |
(%)†† |
No. |
No. |
|
|
Metropolitan statistical area |
||||||||||||||||||
|
Atlanta, Georgia |
9 |
(8) |
28 |
(20) |
— |
— |
12 |
(9) |
— |
— |
8 |
(6) |
— |
— |
13 |
(9) |
112 |
139 |
|
Baltimore, Maryland |
15 |
(10) |
35 |
(21) |
— |
— |
18 |
(11) |
9 |
(6) |
8 |
(5) |
— |
— |
17 |
(10) |
144 |
167 |
|
Boston, Massachusetts |
— |
— |
28 |
(21) |
— |
— |
19 |
(14) |
— |
— |
7 |
(5) |
— |
— |
12 |
(9) |
77 |
133 |
|
Chicago, Illinois |
20 |
(7) |
37 |
(21) |
10 |
(4) |
23 |
(13) |
7 |
(3) |
15 |
(8) |
— |
— |
13 |
(7) |
275 |
178 |
|
Dallas, Texas |
15 |
(8) |
34 |
(13) |
11 |
(6) |
17 |
(6) |
— |
— |
8 |
(3) |
— |
— |
16 |
(6) |
199 |
269 |
|
Denver, Colorado |
11 |
(5) |
33 |
(11) |
— |
— |
16 |
(5) |
— |
— |
7 |
(2) |
— |
— |
18 |
(6) |
210 |
309 |
|
Detroit, Michigan |
19 |
(8) |
80 |
(25) |
9 |
(4) |
39 |
(12) |
9 |
(4) |
25 |
(8) |
8 |
(4) |
49 |
(15) |
227 |
324 |
|
Houston, Texas |
18 |
(7) |
41 |
(15) |
10 |
(4) |
19 |
(7) |
7 |
(3) |
9 |
(3) |
6 |
(2) |
23 |
(8) |
242 |
274 |
|
Los Angeles, California |
14 |
(5) |
30 |
(12) |
— |
— |
14 |
(6) |
— |
— |
— |
— |
10 |
(4) |
18 |
(7) |
272 |
251 |
|
Miami, Florida |
12 |
(5) |
24 |
(11) |
— |
— |
13 |
(6) |
7 |
(3) |
— |
— |
— |
— |
9 |
(4) |
242 |
215 |
|
Nassau-Suffolk, New York |
— |
— |
— |
— |
— |
— |
— |
— |
— |
— |
— |
— |
— |
— |
— |
— |
92 |
39 |
|
New Orleans, Louisiana |
— |
— |
24 |
(8) |
— |
— |
10 |
(3) |
— |
— |
7 |
(2) |
— |
— |
11 |
(4) |
209 |
286 |
|
New York City, New York |
13 |
(5) |
26 |
(14) |
— |
— |
20 |
(10) |
— |
— |
— |
— |
8 |
(3) |
9 |
(5) |
244 |
191 |
|
Newark, New Jersey |
22 |
(8) |
27 |
(11) |
6 |
(2) |
12 |
(5) |
— |
— |
6 |
(2) |
13 |
(5) |
14 |
(6) |
266 |
247 |
|
Philadelphia, Pennsylvania |
8 |
(4) |
18 |
(6) |
6 |
(3) |
10 |
(3) |
— |
— |
— |
— |
— |
— |
9 |
(3) |
210 |
294 |
|
San Diego, California |
6 |
(2) |
21 |
(7) |
— |
— |
16 |
(5) |
— |
— |
— |
— |
— |
— |
— |
— |
250 |
315 |
|
San Francisco, California |
10 |
(6) |
53 |
(22) |
— |
— |
35 |
(14) |
— |
— |
8 |
(3) |
— |
— |
19 |
(8) |
174 |
246 |
|
San Juan, Puerto Rico |
7 |
(4) |
14 |
(5) |
— |
— |
8 |
(3) |
— |
— |
— |
— |
— |
— |
— |
— |
168 |
307 |
|
Seattle, Washington |
11 |
(5) |
39 |
(17) |
— |
— |
13 |
(6) |
— |
— |
— |
— |
— |
— |
30 |
(13) |
241 |
233 |
|
St. Louis, Missouri |
18 |
(7) |
57 |
(19) |
11 |
(4) |
34 |
(11) |
— |
— |
16 |
(5) |
8 |
(3) |
30 |
(10) |
258 |
298 |
|
Washington, DC |
18 |
(9) |
29 |
(12) |
10 |
(5) |
16 |
(7) |
11 |
(5) |
8 |
(3) |
— |
— |
14 |
(6) |
211 |
240 |
|
Total |
256 |
(6) |
680 |
(14) |
112 |
(3) |
364 |
(7) |
90 |
(2) |
151 |
(3) |
102 |
(2) |
336 |
(7) |
4,323 |
4,955 |
|
Abbreviations: HIV = human immunodeficiency virus; STD = sexually transmitted disease. * Numbers might not add to total because of missing data. † Percentages might not add to 100 because of rounding. § Self-report of diagnosis by a health-care provider. ¶ Diagnosis of one or more of the following: chlamydia, gonorrhea, syphilis, genital herpes, genital warts, or other STD. ** Includes syphilis, genital herpes, genital warts, or other STD. †† Within each sex, percentages are of all participants in row category. §§ Suppressed because the number or numerator was five or fewer persons. ¶¶ Persons of Hispanic/Latino ethnicity might be of any race. *** Coverage through private insurance policies or employer, TRICARE, CHAMPUS, or membership in a health maintenance organization. ††† Coverage through Medicare, Medicaid, plans funded by state or local governments, or Veterans Administration. ¶¶¶ Visited a physician, nurse, or other health-care provider in the 12 months before the interview. **** Northeast: Boston, Massachusetts; Nassau-Suffolk, New York; New York City, New York; Newark, New Jersey; Philadelphia, Pennsylvania. South: Atlanta, Georgia; Baltimore, Maryland; Dallas, Texas; Houston, Texas; Miami, Florida; New Orleans, Louisiana; Washington, DC. Midwest: Chicago, Illinois; Detroit, Michigan; St. Louis, Missouri. West: Denver, Colorado; Los Angeles, California; San Diego, California; San Francisco, California; Seattle, Washington. Territories: San Juan, Puerto Rico. |
||||||||||||||||||
|
TABLE 9. (continued) Number* and percentage† of participants who reported HIV testing in their lifetime and in the 12 months before the interview, by sex, selected characteristics, and metropolitan statistical area — National HIV Behavioral Surveillance System: heterosexuals at increased risk for HIV infection, 21 U.S. cities, 2010 |
|||||||||||
|---|---|---|---|---|---|---|---|---|---|---|---|
|
Characteristic |
Male |
Female |
Total |
||||||||
|
Ever tested |
Tested in past 12 months |
Total |
Ever tested |
Tested in past 12 months |
Total |
||||||
|
No. |
(%)§ |
No. |
(%)§ |
No. |
No. |
(%)§ |
No. |
(%)§ |
No. |
||
|
STD diagnosis*** |
|||||||||||
|
Yes |
203 |
(79) |
113 |
(44) |
256 |
547 |
(80) |
288 |
(42) |
680 |
936 |
|
No |
2,850 |
(70) |
1,198 |
(29) |
4,063 |
3,291 |
(77) |
1,438 |
(34) |
4,272 |
8,335 |
|
Region††† |
|||||||||||
|
Northeast |
684 |
(77) |
356 |
(40) |
889 |
764 |
(85) |
398 |
(44) |
904 |
1,793 |
|
South |
1,049 |
(77) |
497 |
(37) |
1,359 |
1,330 |
(84) |
673 |
(42) |
1,590 |
2,949 |
|
Midwest |
544 |
(72) |
201 |
(26) |
760 |
609 |
(76) |
271 |
(34) |
800 |
1,560 |
|
West |
693 |
(60) |
243 |
(21) |
1,147 |
937 |
(69) |
363 |
(27) |
1,354 |
2,501 |
|
Territories |
87 |
(52) |
15 |
(9) |
168 |
200 |
(65) |
22 |
(7) |
307 |
475 |
|
Metropolitan statistical area |
|||||||||||
|
Atlanta, Georgia |
80 |
(71) |
32 |
(29) |
112 |
113 |
(81) |
51 |
(37) |
139 |
251 |
|
Baltimore, Maryland |
123 |
(85) |
61 |
(42) |
144 |
153 |
(92) |
79 |
(47) |
167 |
311 |
|
Boston, Massachusetts |
57 |
(74) |
26 |
(34) |
77 |
124 |
(93) |
56 |
(42) |
133 |
210 |
|
Chicago, Illinois |
208 |
(76) |
88 |
(32) |
275 |
148 |
(83) |
69 |
(39) |
178 |
453 |
|
Dallas, Texas |
124 |
(62) |
38 |
(19) |
199 |
194 |
(72) |
72 |
(27) |
269 |
468 |
|
Denver, Colorado |
138 |
(66) |
43 |
(20) |
210 |
231 |
(75) |
93 |
(30) |
309 |
519 |
|
Detroit, Michigan |
147 |
(65) |
36 |
(16) |
227 |
229 |
(71) |
99 |
(31) |
324 |
551 |
|
Houston, Texas |
186 |
(77) |
78 |
(32) |
242 |
233 |
(85) |
105 |
(38) |
274 |
516 |
|
Los Angeles, California |
166 |
(61) |
61 |
(22) |
272 |
162 |
(65) |
59 |
(24) |
251 |
523 |
|
Miami, Florida |
186 |
(77) |
86 |
(36) |
242 |
193 |
(90) |
109 |
(51) |
215 |
457 |
|
Nassau-Suffolk, New York |
47 |
(51) |
14 |
(15) |
92 |
26 |
(67) |
16 |
(41) |
39 |
131 |
|
New Orleans, Louisiana |
155 |
(74) |
81 |
(39) |
209 |
225 |
(79) |
104 |
(36) |
286 |
495 |
|
New York City, New York |
200 |
(82) |
108 |
(44) |
244 |
170 |
(89) |
98 |
(51) |
191 |
435 |
|
Newark, New Jersey |
226 |
(85) |
141 |
(53) |
266 |
213 |
(86) |
119 |
(48) |
247 |
513 |
|
Philadelphia, Pennsylvania |
154 |
(73) |
67 |
(32) |
210 |
231 |
(79) |
109 |
(37) |
294 |
504 |
|
San Diego, California |
93 |
(37) |
30 |
(12) |
250 |
164 |
(52) |
58 |
(18) |
315 |
565 |
|
San Francisco, California |
112 |
(64) |
42 |
(24) |
174 |
191 |
(78) |
79 |
(32) |
246 |
420 |
|
San Juan, Puerto Rico |
87 |
(52) |
15 |
(9) |
168 |
200 |
(65) |
22 |
(7) |
307 |
475 |
|
Seattle, Washington |
184 |
(76) |
67 |
(28) |
241 |
189 |
(81) |
74 |
(32) |
233 |
474 |
|
St. Louis, Missouri |
189 |
(73) |
77 |
(30) |
258 |
232 |
(78) |
103 |
(35) |
298 |
556 |
|
Washington, DC |
195 |
(92) |
121 |
(57) |
211 |
219 |
(91) |
153 |
(64) |
240 |
451 |
|
Total |
3,057 |
(71) |
1,312 |
(30) |
4,323 |
3,840 |
(77) |
1,727 |
(35) |
4,955 |
9,278 |
|
TABLE 9. (continued) Number* and percentage† of participants who reported HIV testing in their lifetime and in the 12 months before the interview, by sex, selected characteristics, and metropolitan statistical area — National HIV Behavioral Surveillance System: heterosexuals at increased risk for HIV infection, 21 U.S. cities, 2010 |
|||||||||||
|---|---|---|---|---|---|---|---|---|---|---|---|
|
Abbreviations: HIV = human immunodeficiency virus; STD = sexually transmitted disease. * Numbers might not add to total because of missing data. † Percentages might not add to 100 because of rounding. § Within each sex, percentages are of all participants in row category. ¶ Suppressed because the number or numerator was five or fewer persons. ** Persons of Hispanic/Latino ethnicity might be of any race. †† Coverage through private insurance policies or employer, TRICARE, CHAMPUS, or membership in a health maintenance organization. §§ Coverage through Medicare, Medicaid, plans funded by state or local governments, or Veterans Administration. ¶¶ Visited a physician, nurse, or other health-care provider in the 12 months before the interview. *** Self-report of diagnosis by a health-care provider with any STD in the 12 months before the interview. ††† Northeast: Boston, Massachusetts; Nassau-Suffolk, New York; New York City, New York; Newark, New Jersey; Philadelphia, Pennsylvania. South: Atlanta, Georgia; Baltimore, Maryland; Dallas, Texas; Houston, Texas; Miami, Florida; New Orleans, Louisiana; Washington, DC. Midwest: Chicago, Illinois; Detroit, Michigan; St. Louis, Missouri. West: Denver, Colorado; Los Angeles, California; San Diego, California; San Francisco, California; Seattle, Washington. Territories: San Juan, Puerto Rico. |
|
TABLE 13. (continued) Number* and percentage† of participants reporting receipt of HIV prevention materials or services in the 12 months before the interview, by selected characteristics and metropolitan statistical area — National HIV Behavioral Surveillance System: heterosexuals at increased risk for HIV infection, 21 U.S. cities, 2010 |
|||||||||||
|---|---|---|---|---|---|---|---|---|---|---|---|
|
Characteristic |
Free condoms |
Behavioral interventions |
Total |
||||||||
|
Received |
Used |
Individual§ |
Group¶ |
Either |
|||||||
|
No. |
(%)** |
No. |
(%)†† |
No. |
(%)** |
No. |
(%)** |
No. |
(%)** |
||
|
STD diagnosis¶¶¶ |
|||||||||||
|
Yes |
389 |
(42) |
267 |
(69) |
112 |
(12) |
60 |
(6) |
147 |
(16) |
936 |
|
No |
2,746 |
(33) |
1,806 |
(66) |
581 |
(7) |
426 |
(5) |
848 |
(10) |
8,335 |
|
Region**** |
|||||||||||
|
Northeast |
618 |
(34) |
417 |
(67) |
165 |
(9) |
74 |
(4) |
209 |
(12) |
1,793 |
|
South |
1,080 |
(37) |
703 |
(65) |
206 |
(7) |
139 |
(5) |
288 |
(10) |
2,949 |
|
Midwest |
419 |
(27) |
274 |
(65) |
120 |
(8) |
98 |
(6) |
176 |
(11) |
1,560 |
|
West |
937 |
(37) |
636 |
(68) |
175 |
(7) |
144 |
(6) |
268 |
(11) |
2,501 |
|
Territories |
83 |
(17) |
45 |
(54) |
27 |
(6) |
31 |
(7) |
54 |
(11) |
475 |
|
Metropolitan statistical area |
|||||||||||
|
Atlanta, Georgia |
68 |
(27) |
48 |
(71) |
23 |
(9) |
16 |
(6) |
33 |
(13) |
251 |
|
Baltimore, Maryland |
138 |
(44) |
93 |
(67) |
32 |
(10) |
27 |
(9) |
49 |
(16) |
311 |
|
Boston, Massachusetts |
101 |
(48) |
73 |
(72) |
26 |
(12) |
18 |
(9) |
39 |
(19) |
210 |
|
Chicago, Illinois |
189 |
(42) |
125 |
(66) |
39 |
(9) |
38 |
(8) |
64 |
(14) |
453 |
|
Dallas, Texas |
62 |
(13) |
33 |
(53) |
27 |
(6) |
16 |
(3) |
34 |
(7) |
468 |
|
Denver, Colorado |
159 |
(31) |
100 |
(63) |
28 |
(5) |
30 |
(6) |
47 |
(9) |
519 |
|
Detroit, Michigan |
93 |
(17) |
60 |
(65) |
39 |
(7) |
32 |
(6) |
57 |
(10) |
551 |
|
Houston, Texas |
195 |
(38) |
137 |
(70) |
43 |
(8) |
19 |
(4) |
54 |
(10) |
516 |
|
Los Angeles, California |
142 |
(27) |
90 |
(63) |
33 |
(6) |
25 |
(5) |
48 |
(9) |
523 |
|
Miami, Florida |
133 |
(29) |
81 |
(61) |
6 |
(1) |
7 |
(2) |
11 |
(2) |
457 |
|
Nassau-Suffolk, New York |
34 |
(26) |
28 |
(82) |
—§§ |
— |
— |
— |
9 |
(7) |
131 |
|
New Orleans, Louisiana |
176 |
(36) |
118 |
(67) |
25 |
(5) |
15 |
(3) |
37 |
(7) |
495 |
|
New York City, New York |
256 |
(59) |
175 |
(68) |
35 |
(8) |
18 |
(4) |
43 |
(10) |
435 |
|
Newark, New Jersey |
142 |
(28) |
88 |
(62) |
79 |
(15) |
23 |
(4) |
91 |
(18) |
513 |
|
Philadelphia, Pennsylvania |
85 |
(17) |
53 |
(62) |
20 |
(4) |
11 |
(2) |
27 |
(5) |
504 |
|
San Diego, California |
147 |
(26) |
93 |
(63) |
16 |
(3) |
9 |
(2) |
24 |
(4) |
565 |
|
San Francisco, California |
238 |
(57) |
158 |
(66) |
51 |
(12) |
43 |
(10) |
81 |
(19) |
420 |
|
San Juan, Puerto Rico |
83 |
(17) |
45 |
(54) |
27 |
(6) |
31 |
(7) |
54 |
(11) |
475 |
|
Seattle, Washington |
251 |
(53) |
195 |
(78) |
47 |
(10) |
37 |
(8) |
68 |
(14) |
474 |
|
St. Louis, Missouri |
137 |
(25) |
89 |
(65) |
42 |
(8) |
28 |
(5) |
55 |
(10) |
556 |
|
Washington, DC |
308 |
(68) |
193 |
(63) |
50 |
(11) |
39 |
(9) |
70 |
(16) |
451 |
|
Total |
3,137 |
(34) |
2,075 |
(66) |
693 |
(7) |
486 |
(5) |
995 |
(11) |
9,278 |
|
TABLE 13. (continued) Number* and percentage† of participants reporting receipt of HIV prevention materials or services in the 12 months before the interview, by selected characteristics and metropolitan statistical area — National HIV Behavioral Surveillance System: heterosexuals at increased risk for HIV infection, 21 U.S. cities, 2010 |
|||||||||||
|---|---|---|---|---|---|---|---|---|---|---|---|
|
Abbreviations: HIV = human immunodeficiency virus; STD = sexually transmitted disease. * Numbers might not add to total because of missing data. † Percentages might not add to 100 because of rounding. § One-on-one conversation with an outreach worker, a counselor, or a prevention program worker about ways to prevent HIV excluding conversations that were part of HIV testing. ¶ Small-group discussion of ways to prevent HIV infection that was part of an organized session and excludes discussions with friends. ** Percentages are of all participants in row category. †† Percentages are of participants in row category who received free condoms. §§ Suppressed because the number or numerator was five or fewer persons. ¶¶ Persons of Hispanic/Latino ethnicity might be of any race. *** Coverage through private insurance policies or employer, TRICARE, CHAMPUS, or membership in a health maintenance organization. ††† Coverage through Medicare, Medicaid, plans funded by state or local governments, or Veterans Administration. §§§ Visited a physician, nurse, or other health-care provider in the 12 months before the interview. ¶¶¶ Self-report of diagnosis by a health-care provider with any STD in the 12 months before the interview. **** Northeast: Boston, Massachusetts; Nassau-Suffolk, New York; New York City, New York; Newark, New Jersey; Philadelphia, Pennsylvania. South: Atlanta, Georgia; Baltimore, Maryland; Dallas, Texas; Houston, Texas; Miami, Florida; New Orleans, Louisiana; Washington, DC. Midwest: Chicago, Illinois; Detroit, Michigan; St. Louis, Missouri. West: Denver, Colorado; Los Angeles, California; San Diego, California; San Francisco, California; Seattle, Washington. Territories: San Juan, Puerto Rico. |
Use of trade names and commercial sources is for identification only and does not imply endorsement by the U.S. Department of
Health and Human Services.
References to non-CDC sites on the Internet are
provided as a service to MMWR readers and do not constitute or imply
endorsement of these organizations or their programs by CDC or the U.S.
Department of Health and Human Services. CDC is not responsible for the content
of pages found at these sites. URL addresses listed in MMWR were current as of
the date of publication.
All MMWR HTML versions of articles are electronic conversions from typeset documents.
This conversion might result in character translation or format errors in the HTML version.
Users are referred to the electronic PDF version (http://www.cdc.gov/mmwr)
and/or the original MMWR paper copy for printable versions of official text, figures, and tables.
An original paper copy of this issue can be obtained from the Superintendent of Documents, U.S.
Government Printing Office (GPO), Washington, DC 20402-9371;
telephone: (202) 512-1800. Contact GPO for current prices.
**Questions or messages regarding errors in formatting should be addressed to
mmwrq@cdc.gov.
