Corresponding author: Alex E. Crosby, MD, Division of Violence Prevention, National Center for Injury Prevention and Control, CDC, 4770 Buford Hwy, N.E., MS: F-63, Atlanta, Georgia, 30341. Telephone: 770- 488-4410, Fax: 770-488-4222, E-mail: aec1@cdc.gov.
Persons using assistive technology might not be able to fully access information in this file. For assistance, please send e-mail to: mmwrq@cdc.gov. Type 508 Accommodation and the title of the report in the subject line of e-mail.
Suicidal Thoughts and Behaviors Among Adults Aged ≥18 Years --- United States, 2008-2009
Abstract
Problem/Condition: Suicidal thoughts and behaviors are important public health concerns in the United States. In 2008, a total of 36,035 persons died as a result of suicide, and approximately 666,000 persons visited hospital emergency departments for nonfatal, self-inflicted injuries. State-level data on suicide-related issues are needed to help establish program priorities and to evaluate the effectiveness of suicide prevention strategies. Public health surveillance with timely and consistent exchange of data between data collectors and prevention program implementers allows prevention program practitioners to implement effective prevention and control activities.
Reporting Period: January 1, 2008-December 31, 2009.
Description of System: The National Survey on Drug Use and Health (NSDUH) is a national- and state-level survey of a representative sample of the civilian, noninstitutionalized U.S. population aged ≥12 years. NSDUH collects data on health-risks related to the use of illicit drugs, alcohol, and tobacco; initiation of substance use; substance use disorders and treatment; health care; and mental health. This report summarizes data on responses to questions concerning suicidal thoughts and behaviors contained in the mental health section among sampled persons aged ≥18 years in all 50 states and the District of Columbia. This report analyzes data on the prevalence of suicidal thoughts, planning, and attempts by age, sex, race/ethnicity, and state from 92,264 respondents in the 2008 and 2009 NSDUH.
Results: Prevalence estimates of suicidal thoughts and behaviors varied by sociodemographic factors, region, and state. During 2008-2009, an estimated 8.3 million (annual average) adults aged ≥18 years in the United States (3.7% of the adult U.S. population) reported having suicidal thoughts in the past year. The prevalence of having suicidal thoughts ranged from 2.1% in Georgia to 6.8% in Utah. An estimated 2.2 million (annual average) adults in the United States (1.0% of the adult U.S. population) reported having made suicide plans in the past year. The prevalence of reports of suicide planning ranged from 0.1% in Georgia to 2.8% in Rhode Island. An estimated 1 million (annual average) adults in the United States (0.5% of the U.S. adult population) reported making a suicide attempt in the past year. The prevalence of reports of suicide attempts ranged from 0.1% in Delaware and Georgia to 1.5% in Rhode Island. The prevalence of suicidal thoughts, suicide planning, and suicide attempts was significantly higher among young adults aged 18-29 years than it was among adults aged ≥30 years. The prevalence of suicidal thoughts was significantly higher among females than it was among males, but there was no statistically significant difference for suicide planning or suicide attempts.
Interpretation: The findings in this report indicate that substantial variations exist at the regional and state level in the prevalence of adults who had suicidal thoughts, made plans to attempt suicide, and attempted suicide in the past year. Geographic differences in prevalence might be attributable to selective migration, sociodemographic composition of the population, or the local social environment (e.g., social relationship indicators such as divorce rates or resources for access to health care). These findings emphasize the importance of continued surveillance to collect locally relevant data on which to base prevention and control activities.
Public Health Action: A better understanding of the patterns of the precursors to suicide is crucial to planning and evaluating a broad spectrum of suicide prevention efforts. These results can be used by state health departments and federal agencies to measure progress toward achieving national and state health objectives (e.g., those outlined in the National Strategy for Suicide Prevention). Continued surveillance is needed to design, implement, and evaluate public health policies and programs that can lead to a reduction in morbidity and mortality related to suicide-related thoughts and behaviors. Possible strategies to implement could include universal strategies (e.g., public education campaigns that focus on improving recognition of suicide risk) and indicated strategies (e.g., cognitive-behavioral therapy) that address the needs of persons exhibiting certain risk factors (e.g., persons who have made suicide attempts).
Introduction
Self-directed violence encompasses a range of behaviors, ranging from nonsuicidal intentional self-harm (i.e., behaviors in which the intention is not to kill oneself, as in self-mutilation) to acts of fatal and nonfatal suicidal behavior (1). Injury from self-directed violence is a major public health issue throughout the United States and worldwide (2-5). In 2008, suicide was the 10th leading cause of death in the United States, resulting in 36,035 deaths (6). Suicide is a problem throughout the life span; it is the fourth leading cause of death among children aged 10-14 years, the third among persons aged 15-24 years, the fourth among persons aged 25-44 years, and the eighth among those aged 45-64 years (6). Suicides reflect only a portion of the number of persons affected by suicidal thoughts and behaviors (Figure 1). Substantially more persons are hospitalized as a result of nonfatal suicidal behaviors than are fatally injured, and an even greater number are either treated in ambulatory settings or not treated at all (7,8). During 2007-2008, an estimated average of 569,000 persons visited U.S. hospital emergency departments annually for self-directed violence, 70%, of whom had attempted suicide (9-11). According to at least one nationally representative report, 56.8% of persons who engage in suicidal behavior never seek health services (12). Consequently, prevalence figures based on health-care encounters substantially underestimate the societal burden of suicidal behavior. For this reason, a broad array of assessment tools is needed to gain a better understanding of the magnitude of the problem.
Multiple assessment tools are used to understand the extent of suicide thoughts and behaviors collect data on deaths and nonfatal injuries. The National Vital Statistics System (NVSS) compiles demographic and causal data on all death certificates filed in the United States. NVSS final mortality data include all fatalities in the United States, but these data provide limited information about the exact nature and circumstances of the injury (13). The National Hospital Discharge Survey (NHDS) and the Health Care and Utilization Project (HCUP) measure inpatient care and hospital utilization (13). Although they provide detailed information about the nature of injuries, treatment, and discharge disposition, both HCUP and NHDS are limited because not all states require external cause-of-injury coding, which identifies the intent of the injury, on hospital discharge records. In 2004, the State and Territorial Injury Prevention Directors' Association (now named the Safe States Alliance) reported that only 43.8% of the medical records for which an injury was the principal diagnosis had an accompanying E-code (14). The National Hospital Ambulatory Medical Care Survey (NHAMCS) and the National Electronic Injury Surveillance System-All Injury Program (NEISS-AIP) collect data about all types and external causes of nonfatal injuries and poisonings treated in either U.S. hospital emergency departments (EDs) or hospital outpatient departments. However, although these systems are nationally representative, they do not have state-level samples (15). NSDUH data complement data from these other systems. Community surveys such as NSDUH can obtain data on injuries that do not result in death or severe injury, occur outside the hospital environment, or occur in settings for which vital statistics or hospital-based data are unavailable (16,17).
Population surveys capture data that can convey a different understanding of the problem than information based on health-care system encounters. In general, persons self-report occurrence of disease to a different extent than clinicians diagnose; similarly, they report risk or protective factors on surveys to a different degree than they reveal to their health-care providers (18). Multiple factors account for these differences. Some persons do not seek or do not have access to health care, so events involving these persons never appear in health records. In addition, persons tend to report fewer health problems to a health-care provider than they actually have (19,20). Anonymous population surveys can be perceived to be less intimidating to a respondent than a potential authority figure such as a health-care provider (21) and thus can provide data that complement other sources and that can be more comprehensive for policymaking and for making comparisons between population groups. A recent review of assessments examining primarily population-based surveys of suicidal thoughts and behavior among adults aged ≥18 years in the 12 months preceding the assessment indicated that 2.1%-10% of respondents reported having suicidal thoughts and 0.2%-2% reported making suicide attempts (22); these findings indicate that population surveys can provide researchers with a different perspective on the prevalence of suicidal thoughts and behaviors than those provided by death certificates or medical records.
Population surveys must be made relevant to the populations that they monitor. National estimates of the prevalence of suicidal thoughts and behaviors can be used to draw attention to the magnitude of the problem and are useful for establishing national health priorities. Nationally representative data also can be used to examine differences in rates among groups (e.g., sex, racial/ethnic, and age groups) and geographic regions. They are also useful in aggregating sufficient numbers of rare cases of a particular type of injury to identify patterns and mechanisms of injury. However, the national-level data alone convey only a partial picture of the public health burden of suicide-related events because there is substantial variation between areas. For example, rates of suicide have been demonstrated to vary more than threefold by geographic region (23).
The National Strategy for Suicide Prevention identified a need for data at the national, tribal, state, and local levels (24). Tribal, state, and local data can be used to help public health authorities establish local program priorities and evaluate the effectiveness of their suicide prevention strategies (13,25,26). The national public health surveillance capability requires a strong foundation of surveillance capacity at all levels of local, state, tribal and federal public health and the ability to rapidly, consistently, and securely exchange and share such data, detect events, and take appropriate public health actions. U.S. public health surveillance traditionally has been administered through state health departments. Because the implementation of prevention measures frequently involves interacting with persons, families, and community organizations (e.g., by providing education and performing training), most prevention programs are implemented at the tribal, state, and community levels (13). As problems and needs are identified, public support is garnered at the local level, and multiple organizations (including health-care providers, schools, civic groups, athletic leagues, businesses, and public safety departments) frequently work together to address injury hazards and concerns.
The lack of state-level data on the extent of suicidal thoughts and behaviors limits the ability of program practitioners to act in a focused fashion where the problem is the most acute. A population-based survey can provide some of this needed information. This report is the first to present state-level data on suicidal thoughts, planning, and attempts among adults. Another reason it is important to gather data about nonfatal suicidal behavior is that persons who made suicide attempts are one of the highest risk groups for subsequent death from suicide (2). These state-level data can be used by state health departments and federal agencies to measure progress toward achieving national and state health objectives as part of the NSSP or state suicide prevention plans (24,27).
Methods
This report summarizes national estimates on suicidal thoughts and behaviors by age, sex, race/ethnicity, education, current employment, and county type (i.e., based on population size). In addition, this report presents corresponding state-specific estimates by age, sex, race/ethnicity. A total of 92,264 persons aged ≥18 years participated in the National Survey on Drug Use and Health (NSDUH) during 2008-2009 (28). NSDUH is the only ongoing survey that collects national- and state-level data on suicidal thoughts and behaviors among the civilian, noninstitutionalized U.S. population aged ≥18 years. NSDUH is conducted annually by the Substance Abuse and Mental Health Services Administration (SAMHSA); data sources have been described in detail previously (28).
Sample Design
In 2008 and 2009, NSDUH employed a state-based design with an independent, multistage area probability sample within each state and the District of Columbia. The total population within each state is based on population estimates provided by the U.S. Census Bureau. The eight states with the largest populations (California, Florida, Illinois, Michigan, New York, Ohio, Pennsylvania, and Texas), which together accounted for 48% of the total U.S. population, were designated as "large sample states" and had sample sizes ranging from 3,556 to 3,830 persons in 2008 and from 3,557 to 3,707 persons in 2009. For the remaining 42 states and the District of Columbia, the target sample sizes ranged from 876 to 981 persons in 2008 and from 886 to 984 persons in 2009. Youths and young adults aged 12-25 years were oversampled so that each state's sample was distributed approximately equally among three age groups: persons aged 12-17 years, persons aged 18-25 years, and persons aged ≥26 years. This design resulted in a sample size for the 2-year period of approximately 4,800 adults (2,740 persons aged 18-29 years and 2,060 aged ≥30 years) in each of the eight largest states and 1,200 adults (685 persons aged 18-29 years and 515 persons aged ≥30 years) in each of the other 42 states (29).
Questionnaire
In both 2008 and 2009, all adult respondents were asked whether they had thought seriously about trying to kill themselves at any time during the past 12 months. Those respondents who reported having had serious suicidal thoughts were then asked whether, in the past 12 months, they had made any plans to kill themselves and whether they had tried to kill themselves. Before 2008, these questions were asked only of persons who reported having had at least one major depressive episode during the past year. Survey questions are available at http://oas.samhsa.gov/nsduh/2k8MRB/2k8Q.pdf.
Data Collection and Processing
The NSDUH data collection method involved conducting in-person interviews with selected persons and incorporating procedures designed to increase respondents' cooperation and willingness to report honestly about sensitive issues. Confidentiality was stressed in all written and oral communications with potential respondents. Audio-computer-assisted self-interviewing (ACASI) methods were used to provide respondents a private and confidential way to record answers. Interview data were compiled in a data file that consists of one record for each completed interview. Although some editing and consistency checks that are built into ACASI were performed during the interview, additional, more complex edits and consistency checks were applied after the interview was completed during data processing. Statistical imputation was used to replace missing or ambiguous values after editing for some key variables, but no imputation was done for suicide-related variables.
Weighting
The general approach to developing and calibrating analysis weights involved developing design-based weights as the product of the inverse of the selection probabilities at each selection stage. Adjustment factors then were applied to adjust for nonresponse, to poststratify to known population control totals, and to control for extreme weights when necessary. Because this report combines data for 2 years, person-level weights for estimates of annual averages were obtained by dividing the analysis weights by two. Weighted response rates for household screening and for interviewing were 89.0% and 74.4%, respectively, for the 2008 survey and 88.8% and 75.6%, respectively, for the 2009 survey.
Statistical Analyses
National prevalence (population and percentage estimates, relative standard errors, and 95% confidence intervals [CIs]) were estimated for adults aged ≥18 years who had suicidal thoughts, made any suicide plans, or attempted suicide in the past year and were analyzed by selected sociodemographic characteristics. Chi-square tests were applied to test for statistical significance of the associations between suicidal thoughts and behaviors and sociodemographic characteristics at the bivariate level. A p value of <0.05 was considered statistically significant.
Then the prevalence was estimated (population and percentage estimates, relative standard errors, and 95% CIs) for adults aged ≥18 years who had suicidal thoughts in the past year by sociodemographic characteristics, overall for the United States, and by age, sex, race/ethnicity, region, county type, and state. Classification of race/ethnicity and geographic regions were based on U.S. Census Bureau recommendations (29). Definitions of county type are based on U.S. Department of Agriculture classifications: large metropolitan areas have a population of ≥1 million persons, small metropolitan areas have a population of <1 million persons, and nonmetropolitan areas are those areas that are outside of metropolitan statistical areas (30). Next, prevalence was assessed for adults who made any suicide plans in the past year by these characteristics. Finally, prevalence was estimated for adults who attempted suicide in the past year by these same factors. SUDAAN software (31) was used to account for the complex sample design and sampling weights.
Direct survey estimates produced for this report that were considered to be unreliable because of unacceptably large sampling errors are not reported. This occurred among certain racial/ethnic populations (e.g., American Indians/Alaska Natives). The suppression criteria are based on the relative standard error (RSE, defined as the ratio of the SE over the estimate), actual sample size, and effective sample size for each estimate. According to the suppression criteria, prevalence estimates are suppressed if any of the following occurred: 1) the prevalence estimate is <0.005% or >99.995%, 2) the relative standard error of the negative natural logarithm of the estimated proportion p (where p is the prevalence divided by 100) is >0.175 if the prevalence is ≤50%, 3) the relative standard error of the negative of the natural logarithm of (1-p) is >0.175 if the prevalence is >50%, 4) the actual sample size is <100, or 5) the effective sample size (defined as the actual sample size divided by the design effect) is <68. The 2008 and 2009 NSDUH suppression rules have been published previously (29). The 95% CIs are asymmetric; asymmetric CIs are often more appropriate when dealing with small percentages (32). In this report, prevalence estimates are rounded to the nearest tenth, and therefore some numbers are recorded as <0.1%.
Results
Suicidal Thoughts and Behaviors
The prevalence rates of suicidal thoughts and behaviors are presented by sociodemographic characteristics (Table 1). During 2008-2009, an estimated 8.3 million (annual average) adults in the United States (3.7% of the adult U.S. population) reported having had suicidal thoughts in the past year. Adults aged 18-29 years were more likely than their older counterparts to have had suicidal thoughts, made any suicide plans, and attempted suicide in the past year. Females were more likely than males to have had suicidal thoughts in the past year but not more likely to have made suicide plans or attempted suicide. The racial/ethnic group with the highest prevalence for having suicidal thoughts and for making any suicide plans was non-Hispanic whites; the group with the lowest prevalence for suicidal thoughts and planning was non-Hispanic Asians. Non-Hispanic blacks were more likely than non-Hispanic Asians to report a suicide attempt in the past year. Adults with less than a high school education were more likely than college graduates to have had suicidal thoughts, made suicide plans, and attempted suicide in the past year. Unemployed adults were more likely than those with full-time employment to have had suicidal thoughts, made suicide plans, and attempted suicide in the past year. Adults in the Midwest and West were more likely to have had suicidal thoughts than those in the Northeast and South. Adults in the Midwest were more likely to have made suicide plans than those in the South. However, prevalence of suicide attempts did not vary by region. In addition, prevalence of past-year suicidal thoughts, plans, and attempts did not differ by the type of county in which adults resided (Table 1).
During 2008-2009, among adults aged ≥18 years, the estimated prevalence of suicidal thoughts ranged from 2.1% in Georgia to 6.8% in Utah (U.S. average: 3.7%)(Figure 2). The estimated prevalence of having made suicide plans ranged from 0.1% in Georgia to 2.8% in Rhode Island (U.S. average: 1.0%). The estimated prevalence of having made a suicide attempt ranged from 0.1% in Georgia and Delaware to 1.5% in Rhode Island (U.S. average: 0.5%) (Table 2).
Suicidal Thoughts
An estimated 2.9 million (annual average) persons aged 18-29 years in the United States had suicidal thoughts in the past year (5.7% of the age-group population). In this age group, prevalence ranged from 3.3% in North Carolina to 8.8% in Nevada. During 2008-2009, an estimated 5.5 million (annual average) persons aged ≥30 years in the United States had suicidal thoughts in the past year (3.1% of the population) (Table 3). In this age group, prevalence ranged from 1.6% in Georgia, Louisiana, and Mississippi to 6.5% in Rhode Island (Table 3).
During 2008-2009, an estimated 3.8 million (annual average) adult males in the United States had suicidal thoughts in the past year (3.5% of the adult male population). Among males, the prevalence ranged from 1.3% in Mississippi to 7.1% in Rhode Island. During 2008-2009, an estimated 4.6 million (annual average) female adults in the United States (3.9% of the adult female population) had suicidal thoughts in the past year (Table 4). Among adult females, prevalence ranged from 1.5% in Georgia to 9.1% in Nevada (Table 4).
During 2008-2009, an estimated 6.0 million (annual average) non-Hispanic white adults in the United States (3.9% of the non-Hispanic white population) had suicidal thoughts in the past year. Among non-Hispanic white adults, prevalence ranged from 1.7% in Hawaii to 7.5% in Utah. During that same period, an estimated 911,000 (annual average) non-Hispanic black adults in the United States (3.5% of the non-Hispanic black adult population) had suicidal thoughts in the past year. Among states with stable estimates for non-Hispanic black adults, prevalence ranged from 0.8% in Connecticut to 7.5% in Arkansas. During 2008-2009, an estimated 933,000 (annual average) Hispanic adults in the United States (3.0% of the Hispanic adult population) had suicidal thoughts in the past year. Among states with stable estimates for Hispanic adults, prevalence ranged from 0.6% in South Carolina to 8.6% in Wyoming. During that period, an estimated 208,000 (annual average) non-Hispanic Asian adults in the United States (2.1% of the adult non-Hispanic Asian population) had suicidal thoughts in the past year. Among states with stable estimates for non-Hispanic Asian adults, prevalence ranged from 1.2% in Florida to 3.8% in Michigan (Table 5).
Suicide Plans
During 2008-2009, an estimated 2.2 million (annual average) adults in the United States (1.0% of the U.S. adult population) reported making suicide plans in the past year (Table 1). An estimated 821,000 (annual average) persons aged 18-29 years in the United States (1.6% of the age group population) made suicide plans in the past year. In this age group, prevalence ranged from 0.4% in Georgia to 3.5% in Arkansas. During 2008-2009, an estimated 1.4 million (annual average) persons aged ≥30 years in the United States (0.8% of the age-group population) made suicide plans in the past year. In this age group, prevalence ranged from 0.1% in Mississippi to 2.8% in Rhode Island (Table 6).
During 2008-2009, an estimated 1.0 million (annual average) adult males in the United States (1.0% of the adult male population) made suicide plans in the past year. Among males, prevalence ranged from 0.1% in Georgia to 4.1% in Rhode Island. During 2008-2009, an estimated 1.2 million (annual average) adult females in the United States (1.0% of the female population) made suicide plans in the past year. Among females, prevalence ranged from 0.1% in Georgia to 3.1% in Nevada (Table 7).
During 2008-2009, an estimated 1.6 million (annual average) non-Hispanic white adults in the United States (1.0% of the adult non-Hispanic white population) made any suicide plans in the past year. Among non-Hispanic white adults, prevalence ranged from 0.1% in Georgia to 3.3% in Nevada. During that same period, an estimated 262,000 (annual average) non-Hispanic black adults in the United States (1.0% of the non-Hispanic black adult population) made suicide plans in the past year. Among states with stable estimates for non-Hispanic black adults, prevalence ranged from 0.2% in Delaware to 3.5% in Arkansas. During 2008-2009, an estimated 267,000 (annual average) Hispanic adults in the United States (0.9% of the adult Hispanic population) made suicide plans in the past year. Among states with stable estimates for Hispanic adults, prevalence ranged from <0.1% in District of Columbia to 5.0% in Connecticut. During that period, an estimated 37,000 (annual average) non-Hispanic Asian adults in the United States (0.4% of the non-Hispanic Asian adult population) made suicide plans in the past year. Among states with stable estimates for non-Hispanic Asian adults, prevalence ranged from 0.1% in Illinois to 0.5% in California (Table 8).
Suicide Attempts
During 2008-2009, approximately 1.0 million (annual average) adults in the United States (0.5% of the adult U.S. population) reported making a suicide attempt in the past year (Table 2; Figure 2) An estimated 477,000 (annual average) persons aged 18-29 years in the United States (1.0% of the age-group population) attempted suicide in the past year. In this age group, prevalence ranged from 0.1% in Iowa to 2.4% in Arkansas. During 2008-2009, an estimated 581,000 (annual average) persons aged ≥30 years in the United States (0.3% of the age-group population) attempted suicide in the past year. In this age group, prevalence ranged from 0.1% in Hawaii, Kentucky, Montana, New Hampshire, and North Dakota to 1.3% in Rhode Island (Table 9).
During 2008-2009, an estimated 442,000 (annual average) adult males in the United States (0.4% of the adult male population) attempted suicide in the past year. Among males, prevalence ranged from <0.1% in Alaska, the District of Columbia, and Georgia to 2.2% in Rhode Island. During 2008-2009, an estimated 616,000 (annual average) adult females in the United States (0.5% of the adult female population) attempted suicide in the past year. Among females, prevalence ranged from <0.1% in Montana and Virginia to 1.3% in Connecticut (Table 10).
During 2008-2009, an estimated 663,000 (annual average) non-Hispanic white adults in the United States (0.4% of the adult non-Hispanic white population) attempted suicide in the past year. Among non-Hispanic white adults, prevalence ranged from <0.1% in Georgia to 1.5% in Rhode Island. During the same period, an estimated 182,000 (annual average) non-Hispanic black adults in the United States (0.7% of the adult non-Hispanic black population) attempted suicide in the past year. Among states with stable estimates for non-Hispanic black adults, prevalence ranged from 0.1% in Pennsylvania to 2.0% in California. During 2008-2009, an estimated 144,000 (annual average) Hispanic adults in the United States (0.5% of the population) attempted suicide in the past year. Among states with stable estimates for Hispanic adults, prevalence ranged from <0.1% in District of Columbia and Oregon to 3.0% in Connecticut. During that same period, an estimated 23,000 (annual average) non-Hispanic Asian adults in the United States (0.2% of the adult non-Hispanic Asian population) attempted suicide in the past year. Among states with stable estimates for non-Hispanic Asian adults, prevalence ranged from 0.1% in California and Illinois to 0.3% in Michigan and New York (Table 11).
Discussion
This report is the first to present state-level data concerning answers to questions related to suicidal thoughts, plans, and attempts from the 2008 and 2009 NSDUH (29).The successful previous use of NSDUH data to describe other health behaviors (e.g., use of alcohol, illicit substances, and tobacco) (33-35) indicates its potential to measure progress in achieving national health objectives (36). The data could be particularly useful for state prevention practitioners in assessing and understanding the problem in their area and evaluating suicide prevention programs. The data may also be useful in generating research examining the factors that contribute to the sociodemographic differences in suicidal thoughts and behaviors (e.g., differences in the social determinants of health) (37,38).
The NSDUH results reveal significant sociodemographic and geographic variations in the estimated past-year prevalence of having suicidal thoughts, having made plans to attempt suicide, and having attempted suicide. Several theories have been advanced that attempt to explain these regional differences (37). These theories attribute the differences to selective migration (i.e., populations with risk factors for suicidal behavior might migrate to the same geographic areas), to the sociodemographic composition of the population (i.e., certain regions have a greater percentage of persons who are members of sociodemographic groups that are at greater risk for suicidal behavior), or to the local social environment (e.g., unemployment levels, divorce rates, social support, or environmental factors such as increased access to lethal means) (39,40). Such variations might point to areas of emphasis for planning and evaluation of prevention activities. In addition to describing the overall prevalence of suicide-related health problems, NSDUH data can be used to compare various aspects of suicidal thoughts and behaviors, analyze prevalence among subpopulations of adults (e.g., by sex or age group), assess trends in suicidal thoughts and behaviors over time, monitor progress toward achieving national or state health objectives, provide comparable state data, and evaluate and improve suicide-related prevention policies and programs.
Suicidal Thoughts
The prevalence of having seriously considered suicide differed by age, sex, state, and race/ethnicity. The prevalence of serious suicide consideration was higher among adults aged 18-29 years than it was for the overall U.S. population. Three recent population-based studies that measured 12-month prevalence of suicidal thought (the National Comorbidity Survey [NCS], the National Comorbidity Survey Replication [NCS-R], and the Injury Control and Risk Survey [ICARIS]) also revealed a higher prevalence of having suicidal thoughts among young adults (12,41,42). Previous studies consistently have demonstrated higher rates of having suicidal thoughts among females (12,41-44). In these analyses, prevalence was higher for females in the United States overall and in the majority of states. Similarly, racial/ethnic prevalences of suicidal thoughts differed; overall rates were highest for non-Hispanic whites. However, none of the racial/ethnic differences was statistically significant among non-Hispanic whites, non-Hispanic blacks, or Hispanics. Existing evidence on racial/ethnic differences in suicidal thoughts also has been mixed. Lifetime prevalence for having suicidal thoughts among respondents to the National Longitudinal Alcohol Epidemiologic Survey (NLAES) was lowest among non-Hispanic blacks and non-Hispanic Asians, but no significant differences were observed in NCS or the National Epidemiologic Survey on Alcohol and Related Studies (NESARC), which replaced NLAES in 2001 (41,43,44). Based on NSDUH data reporting, state-level prevalence of adults reporting having seriously considered suicide varied widely (range: 2.1%-6.8).
Suicide Plans
NCS, NCS-R, and ICARIS provided comparable national estimates but not state-level estimates on having made a plan to engage in suicidal behavior (12,41,42), and none of these was a regular, ongoing survey. The only significant sociodemographic difference in those samples was a higher prevalence of suicide planning among those aged 18-24 years and 35-44 years (41). The data provided in this report support this finding. Adults aged 18-29 years had a significantly higher prevalence of suicide planning than those aged ≥30 years. The only significant racial/ethnic difference was a lower prevalence of suicide planning among non-Hispanic Asians than among other racial/ethnic populations. However, NCS published data did not include Asians (42). Based on NSDUH data, state-level prevalence of reported suicide planning ranged from 0.1% to 2.8%.
Suicide Attempts
Comparable national-level (but not state-level) data on the 12-month prevalence of suicide attempts also are available from the NCS, NCS-R, NESARC and ICARIS samples (12,41,42). As in the NCS samples, the prevalence of suicide attempts in the current analyses was significantly higher among those aged 18-29 years. The finding of no significant differences in previous 12-month suicide attempts by sex also supports the previous findings. The only significant racial/ethnic difference identified in the current analyses was a lower prevalence of suicide attempts among non-Hispanic Asians. The NCS studies did not reveal any racial/ethnic differences in previous 12-month suicide attempts (41). In the ECA and NLAES samples, there were racial/ethnic differences in lifetime prevalence of suicide attempts; prevalence was lowest among non-Hispanic blacks (43,44). The ECA sample did not have an Asian population stratum for comparison. Although prevalence in the NLAES was qualitatively lowest among non-Hispanic blacks compared with other racial/ethnic groups, the estimated prevalence for non-Hispanic Asians was also low in this sample and did not differ significantly from that among non-Hispanic blacks. Based on the NSDUH data, state-level prevalence of adults reporting having made a suicide attempt varied widely (range: 0.1%-2.0%), this might in part reflect wide state-level differences in sociodemographic factors.
Limitations
The findings in this report are subject to at least three main limitations. First, because of low precision, certain estimates were suppressed after stratification by state and sociodemographic characteristics, which limited the ability to examine more age groups and certain racial/ethnic populations. However, the findings are comparable with those of previous studies examining similar types of thoughts and behaviors. Because this report focused on past-year prevalence of suicidal behaviors rather than on lifetime prevalence, it yielded lower estimates; however, the survey methodology reduced the potential for recall bias and thus provides more relevant information for current prevention and intervention (45). Previous studies have indicated that adults underreport suicidal thoughts that occurred when they were adolescents (46). Second, estimates from NSDUH are generalizable only to the civilian, noninstitutionalized population aged ≥18 years. Although this population includes the majority of the total U.S. population aged ≥18 years, it excludes active-duty military personnel, persons living in institutional group quarters (e.g., correctional facilities and residential drug treatment centers), and homeless persons not living in shelters on the survey date. In addition, suicidal thoughts and behaviors among American Indian/Alaska Native adults could not be reported because of low precision of sample estimates. Certain segments of these populations have a higher prevalence of some suicidal thoughts and behaviors than the general U.S. population, and thus this report might underestimate the actual prevalence rates of suicidal thoughts and behaviors among adults in the United States (47,48). Finally, NSDUH data are based on self-reports, not observations of actual incidents in the case of suicide attempts, and the extent of underreporting or overreporting of behaviors cannot be determined. Similar survey questions that were administered among high school students demonstrated good test-retest reliability (49). However, no reliability or validity data were obtained on the measures of thoughts, plans, and attempts among adults. In addition, respondents tend to recall events in the recent past better than those occurring more distantly (50). This could reflect why certain groups would have lower prevalences if their event was 11 months prior to the survey compared with others whose event was only 1 month prior to the survey. Persons in the former group might not report their event because of recall bias, and so the finding might not mean that their rates were actually lower.
Conclusion
This report presents the first combined, representative state- and region-specific analyses of suicidal thoughts and behaviors among adults aged ≥18 years in the United States. The data presented in this report support other findings that the public health burden of suicidal thoughts and behaviors throughout the United States is much greater than the number of deaths (22). The findings in this report document important state-specific differences in the reported prevalence of suicidal thoughts, plans, and attempts both overall and when examined by age, sex, and race/ethnicity. For example, younger adults aged 18-29 years tended to report more suicidal thoughts, plans, and attempts in most states compared with those aged ≥30 years. The regional differences described in this report indicate some differences from state-level suicide analyses, which have consistently reported higher rates in the Rocky Mountain and western states (23). These studies have demonstrated that regional differences in demographic patterns (i.e., age, race/ethnicity, and sex) and in suicide methods do not account completely for variations in suicide. Nonfatal suicidal behavior has been demonstrated to have different patterns from fatal behavior, which might account for the differences between the state patterns in this report compared with patterns from mortality reports (40). For example, rates of fatal suicidal behavior are higher among males and middle aged or older adults whereas rates of nonfatal suicidal behavior are higher among females and adolescents and young adults (2).
In 1999, to maximize the benefits of suicide prevention efforts and resources, the U.S. Surgeon General issued the Call to Action to Prevent Suicide, which recommended using a public health approach to address suicide-related issues (51,52). The first step of such an approach is to define and assess the problem, which includes measuring characteristics of persons who engage in the behavior. Whereas state vital statistics systems usually contain mortality data, sources of nonfatal population-level data on those who seriously consider or who make a plan to attempt suicide are limited. Furthermore, data that allow for state-specific assessments and comparisons of the prevalence of nonfatal suicidal behavior across states are lacking (26).
Although several other national surveys have conducted analyses of sociodemographic differences in suicidal thoughts or behaviors (12,41-43), they did not collect state-level data. For example, NCS (conducted during 1990-1992) and NCS-R (conducted during 2001-2003) were both nationally representative household surveys of U.S. adults (41,42). These surveys used fully structured research diagnostic interviews to assess the prevalence and correlates of psychiatric disorders and included sociodemographic factors; parental psychopathology; a 12-month and lifetime prevalence of suicidal thoughts, plans, gestures, and attempts together with their treatment; and mental disorders based on the criteria of the Diagnostic and Statistical Manual of Mental Disorders, fourth edition (DSM-IV) (53). For each survey, approximately 10,000 respondents were interviewed. NESARC, conducted during 2001-2002, was a nationally representative survey focusing on the distribution and correlates of alcohol use disorders and associated conditions but included questions on suicidal thoughts and behaviors. It included 43,093 respondents (35). NSDUH uses epidemiologically based questions to assess sociodemographic characteristics and a 12-month prevalence of suicidal thoughts, plans, and attempts as well as other mental health and substance misuse-related issues. For NSDUH, approximately 92,000 respondents were interviewed in the 50 states and the District of Columbia.
Multiple individual, peer, family, community, and societal factors have been associated with suicidal behaviors. For example, levels of mental illness, substance misuse, family dysfunction, and violence victimization might be higher in communities with higher reports of suicidal behaviors (54). Similarly, suicidal behaviors tend to be higher in communities with low levels of social integration, high unemployment, lack of access to health-care services, and unstable social environments (54). The variations identified in this report might reflect differences in the prevalence of risk factors and socioeconomic composition of the study populations.
The wide variations identified between the age groups, sexes, and racial/ethnic populations in suicidal thoughts and behaviors indicate that different strategies are needed to address the needs of these diverse groups and eliminate health disparities. Several states have initiated multiple prevention strategies designed to reduce the impact of injuries from suicidal behavior, including improving data collection efforts, public education campaigns, crisis intervention services, and family support programs (27,55). These strategies should be evaluated and, if documented to be effective, adapted for use in other states, particularly those with the highest reports of suicidal behavior.
Further studies are needed to better understand the effect of known risk and protective factors on the development and prevalence of suicidal thoughts and behaviors. These state-specific results can be of great utility in assessing a state's status on this health indicator in relation to neighboring states and within and across geographic regions. Only a small proportion of those who attempt suicide eventually die by suicide (56). However, persons with a past history of suicide attempts are at greater risk for dying by suicide than those who do not have such a history (3). Possible suicide-prevention strategies to implement could include universal strategies (e.g., public education campaigns that focus on improving recognition of suicide risk) and indicated strategies (e.g., cognitive-behavioral therapy) that address the needs of persons exhibiting certain risk factors (e.g., persons who have made suicide attempts) (57).
References
- Crosby AE, Ortega L, Melanson C. Self-directed violence surveillance: uniform definitions and recommended data elements, version 1.0. Atlanta, GA: US Department of Health and Human Services, CDC; 2011.
- DeLeo D, Bertolote J, Lester D. Self-directed violence. In: Krug EG, Dahlberg LL, Mercy JA, Zwi AB, Lozano R, eds. World report on violence and health. Geneva, Switzerland: World Health Organization; 2002:185-212.
- Goldsmith SK, Pellmar TC, Kleinman AM, Bunney WE, eds. Reducing suicide: a national imperative. Washington, DC: National Academy Press; 2002.
- World Health Organization. Prevention of suicide: guidelines for the formulation and implementation of national strategies. Geneva, Switzerland: World Health Organization; 1996.
- Murray CLJ, Lopez AD. Mortality by cause for eight regions of the world: global burden of disease study. Lancet 1997;349:1269-76.
- CDC. Web-Based Injury Statistics Query and Reporting System (WISQARS). Available at http://www.cdc.gov/injury/wisqars/index.html. Accessed October 12, 2011.
- Rosenberg ML, Gelles RJ, Holinger PC. Violence: homicide, assault and suicide. In: Amler RW, Dull HB, eds. Closing the gap: the burden of unnecessary illness. New York, NY: Oxford University Press; 1987.
- Mościcki EK, Crosby A. Epidemiology of attempted suicide in adolescents: issues for prevention. Trends Evidence-Based Neuropsychiatry 2003;5:36-44.
- Niska R, Bhuiya F, Xu J. National Hospital Ambulatory Medical Care Survey: 2007 emergency department summary. National Health Stat Rep; no 26. Hyattsville, MD: US Department of Health and Human Services, CDC, National Center for Health Statistics; 2010.
- CDC, National Center for Health Statistics. National Hospital Ambulatory Medical Care Survey: 2008 emergency department summary tables. Available at http://www.cdc.gov/nchs/data/ahcd/nhamcs_emergency/nhamcsed2008.pdf. Accessed October 12, 2011.
- CDC. Nonfatal self-inflicted injuries treated in hospital emergency departments-United States, 2000. MMWR. 2002;51:436-8.
- Crosby AE, Cheltenham MP, Sacks JJ. Incidence of suicidal ideation and behavior in the United States, 1994. Suicide Life Threat Behav 1999;29:131-40.
- Bonnie RJ, Fulco CE, Liverman CT, eds. Reducing the burden of injury: advancing prevention and treatment. Washington, DC: National Academy Press; 1999.
- State and Territorial Injury Prevention Directors' Association. Consensus recommendations for injury surveillance in state health departments. Marietta, GA: State and Territorial Injury Prevention Directors' Association; 2007.
- CDC. National estimates of nonfatal injuries treated in hospital emergency departments --- United States, 2000. MMWR 2001;50;340-6.
- Holder Y, Peden M, Krug E, et al., eds. Injury surveillance guidelines. Geneva, Switzerland: World Health Organization; 2001.
- Sethi D, Habibula S, McGee K, et a., eds. Guidelines for conducting community surveys on injuries and violence. Geneva, Switzerland: World Health Organization; 2004.
- Harvard Scholl of Public Health. Proceedings of the workshop on using demographic and health survey (DHS) data for health sector reform. Available at http://www.hsph.harvard.edu/ihsg/publications/pdf/No-13.PDF. Accessed October 12, 2011.
- Harlow SD, Linet MS. Agreement between questionnaire data and medical records: the evidence for accuracy of recall. Am J Epidemiol 1989;129:233-48.
- Sadana R. Measuring reproductive health: review of community-based approaches to assessing morbidity. Bull World Health Organ 2000;78:640-54.
- Duncan T, Frankenberg E. The measurement and interpretation of health in social surveys. In: Murray C, Salomon J, Mathers C, Lopez A, eds. Measurement of the global burden of disease. Geneva, Switzerland: World Health Organization; 2002:387-420.
- Nock MK, Borges G, Bromet EJ, Cha CB, Kessler RC, Lee S. Suicide and suicidal behavior. Epidemiol Rev 2008;30:133-54.
- CDC. Regional variations in suicide rates-United States, 1990-1994. MMWR 1997;46:789-93.
- US Department of Health and Human Services, Public Health Service. National strategy for suicide prevention: goals and objectives for action. Available at https://store.samhsa.gov/shin/content/SMA01-3517/SMA01-3517.pdf. Accessed October 12, 2011.
- State and Territorial Injury Prevention Directors Association. Injury Surveillance Workgroup 5. Consensus recommendations for injury surveillance in state health departments. Available at http://ibis.health.state.nm.us/docs/Query/STIPDAConcensusRecommendations.pdf. Accessed October 12, 2011.
- Suicide Prevention Action Network. Strategies to improve non-fatal suicide attempt surveillance-recommendations from an expert roundtable. Washington, DC: Suicide Prevention Action Network; 2006.
- Calgary Centre for Suicide Prevention. A summary of national, state and provincial strategies for the prevention of suicide. Calgary, Alberta, Canada: Calgary Centre for Suicide Prevention; 2004.
- Substance Abuse and Mental Health Services Administration. Results from the 2008 National Survey on Drug Use and Health: national findings (Office of Applied Studies, NSDUH Series H-36, HHS Publication No. SMA 09-4434). Available at http://oas.samhsa.gov/nsduh/2k8nsduh/2k8Results.pdf. Accessed October 12, 2011.
- Substance Abuse and Mental Health Services Administration. State estimates of substance use and mental disorders from the 2008-2009 National Surveys on Drug Use and Health, NSDUH Series H-40, HHS Publication No. (SMA) 11-4641. Available at http://store.samhsa.gov/shin/content/SMA11-4641/SMA11-4641.pdf. Accessed October 12, 2011.
- US Department of Agriculture, Economic Research Service. Measuring rurality: 2004 county typology codes. Available at http://www.ers.usda.gov/briefing/rurality/Typology. Accessed October 12, 2011.
- Shah B, Barnwell B, Bieler G. SUDAAN user's manual. version 9.1 ed. Research Triangle Park, NC: Research Triangle Institute; 2005.
- Substance Abuse and Mental Health Services Administration. 2005 National Survey on Drug Use and Health: statistical inference report. Available at http://oas.samhsa.gov/nsduh/2k5MRB/2k5statInference.pdf. Accessed October 12, 2011.
- CDC. CDC health disparities and inequalities report-United States, 2011. MMWR 2011;60(Suppl):109-13.
- Miller JW, Gfroerer JC, Brewer RD, Naimi TS, Mokdad A, Giles WH. Prevalence of adult binge drinking: a comparison of two national surveys. Am J Prev Med 2004;27:197-204.
- Trosclair A, Dube SR. Smoking among adults reporting lifetime depression, anxiety, anxiety with depression, and major depressive episode, United States, 2005-2006. Addict Behav 2010;35:438-43.
- US Department of Health and Human Services. Tracking Healthy People 2010. Washington, DC: US Government Printing Office; 2000.
- World Health Organization. Closing the gap in a generation: health equity through action on the social determinants of health. Report from the Commission on Social Determinants of Health. Geneva, Switzerland: World Health Organization; 2008.
- Hicks J. The social determinants of elevated rates of suicide among Inuit youth. Indigenous Affairs. 2007; 4:30-37.
- Lester D. Explaining regional differences in suicide rates. Soc Sci Med 1995;40:719-21.
- Claassen CA, Carmody T, Bossarte R, Trivedi MH, Elliot S, Currier GW. Do geographic regions with higher suicide rates also have higher rates of nonfatal intentional self-harm? Suicide Life Threat Behav 2008;38:637-49.
- Kessler RC, Berglund P, Borges G, et al. Trends in suicide ideation, plans, gestures, and attempts in the United States, 1990-1992 to 2001-2003. JAMA 2005;293:2487-95.
- Borges G, Angst J, Nock MK, et al. A risk index for 12-month suicide attempts in the National Comorbidity Survey Replication (NCS-R). Psychol Med 2006;36:1747-57.
- Baca-Garcia E, Perez-Rodriguez MM, Keyes KM, et al. Suicidal ideation and suicide attempts in the United States: 1991-1992 and 2001-2002. Mol Psychiatry 2010;15:250-9.
- Moscicki EK, O'Carroll P, Regier DA, et al. Suicide attempts in the Epidemiologic Catchment Area Study. Yale J Biol Med 1988; 61:259-68.
- Kruijshaar ME, Barendregt J, Vos T, De Graf R, Spijker J, Andrews G. Lifetime prevalence estimates of major depression: an indirect estimation method and a quantification of recall bias. Eur J Epidemiol 2005;20:103-11.
- Goldney RD, Smith S,Winefield AH, et al. Suicidal ideation: its enduring nature and associated morbidity. Acta Psychiatr Scand 1991;83:115-20.
- Mumola C, Noonan M. Deaths in custody statistical tables. Washington, DC: US Department of Justice, Office of Justice Programs, Bureau of Justice Statistics; 2008.
- Centre for Suicide Prevention. Suicide among the homeless. Calgary, Alberta, Canada: Canadian Mental Health Association; 2010.
- Brener ND, Kann L, McManus T, Kinchen SA, Sundberg EC, Ross JG. Reliability of the 1999 Youth Risk Behavior Survey questionnaire. J Adolesc Health 2002;31:336-42.
- Mościcki EK, O'Carroll P, Locke BZ, Rae DS, Roy AG, Regier DA. Suicidal ideation and attempts: the epidemiologic catchment area. In: US Department of Health and Human Services. Report of the Secretary's Task Force on Youth Suicide: vol. 4. Strategies for the prevention of youth suicide. Washington, DC: US Government Printing Office; 2008:115-28.
- US Public Health Service. The Surgeon General's call to action to prevent suicide. Washington, DC: US Public Health Service; 1999.
- Satcher DA. Bringing the public health approach to the problem of suicide. Suicide Life Threat Behav 1998;28:325-7.
- American Psychiatric Association. Diagnostic and statistical manual of mental disorders. 4th ed. Washington, DC: American Psychiatric Association; 1994.
- McLean J, Maxwell M, Platt S, Harris F, Jepson R. Risk and protective factors for suicide and suicidal behaviour: a literature review. Edinburgh, Scotland, UK: Scottish Government Social Research. 2008. Available at http://www.scotland.gov.uk/Publications/2008/11/28141444/0. Accessed October 12, 2011.
- Lubell KM, Harber-Singer H, Gonzalez B. State suicide prevention planning: a CDC research brief. Atlanta, GA: CDC; 2008.
- Kuo WH, Gallo JJ. Completed suicide after a suicide attempt. Am J Psychiatry 2005;162-3.
- Mann JJ, Apter A, Bertolote J, et al. Suicide prevention strategies: a systematic review. JAMA 2005; 294:2064-74.
FIGURE 1. Public health burden of suicidal behavior among adults aged ≥18 years --- United States, 2008
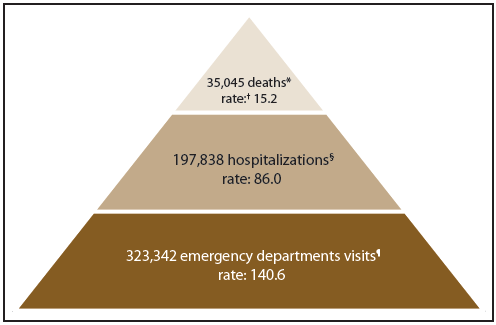
* Source: CDC's National Vital Statistics System.
† All rates per 100,000 population; population estimates provided by U.S. Census Bureau.
§ Source: Agency for Healthcare Research and Quality's Healthcare Cost and Utilization Project-Nationwide Inpatient Sample.
¶ Source: CDC's National Electronic Injury Surveillance System-All Injury Program.
Alternate Text: The figure shows the number and rate of deaths, hospitalizations, and emergency department visits associated with suicidal behaviors among U.S. adults aged ≥18years from three data sources for 2008. A total of 35,045 deaths (rate: 15.2 per 100,000 persons), 197,838 hospitalizations (rate: 86.0 per 100,000 persons), and 323,342 emergency department visits (rate: 140.6 per 100,000 population) were reported.
FIGURE 2. Average annual prevalence of suicidal thoughts among adults aged ≥18 years, by state --- National Survey on Drug Use and Health, United States, 2008-2009*
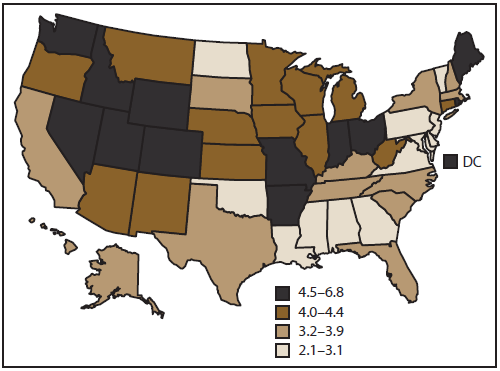
* U.S. average: 3.7.
Alternate Text: The figure shows a map of the United States indicating the average annual prevalence of suicidal thoughts among adults aged ≥18 years for 2008-2009, by state. The estimated prevalence of suicidal thoughts ranged from 2.1% in Georgia to 6.8% in Utah (U.S. average: 3.7%).
Use of trade names and commercial sources is for identification only and does not imply endorsement by the U.S. Department of
Health and Human Services.
References to non-CDC sites on the Internet are provided as a service to MMWR readers and do not constitute or imply endorsement of these organizations or their programs by CDC or the U.S. Department of Health and Human Services. CDC is not responsible for the content of pages found at these sites. URL addresses listed in MMWR were current as of the date of publication.
References to non-CDC sites on the Internet are provided as a service to MMWR readers and do not constitute or imply endorsement of these organizations or their programs by CDC or the U.S. Department of Health and Human Services. CDC is not responsible for the content of pages found at these sites. URL addresses listed in MMWR were current as of the date of publication.
All MMWR HTML versions of articles are electronic conversions from typeset documents. This conversion might result in character translation or format errors in the HTML version. Users are referred to the electronic PDF version (http://www.cdc.gov/mmwr) and/or the original MMWR paper copy for printable versions of official text, figures, and tables. An original paper copy of this issue can be obtained from the Superintendent of Documents, U.S. Government Printing Office (GPO), Washington, DC 20402-9371; telephone: (202) 512-1800. Contact GPO for current prices.
**Questions or messages regarding errors in formatting should be addressed to mmwrq@cdc.gov.
