Diabetes Among Asians and Native Hawaiians or other Pacific Islanders — United States, 2011–2014
, PhD1; , MBBS1; , MA1
Asians and Native Hawaiians or other Pacific Islanders (NHPIs) are fast-growing U.S. minority populations*,† at high risk for type 2 diabetes (1–4). Although national studies have described diabetes prevalence, incidence, and risk factors among Asians (2–5) and NHPIs (2,5) compared with non-Hispanic whites, little is known about state-level diabetes prevalence among these two racial groups, or about how they differ from one another with respect to diabetes risk factors. To examine state-level prevalence of self-reported, physician-diagnosed (diagnosed) diabetes and risk factors among Asians and NHPIs aged ≥18 years, CDC analyzed data from the 2011–2014 Behavioral Risk Factor Surveillance System (BRFSS). Among five states and Guam with sufficient data about NHPIs for analysis, the age-adjusted diabetes prevalence estimate for NHPIs ranged from 13.4% (New York) to 19.1% (California). Among 32 states, the District of Columbia (DC), and Guam that had sufficient data about Asians for analysis, diabetes prevalence estimates for Asians ranged from 4.9% (Arizona) to 15.3% (New York). In the five states and Guam with sufficient NHPI data, NHPIs had a higher age-adjusted prevalence of diabetes than did Asians, and a higher proportion of NHPIs were overweight or obese and had less than a high school education compared with Asians. Effective interventions and policies might reduce the prevalence of diabetes in these growing, high-risk minority populations.
Diabetes is a major public health problem that disproportionately affects Asians and NHPIs (1–4). The higher rates of diabetes in these populations might reflect elevated genetic susceptibility, higher prevalences of risk factors such as obesity, physical inactivity, educational attainment, or a combination of these and other factors (2–5). Prevalences of diagnosed diabetes and associated risk factors were assessed using 2011–2014 BRFSS data. BRFSS is a state-based, random-digit–dialed, cellular and landline telephone survey of the U.S. civilian noninstitutionalized population aged ≥18 years, and is conducted in all 50 states, DC, Guam, Puerto Rico, and the U.S. Virgin Islands. The state-specific median response rate was 49.7% (range = 33.8%–64.1%) in 2011, 45.2% (27.7%–60.4%) in 2012, 46.4% (29.0%–60.3%) in 2013, and 47.0% (25.1%–60.1%) in 2014. Persons with reported diagnosed diabetes were defined as those who answered "yes" to the question: "Have you ever been told by a doctor that you have diabetes?" Data were combined for 2011–2014 to obtain overall U.S. estimates for non-Hispanic whites (whites), Asians, and NHPIs. State-specific estimates of diabetes prevalence with relative standard errors >30% or sample sizes <50 were not reported. Analyses were weighted to account for the complex sampling design.
For the states with sufficient data for both Asians and NHPIs, the distributions of diabetes risk factors and their proportions attributable to diabetes prevalence were estimated. These risk factors included age, sex, educational attainment, lack of leisure-time physical activity during the past month, and body mass index (BMI; kg/m2) computed from respondents' self-reported weight and height (classified as normal weight [BMI <25.0], overweight [BMI = 25.0–29.9], and obese [BMI >29.9]). Data were age-adjusted using the 2000 U.S. standard population. Multivariate adjusted prevalence by race was estimated from logistic regression models predicting diabetes as a function of age, sex, educational attainment level, BMI, and physical inactivity (6). A chi-square test was used to determine whether differences between races in the distribution of diabetes risk factors were significant, and a t-test was used to determine whether differences in diabetes prevalence between races were significant (p<0.05 for both tests).
Thirty-two states, DC, and Guam had sufficient data to estimate diabetes prevalence among Asians, and five states (California, Hawaii, New York, Utah, and Washington) and Guam had sufficient data to estimate prevalence for NHPIs (Table 1). Across all states, the age-adjusted prevalence of diagnosed diabetes was higher among Asians (9.9%) and NHPIs (14.3%) than among whites (8.0%), (p<0.001 for both). In the 32 states, DC, and Guam, where sufficient data for analysis of prevalence among Asians were available, age-adjusted prevalence of diagnosed diabetes among Asians ranged from 4.9% in Arizona to 15.3% in New York, with eight states (Iowa, Kentucky, Massachusetts, Nevada, New York, North Carolina, Oklahoma, and South Carolina) in the highest quartile (>10.5%) of age-adjusted diabetes prevalence (Figure). Age-adjusted prevalences of diabetes for NHPIs exceeded 10.5% in all five states and Guam where sufficient data for analysis of NHPIs were available, ranging from 13.4% in New York to 19.1% in California (Table 1).
The age-adjusted prevalence of diabetes was significantly higher for NHPIs than Asians in California (19.1% versus 9.7%, p = 0.005), Hawaii (13.9% versus 8.8%, p = 0.001), Utah (18.6% versus 6.4%, p = 0.006), and Guam (15.7% versus 8.5%, p<0.001) (Table 1), but not in New York (13.4% versus 15.3%, p = 0.647) or Washington (17.8% versus 10.0%, p = 0.054).
When the data from California, Hawaii, New York, Utah, Washington, and Guam were combined, the distribution of diabetes risk factors varied between the two racial groups (Table 2). NHPIs were younger (p = 0.03), had lower educational levels (p<0.001), and higher BMIs (p<0.001) than Asians; differences by sex or prevalence of physical inactivity were not significant. When the prevalence of diabetes between the two groups was examined by risk factors, NHPIs had higher diabetes prevalences for persons in age groups 18–44 years (p = 0.006) and 45–64 years (p = 0.01) than did Asians. Age-adjusted diabetes prevalence was higher in NHPI females (p = 0.002) and persons who had less than or greater than a high school education (p = 0.002 and p = 0.02, respectively) (Table 2). Age-adjusted diabetes prevalence for physical inactivity or BMI did not differ between the two groups (Table 2).
Overall, after adjusting for age, NHPIs had a higher prevalence of diabetes than Asians (p = 0.001) (Table 2). However, after adjusting for diabetes risk factors (sex, age, BMI, education, and physical inactivity), the prevalence of diabetes for NHPIs and Asians was not significantly different.
Discussion
This report is the first to provide state-specific estimates of self-reported, diagnosed diabetes prevalence among Asians and NHPIs in the United States. During 2011–2014, among Asians, age-adjusted prevalence of diagnosed diabetes varied widely across states, with approximately a threefold difference between the state with the highest prevalence (New York, 15.3%) and the state with the lowest (Arizona, 4.9%). In six geographic areas with sufficient data to analyze diabetes prevalence among NHPIs, age-adjusted diabetes prevalence for NHPIs exceeded 13.0%; in three jurisdictions, approximately one in six NHPIs had diagnosed diabetes.
These findings are consistent with earlier studies that reported a higher prevalence of diabetes among Asians (2–4) and NHPIs (2) compared with whites in the United States, and a higher rate of diabetes in NHPIs than in Asians (2,5). This report found differences in the distribution of risk factors for diabetes between Asians and NHPIs in five U.S. states and one territory with sufficient data for both groups. NHPIs had higher BMIs and lower educational levels, both of which are important risk factors for diabetes (7). After adjusting for several risk factors, the difference in diabetes prevalence between Asians and NHPIs was no longer significant, suggesting that these risk factors might account for the difference.
The findings in this report are subject to at least five limitations. First, diabetes prevalence was measured by self-report and might be subject to recall and selection bias. Second, prevalence of diabetes might be underestimated because it has been shown that approximately one in four persons with diabetes has not received a diagnosis of diabetes.§ Third, 18 states lacked sufficient data for estimating diabetes prevalence for Asians, and 45 states lacked sufficient data to estimate prevalence for NHPIs. Thus, the six jurisdictions used for the analyses comparing Asians and NHPIs are not representative of the United States. Fourth, these estimates do not reflect the prevalence of diabetes among diverse subpopulations of Asians (2,8–10) or NHPIs, which might account for some of the state-specific differences with variations in the resident Asian or NHPI subpopulations. Finally, this study does not differentiate between type 1 and type 2 diabetes, which might differ among races and have implications for management of the disease.
CDC and its partners support programs to prevent and control diabetes, with the goal of achieving the greatest impact in populations with the greatest disease burden or risk. To that end, CDC is leading the National Diabetes Prevention Program,¶ designed to bring to U.S. communities evidence-based lifestyle interventions for preventing type 2 diabetes among persons at high risk. In addition, the American Medical Association and CDC have developed materials to guide physicians and other health care providers on the best methods to screen and refer high-risk patients to diabetes prevention programs in their communities. Because Asians and NHPIs are growing minority populations that are at increased risk for developing type 2 diabetes, continued surveillance for diabetes and its risk factors among Asians and NHPIs is an important component in monitoring progress toward reducing their burden of diabetes. Diabetes resources in several Asian and NHPI languages are available at http://nccd.cdc.gov/DDT_DPR.
1Division of Diabetes Translation, National Center for Chronic Disease Prevention and Health Promotion, CDC.
Corresponding author: Karen A. Kirtland, kkirtland@cdc.gov, 404-639-3286.
References
- American Diabetes Association. Standard of medical care in diabetes—2014. Diabetes Care 2013; 36(Suppl 1).
- Karter AJ, Schillinger D, Adams AS, et al. Elevated rates of diabetes in Pacific Islanders and Asian subgroups: the Diabetes Study of Northern California (DISTANCE). Diabetes Care 2013;36:574–9.
- McNeely MJ, Boyko EJ. Type 2 diabetes prevalence in Asian Americans: results of a national health survey. Diabetes Care 2004;27:66–9.
- Lee JW, Brancati FL, Yeh HC. Trends in the prevalence of type 2 diabetes in Asians versus whites: results from the United States National Health Interview Survey, 1997–2008. Diabetes Care 2011;34:353–7.
- Maskarinec G, Jacobs S, Morimoto Y, Chock M, Grandinetti A, Kolonel LN. Disparity in diabetes risk across Native Hawaiians and different Asian groups: the multiethnic cohort. Asia Pac J Public Health 2015;27:375–84.
- Graubard BI, Korn EL. Predictive margins with survey data. Biometrics 1999;55:652–9.
- Geiss LS, Pan L, Cadwell B, Gregg EW, Benjamin SM, Engelgau MM. Changes in incidence of diabetes in US adults, 1997–2003. Am J Prev Med 2006;30:371–7.
- Choi SE, Chow VH, Chung SJ, Wong ND. Do risk factors explain the increased prevalence of type 2 diabetes among California Asian adults? J Immigr Minor Health 2011;13:803–8.
- Gujral UP, Pradeepa R, Weber MB, Narayan KM, Mohan V. Type 2 diabetes in South Asians: similarities and differences with white Caucasian and other populations. Ann N Y Acad Sci 2013;1281:51–63.
- Ma RC, Chan JC. Type 2 diabetes in East Asians: similarities and differences with populations in Europe and the United States. Ann N Y Acad Sci 2013;1281:64–91.
* Available at https://www.census.gov/prod/cen2010/briefs/c2010br-11.pdf.
† Available at http://www.census.gov/prod/cen2010/briefs/c2010br-12.pdf.
§ Available at http://www.cdc.gov/diabetes/pubs/statsreport14/national-diabetes-report-web.pdf.
¶ Available at http://www.cdc.gov/diabetes/prevention.
Summary
What is already known on this topic?
Previous national studies have shown that the prevalence of diabetes among Asians and Native Hawaiians and other Pacific Islanders (NHPIs) is higher than that among non-Hispanic whites.
What is added by this report?
The national-level findings in this study are consistent with previous reports. However, this is the first study to provide state-specific prevalences of diabetes for Asians and NHPIs for those states and territory with sufficient data for analysis. For both state and national estimates, NHPIs had higher prevalences of diabetes than did Asians.
What are the implications for public health practice?
Diabetes is a major public health problem that disproportionately affects Asians and NHPIs. The state-specific data from this study could be used to create more effective interventions and policies to reverse the large diabetes burden in these growing, high-risk minority populations. Continued surveillance for diabetes and its risk factors among Asians and NHPIs is an important component in monitoring progress toward reducing their burden of diabetes.
FIGURE. Prevalence of self-reported diabetes* among Asians aged ≥18 years — Behavioral Risk Factor Surveillance System, United States, 2011–2014†
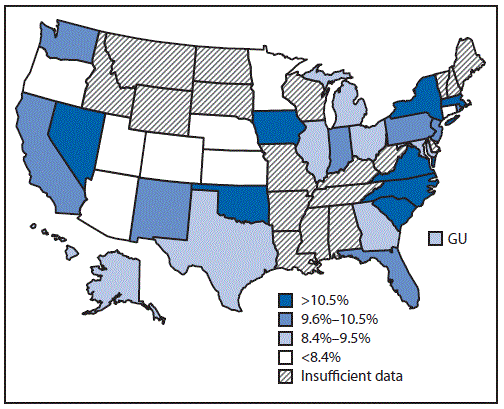
Abbreviation: GU = Guam.
* Answered "yes" to the question, "Have you ever been told by a doctor that you have diabetes?"
† Data were age-adjusted using the 2000 U.S. standard population.
Alternate Text: The figure above is of a map of the United States showing the prevalence of self-reported diabetes among Asians aged ≥18 years in the United States during 2011–2014.
Use of trade names and commercial sources is for identification only and does not imply endorsement by the U.S. Department of
Health and Human Services.
References to non-CDC sites on the Internet are
provided as a service to MMWR readers and do not constitute or imply
endorsement of these organizations or their programs by CDC or the U.S.
Department of Health and Human Services. CDC is not responsible for the content
of pages found at these sites. URL addresses listed in MMWR were current as of
the date of publication.
All MMWR HTML versions of articles are electronic conversions from typeset documents.
This conversion might result in character translation or format errors in the HTML version.
Users are referred to the electronic PDF version (http://www.cdc.gov/mmwr)
and/or the original MMWR paper copy for printable versions of official text, figures, and tables.
An original paper copy of this issue can be obtained from the Superintendent of Documents, U.S.
Government Printing Office (GPO), Washington, DC 20402-9371;
telephone: (202) 512-1800. Contact GPO for current prices.
**Questions or messages regarding errors in formatting should be addressed to
mmwrq@cdc.gov.
