Cigarette, Cigar, and Marijuana Use Among High School Students — United States, 1997–2013
, PhD1; , MPH1; , DMD1; , PhD, JD2; , ScD1; , PhD1; , PhD1; , MPH1; , MD1
Since 2010, the proportion of U.S. 12th grade students who used marijuana during the preceding 30 days (21.4%) has surpassed the proportion who used cigarettes (19.2%).* Negative outcomes associated with cigarette and marijuana use include addiction to one or both substances and diminished cognitive function, which can lead to lower academic achievement (1,2). Moreover, concurrent use of tobacco and marijuana could thwart prevention and cessation efforts for both products (1). CDC analyzed data from the 1997–2013 national Youth Risk Behavior Surveys (YRBS) among U.S. non-Hispanic white (white), non-Hispanic black (black), and Hispanic students in grades 9–12 to examine trends in the prevalence of current 1) exclusive cigarette or cigar use, 2) exclusive marijuana use, and 3) any use of the three products. CDC further examined the prevalence of current marijuana use among current users of cigarettes or cigars. During 1997–2013, exclusive cigarette or cigar use declined overall by 64%, from 20.5% to 7.4% (p<0.01). However, exclusive marijuana use more than doubled overall from 4.2% to 10.2% (p<0.01). Any cigarette, cigar, or marijuana use decreased overall from 46.1% to 29.9% (p<0.01), whereas marijuana use among cigarette or cigar users increased from 51.2% to 62.4%. Considerable increases were identified among black and Hispanic students toward the end of the study period for exclusive marijuana use and marijuana use among cigarette or cigar users. Increased exclusive marijuana use and use of marijuana among cigarette or cigar users could undermine success in reducing tobacco use among youths. Closer collaboration between public health professionals to address prevention of tobacco and marijuana use might be beneficial in the development of evidence-based policies and programs to prevent tobacco and marijuana use.
The national YRBS is a biennial cross-sectional survey of U.S. public and private school students in grades 9–12, administered in a classroom setting using a paper and pencil questionnaire. CDC examined trends in the prevalence of current 1) exclusive use of cigarettes or cigars; 2) exclusive use of marijuana; and 3) any use of cigarettes, cigars, or marijuana among white, black, and Hispanic students. CDC also examined the prevalence of current marijuana use among current users of cigarettes or cigars. Records with missing data for cigarette use, cigar use, marijuana use, race/ethnicity, or sex, were excluded from the analysis. The analytic data set was further restricted to students self-identifying as black, white, or Hispanic, resulting in final analytic sample sizes ranging from 11,050 (2013) to 13,242 (2009).†
Current use was defined as smoking cigarettes or cigars on ≥1 days, or using marijuana one or more times, during the 30 days preceding the survey.§ Exclusive cigarette or cigar use was defined as current use of cigarettes or cigars, but not marijuana. Exclusive marijuana use was defined as current use of marijuana, but not cigarettes or cigars. Any cigarette, cigar, or marijuana use was defined as current use of any of the three products. Among current cigarette or cigar users, the proportion of current marijuana users was assessed. Trends in exclusive cigarette or cigar use, exclusive marijuana use, any use of these products, and marijuana use among current cigarette or cigar users, were assessed among all students in the analytic sample overall, by sex, and by race/ethnicity. Data were assessed for the presence of linear trends using logistic regression analyses that adjusted for race/ethnicity, sex, and grade; p<0.05 was used to determine statistical significance. A significant linear trend indicated an overall increase or decrease during the study period. Data also were assessed for the presence of quadratic trends. A significant quadratic trend indicated a leveling off or change in direction of a trend line. Logistic regression models testing trends for students overall controlled for race/ethnicity, sex, and grade. Models among racial/ethnic subgroups controlled for sex and grade, models for sex subgroups controlled for race/ethnicity and grade. When a significant quadratic trend was found, Joinpoint software¶ was used to identify the year in which the leveling off or change in direction occurred. Then logistic regression analyses were used to assess the presence of a significant linear trend in each segment.
During 1997–2013, linear decreases occurred in exclusive cigarette or cigar use among students overall, and among all sex and racial/ethnic subgroups (p<0.01), with an overall percentage decrease of 64% (Table) (Figure 1). Linear increases occurred in exclusive marijuana use among students overall, and among all sex and racial/ethnic subgroups, with an overall increase from 4.2% to 10.2% (p<0.01) (Table). In addition, quadratic trends in exclusive marijuana use were identified among black and Hispanic students (p<0.01). Among black and Hispanic students, exclusive marijuana use did not change from 1997 to 2009 (9.2% to 10.9% and 5.9% to 8.5%, respectively), but increased from 2009 to 2013 (10.9% to 16.6% and 8.5% to 14.2%, respectively).
Linear decreases and quadratic trends occurred in any cigarette, cigar, or marijuana use among students overall, and among all sex and racial /ethnic subgroups (p<0.01) (Table). Among students overall, any cigarette, cigar, or marijuana use decreased from 1997 to 2007 (46.1% to 29.8%), but did not change from 2007 to 2013 (29.8% to 29.9%). Among white students, any cigarette, cigar, or marijuana use decreased from 1997 to 2005 (48.0% to 34.1%), and then decreased more gradually from 2005 to 2013 (34.1% to 29.8%). Among black students, any cigarette, cigar, or marijuana use decreased from 1997 to 2007 (38.3% to 25.0%), and then increased from 2007 to 2013 (25.0% to 30.0%); whereas, among Hispanic students, any cigarette, cigar, or marijuana use decreased from 1997 to 2007 (43.4% to 26.0%), and then did not change from 2007 to 2013 (26.0% to 30.1%).
During 1997–2013, linear increases occurred in the proportion of cigarette or cigar users who used marijuana among students overall (51.2% to 62.4%), and among all sex and racial/ethnic subgroups (p for trend <0.01) (Figure 2). In addition, a quadratic trend was identified among black and Hispanic students (p<0.01). Among cigarette or cigar users, use of marijuana did not change among black students from 1997 to 2009 (63.7% to 66.4%) or Hispanic students from 1997 to 2007 (58.6% to 54.9%), but increased among black students from 2009 to 2013 (66.4% to 82.0%) and among Hispanic students from 2007 to 2013 (54.9% to 73.6%).
Discussion
From 1997 to 2013, a 64% percent decrease occurred in the percentage of U.S. white, black, and Hispanic high school students overall who used cigarettes or cigars exclusively. Additionally, among white students, any cigarette, cigar, or marijuana use decreased during the study period. Among black and Hispanic students, any cigarette, cigar, or marijuana use decreased from 1997 to 2007, but increased among black students from 2007 to 2013, and did not change for Hispanics from 2007 to 2013. Moreover, the percentage of white, black, and Hispanic students overall who were exclusive marijuana users more than doubled, and marijuana use among cigarette or cigar users also increased, with substantial increases identified among black and Hispanic students toward the end of the study period. Thus, public health advances in adolescent health resulting from lower cigarette and cigar use might be attenuated by increases in marijuana use, which vary by racial/ethnic subgroup.
Tobacco prevention and control strategies, including increasing tobacco product prices, adopting comprehensive smoke-free laws, and implementing national public education media campaigns, have influenced the reduction in youth cigarette smoking.** Increases in marijuana use among U.S. youths might be attributable to decreasing perceptions of harm from 1991 to 2013 (from 78.6% to 39.5%).†† More specifically, decriminalization and legalization of recreational marijuana use in some states with minimal concomitant public health messaging to address potential detrimental health effects of marijuana use might be contributing to this perception (3). Further, legalization of medical marijuana use in 24 states, the District of Columbia, and Guam might increase perceptions of benefits of use, including that it is not harmful (4).§§
Public health concerns about the recreational use of marijuana among adolescents is related, in part, to the potential for harm to individual users and the potential for marijuana to be a "gateway" to the use of tobacco and other illicit drugs or substances (1). The amount of contaminants (e.g., tar and polycyclic aromatic hydrocarbons) inhaled from smoked marijuana can be more than double that of smoked tobacco (1). When marijuana is used concurrently with tobacco, the likelihood of individual-level harm, including cognitive, psychological, respiratory, and addiction problems, increases (1).
The findings in this report are subject to at least five limitations. First, marijuana, cigarette, and cigar use were self-reported and not confirmed with biochemical tests, so the extent of underreporting or overreporting is unknown. Second, YRBS did not measure hookah use, which is an increasing mode of combustible tobacco use among youths, independently associated with marijuana use, and as such may offset declines in cigarette or cigar use (5,6). Third, YRBS did not measure use of electronic nicotine delivery systems such as e-cigarettes, hookahs, and vape pens (portable devices that function like e-cigarettes, but permit the user to add dry herbs, oils, or waxes) that are capable of aerosolizing marijuana (5,7). Fourth, YRBS did not measure blunt use, a popular product among youths and young adults, in which some or most of the tobacco in a cigar is taken out and replaced by marijuana (8). Finally, these data apply only to white, black, and Hispanic youths who attended school and, therefore, are not representative of all persons in this age group. However, nationwide, in 2009, approximately 96% of persons aged 16–17 years were enrolled in a high school program (9).
Reducing current use of cigarettes, cigars, and marijuana among U.S. youths might be achieved through multifaceted, targeted implementation of evidence-based program and policy interventions, in concert with active engagement of multiple stakeholders, including parents, schools, communities, and the media (10). Enhanced and sustained tobacco and marijuana use surveillance can help in monitoring trends and patterns of use, including the measurement of progress toward achieving Healthy People 2020 objectives¶¶ related to the use of these substances among youth. Policy and programmatic efforts might benefit from approaches that focus on reducing the use of tobacco and marijuana among youth.
1Office on Smoking and Health, National Center for Chronic Disease Prevention and Health Promotion, CDC; 2Division of Adolescent and School Health, National Center for HIV/AIDS, Viral Hepatitis, STD, and TB Prevention, CDC.
Corresponding author: Italia Rolle, itr2@cdc.gov, 770-488-1134.
References
- Agrawal A, Budney AJ, Lynskey MT. The co-occurring use and misuse of cannabis and tobacco: a review. Addiction 2012;107:1221–33.
- Stiby AI, Hickman M, Munafo MR, Heron J, Yip VL, Macleod J. Adolescent cannabis and tobacco use and educational outcomes at age 16: birth cohort study. Addiction 2015;110:658–68.
- Committee on Substance Abuse, Committee on Adolescence. The impact of marijuana policies on youth: clinical, research, and legal update. Pediatrics 2015;135:584–7.
- Palamar JJ, Ompad DC, Petkova E. Correlates of intentions to use cannabis among US high school seniors in the case of cannabis legalization. Int J Drug Policy 2014;25:424–35.
- Arrazola RA, Singh T, Corey CG, et al. Tobacco use among middle and high school students—United States, 2011–2014. MMWR Morb Mortal Wkly Rep 2015;64:381–5.
- Palamar JJ, Zhou S, Sherman S, Weitzman M. Hookah use among US high school seniors. Pediatrics 2014;134:227–34.
- Malouff JM, Rooke SE, Copeland J. Experiences of marijuana-vaporizer users. Subst Abus 2014;35:127–8.
- Jones PR, Cohen MZ, McIlvain HE, Siahpush M, Scott A, Okafor K. Smoking in young adult African Americans. J Adv Nurs 2014;70:1117–27.
- Chapman C, Laird J, Ifill N, KewalRamani A. Trends in high school dropout and completion rates in the United States: 1972–2009 (NCES 2012–006). Washington, DC: National Center for Education Statistics, US Department of Education; 2011. Available at http://nces.ed.gov/pubs2012/2012006.pdf.
- Ehrenreich H, Nahapetyan L, Orpinas P, Song X. Marijuana use from middle to high school: co-occurring problem behaviors, teacher-rated academic skills and sixth-grade predictors. J Youth Adolesc 2014;44:1929–40.
* Additional information available at http://www.monitoringthefuture.org/data/14data.html.
† In each survey year, a similar independent three-stage cluster sample design was used to obtain a nationally representative sample of public and private school students in grades 9–12 in the 50 states and the District of Columbia. During 1997–2013, total sample sizes and overall response rates (the product of the school and student response rate) for each survey year were as follows: 1997 (16,262; response rate = 69%); 1999 (15,349; 66%); 2001 (13,601; 63%); 2003 (15,214; 67%); 2005 (13,917; 67%); 2007 (14,041 ; 68%); 2009 (16,410; 71%); 2011 (15,425; 71%); 2013 (13,583; 68%). This analysis was restricted to non-Hispanic white, non-Hispanic black, and Hispanic students because of previously reported differences in the use of cigarettes, cigars, and marijuana by these groups.
§ Current use of cigarettes, cigars, or marijuana was assessed with the following respective questions: "During the past 30 days, on how many days did you smoke cigarettes?" "During the past 30 days, on how many days did you smoke any cigars, cigarillos, or little cigars?" and "During the past 30 days, how many times did you use marijuana?" Respondents with missing data for cigarette, cigar, or marijuana use questions were excluded from the analysis (9%).
¶ National Cancer Institute. Joinpoint regression program, 2013. Additional information available at http://surveillance.cancer.gov/joinpoint.
** Additional information available at http://www.cdc.gov/tobacco/stateandcommunity/best_practices/.
†† Additional information available at http://www.monitoringthefuture.org/pubs/monographs/mtf-overview2013.pdf.
§§ Additional information available at http://www.ncsl.org/research/health/state-medical-marijuana-laws.aspx.
¶¶ Available at http://www.healthypeople.gov/2020/topics-objectives.
Summary
What is already known on this topic?
Since 2010, the proportion of U.S. 12th grade students who reported using marijuana during the preceding 30 days (21.4%) has surpassed the proportion reporting use of cigarettes during the preceding 30 days (19.2%).
What is added by this report?
During 1997–2013, the proportion of white, black, and Hispanic high school students overall who were exclusive cigarette or cigar users decreased 64%, from 20.5% to 7.4%. The proportion of white, black, and Hispanic students who were exclusive marijuana users more than doubled from 4.2% to 10.2%, and among cigarette or cigar users, marijuana use increased, with considerable increases identified among black and Hispanic students toward the end of the study period.
What are the implications for public health practice?
Despite significant declines since 1997, approximately 30% of white, black, and Hispanic U.S. high school students were current users of cigarettes, cigars, or marijuana in 2013. Policy and programmatic efforts might benefit from integrated approaches that focus on reducing the use of tobacco and marijuana among youths.
|
TABLE. (Continued) Prevalence of exclusive cigarette or cigar use*; exclusive marijuana use†; any cigarette, cigar, or marijuana use§; and marijuana use among high school students¶ who used cigarettes or cigars during the 30 days preceding the surveys, by sex and selected race/ethnicity — National Youth Risk Behavior Surveys, United States, 1997–2013 |
|||||
|---|---|---|---|---|---|
|
Sex/Race/Ethnicity |
2005 |
2007 |
2009 |
2011 |
2013 |
|
% (95% CI) |
% (95% CI) |
% (95% CI) |
% (95% CI) |
% (95% CI) |
|
|
Exclusive cigarette or cigar use |
|||||
|
Total |
12.3 (10.9–13.9) |
10.6 (9.2–12.1) |
10.2 (8.8–11.8) |
8.4 (7.5–9.5) |
7.4 (6.0–9.1)** |
|
Sex |
|||||
|
Male |
13.2 (11.6–15.0) |
11.6 (9.7–13.9) |
10.7 (9.0–12.7) |
9.0 (7.9–10.3) |
8.4 (6.7–10.4)** |
|
Female |
11.4 (9.9–13.1) |
9.5 (8.3–10.8) |
9.7 (8.5–11.0) |
7.9 (6.7–9.2) |
6.5 (5.1–8.2)** |
|
Race/Ethnicity |
|||||
|
White, non-Hispanic |
14.3 (12.5–16.4) |
12.5 (10.9–14.2) |
12.4 (10.5–14.6) |
10.0 (8.8–11.3) |
9.8 (8.0–11.9)** |
|
Black, non-Hispanic |
5.9 (4.8–7.3) |
4.6 (3.5–6.1) |
5.1 (3.9–6.7) |
3.5 (2.5–4.9) |
2.4 (1.6–3.5)** |
|
Hispanic |
9.3 (7.7–11.2) |
8.6 (6.8–11.0) |
6.9 (5.7–8.3) |
7.1 (5.8–8.6) |
4.2 (3.1–5.7)** |
|
Exclusive marijuana use |
|||||
|
Total |
5.6 (4.9–6.5) |
5.9 (4.9–7.0) |
7.0 (6.1–8.0) |
8.8 (7.7–10.0) |
10.2 (8.6–12.0)** |
|
Sex |
|||||
|
Male |
6.2 (5.2–7.4) |
6.4 (5.5–7.5) |
7.7 (6.9–8.7) |
9.1 (7.9–10.4) |
10.3 (8.8–11.9)** |
|
Female |
5.1 (4.2–6.1) |
5.3 (4.1–6.8) |
6.2 (5.1–7.5) |
8.4 (7.1–9.9) |
10.1 (8.3–12.3)** |
|
Race/Ethnicity |
|||||
|
White, non-Hispanic |
4.5 (3.6–5.6) |
4.8 (3.8–6.0) |
5.6 (4.6–6.8) |
7.1 (5.8–8.7) |
7.1 (5.6–9.0)** |
|
Black, non-Hispanic |
9.6 (8.1–11.3) |
9.5 (7.5–12.1) |
10.9 (8.8–13.4) |
13.2 (11.6–14.9) |
16.6 (14.9–18.5)**†† |
|
Hispanic |
7.2 (5.9–8.6) |
6.8 (5.7–8.3) |
8.5 (7.3–9.9) |
10.8 (9.2–12.6) |
14.2 (12.4–16.2)**†† |
|
Any cigarette or cigar or marijuana use |
|||||
|
Total |
32.4 (29.9–35.1) |
29.8 (27.4–32.3) |
30.5 (28.9–32.2) |
30.4 (28.7–32.1) |
29.9 (27.6–32.2)**†† |
|
Sex |
|||||
|
Male |
34.8 (32.2–37.6) |
33.7 (30.5–37.0) |
33.4 (31.3–35.5) |
33.8 (31.8–35.8) |
32.7 (30.5–35.1)**†† |
|
Female |
30.0 (27.2–33.0) |
25.9 (23.6–28.4) |
27.4 (25.5–29.4) |
26.8 (24.7–29.0) |
27.1 (24.4–29.9)**†† |
|
Race/Ethnicity |
|||||
|
White, non-Hispanic |
34.1 (30.8–37.5) |
31.9 (29.1–34.8) |
32.3 (30.1–34.5) |
31.1 (28.9–33.3) |
29.8 (26.7–33.0)**†† |
|
Black, non-Hispanic |
25.5 (23.1–28.1) |
25.0 (22.1–28.2) |
26.2 (23.4–29.1) |
28.0 (24.9–31.3) |
30.0 (27.1–33.0)**†† |
|
Hispanic |
31.4 (28.1–34.9) |
26.0 (22.3–30.1) |
27.9 (25.4–30.5) |
29.7 (27.0–32.7) |
30.1 (26.7–33.7)**†† |
|
Marijuana use among cigarette or cigar users |
|||||
|
Total |
54.1 (51.2–56.9) |
55.8 (51.9–59.6) |
56.6 (52.4–60.6) |
60.9 (57.2–64.5) |
62.4 (57.5–67.1)** |
|
Sex |
|||||
|
Male |
54.0 (50.2–57.7) |
57.2 (52.8–61.5) |
58.2 (53.0–63.3) |
63.5 (59.0–67.8) |
62.8 (56.8–68.5)** |
|
Female |
54.2 (50.3–58.0) |
53.9 (49.6–58.1) |
54.3 (50.6–58.0) |
57.3 (52.4–62.0) |
61.9 (56.0–67.6)** |
|
Race/Ethnicity |
|||||
|
White, non-Hispanic |
51.6 (48.6–54.6) |
54.0 (49.5–58.5) |
53.6 (48.6–58.4) |
58.4 (53.8–62.8) |
56.7 (51.3–62.0)** |
|
Black, non-Hispanic |
62.9 (56.0–69.3) |
70.5 (64.5–75.8) |
66.4 (59.3–72.9) |
76.2 (69.2–82.0) |
82.0 (76.0–86.7)**†† |
|
Hispanic |
61.6 (56.6–66.4) |
54.9 (49.3–60.3) |
64.4 (59.1–69.5) |
62.6 (57.7–67.3) |
73.6 (68.1–78.4)**†† |
|
Abbreviation: CI = confidence interval. * Used cigarettes or cigars on one or more days, but did not use marijuana during the 30 days preceding the surveys. † Used marijuana one or more times, but did not use cigarettes or cigars during the 30 days preceding the surveys. § Used cigarettes or cigars on one or more days, or used marijuana one or more times during the 30 days preceding the surveys. ¶ Students with missing data for cigarette use, cigar use, marijuana use, or sex and students who did not self-identify as non-Hispanic black, non-Hispanic white, or Hispanic were excluded from the analysis. ** Significant linear trend during 1997–2013 (p<0.01). †† Significant quadratic trend during 1997–2013 (p<0.01). |
|||||
FIGURE 1. Prevalence of exclusive cigarette or cigar use,*† exclusive marijuana use,†§ and any cigarette, cigar, or marijuana use†¶** among high school students†† during the 30 days preceding the surveys — National Youth Risk Behavior Surveys, United States, 1997–2013
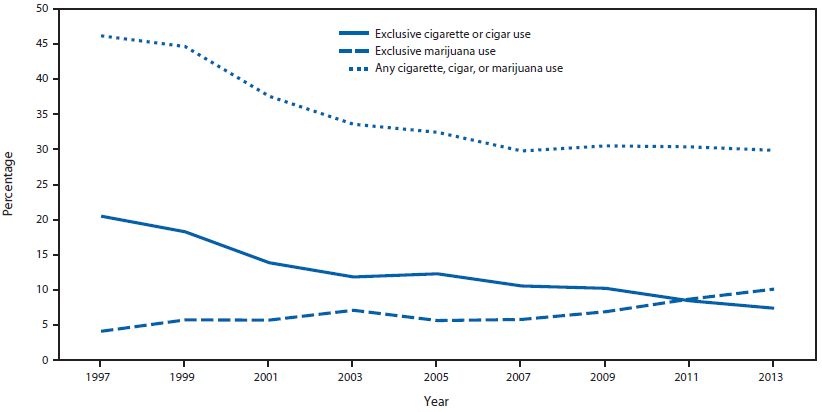
* Used cigarettes or cigars on one or more days, but did not use marijuana during the 30 days preceding the survey.
† Significant linear trend during 1997–2013 (p<0.01).
§ Used marijuana one or more times, but did not use cigarettes or cigars during the 30 days preceding the survey.
¶ Significant quadratic trend during 1997–2013 (p<0.01).
** Used cigarettes or cigars on one or more days, or used marijuana one or more times during the 30 days preceding the survey.
†† Students with missing data for cigarette use, cigar use, marijuana use, or sex and students who did not self-identify as non-Hispanic black, non-Hispanic white, or Hispanic were excluded from the analysis.
Alternate Text: The figure above is a line chart showing the prevalence of exclusive cigarette or cigar use, exclusive marijuana use, and any cigarette, cigar, or marijuana use among high school students during the 30 days preceding the surveys in the United States during 1997-2013.
FIGURE 2. Prevalence of current marijuana use* among white, black, and Hispanic high school students† who were current cigarette or cigar users§ — National Youth Risk Behavior Surveys,¶ United States, 1997–2013
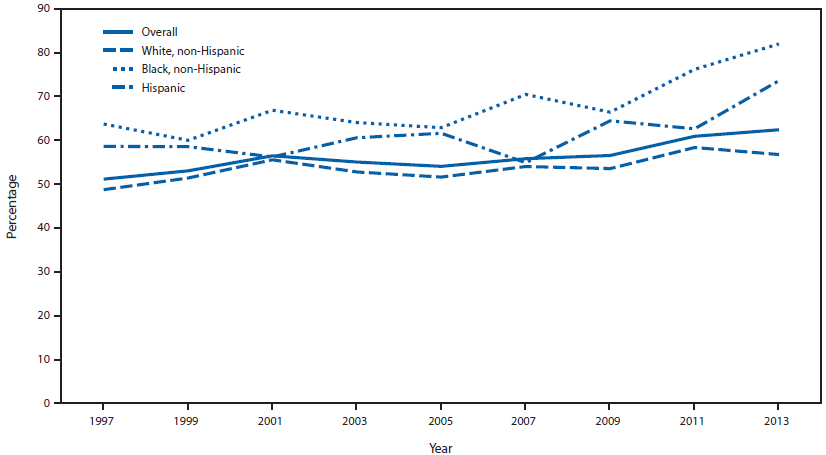
* Used marijuana one or more times during the 30 days preceding the survey.
† Students with missing data for cigarette use, cigar use, marijuana use, or sex and students who did not self-identify as non-Hispanic black, non-Hispanic white, or Hispanic were excluded from the analysis.
§ Used cigarettes or cigars on one or more days during the 30 days preceding the survey.
¶ Significant linear trends were identified for all groups (p<0.01), and significant quadratic trends were identified among non-Hispanic black and Hispanic students (p<0.01) during 1997–2013.
Alternate Text: The figure above is a line chart showing the prevalence of current marijuana use among white, black, and Hispanic high school students who were current cigarette or cigar users in the United States during 1997-2013.
Use of trade names and commercial sources is for identification only and does not imply endorsement by the U.S. Department of
Health and Human Services.
References to non-CDC sites on the Internet are
provided as a service to MMWR readers and do not constitute or imply
endorsement of these organizations or their programs by CDC or the U.S.
Department of Health and Human Services. CDC is not responsible for the content
of pages found at these sites. URL addresses listed in MMWR were current as of
the date of publication.
All MMWR HTML versions of articles are electronic conversions from typeset documents.
This conversion might result in character translation or format errors in the HTML version.
Users are referred to the electronic PDF version (http://www.cdc.gov/mmwr)
and/or the original MMWR paper copy for printable versions of official text, figures, and tables.
An original paper copy of this issue can be obtained from the Superintendent of Documents, U.S.
Government Printing Office (GPO), Washington, DC 20402-9371;
telephone: (202) 512-1800. Contact GPO for current prices.
**Questions or messages regarding errors in formatting should be addressed to
mmwrq@cdc.gov.
