Establishment of an Ebola Treatment Unit and Laboratory — Bombali District, Sierra Leone, July 2014–January 2015
, MD1; , MD2; , MD3,4; , MD5; 5; , MD6; 6; , MD6; , PhD3,7; , PhD3,8; , PhD9; 10; 3; , MD1; 11
The first confirmed case of Ebola virus disease (Ebola) in Sierra Leone related to the ongoing epidemic in West Africa occurred in May 2014, and the outbreak quickly spread (1). To date, 8,704 Ebola cases and 3,955 Ebola deaths have been confirmed in Sierra Leone (2). The first Ebola treatment units (ETUs) in Sierra Leone were established in the eastern districts of Kenema and Kailahun, where the first Ebola cases were detected, and these districts were also the first to control the epidemic (3). By September and October 2014, districts in the western and northern provinces, including Bombali, had the highest case counts, but additional ETUs outside of the eastern province were not operational for weeks to months (3). Bombali became one of the most heavily affected districts in Sierra Leone, with 873 confirmed patients with Ebola during July–November 2014.* The first ETU and laboratory in Bombali District were established in late November and early December 2014, respectively. To evaluate the impact of the first ETU and laboratory becoming operational in Bombali on outbreak control, the Bombali Ebola surveillance team assessed epidemiologic indicators before and after the establishment of the first ETU and laboratory in Bombali. After the establishment of the ETU and laboratory, the interval from symptom onset to laboratory result† and from specimen collection to laboratory result decreased. By providing treatment to Ebola patients and isolating contagious persons to halt ongoing community transmission, ETUs play a critical role in breaking chains of transmission and preventing uncontrolled spread of Ebola (4). Prioritizing and expediting the establishment of an ETU and laboratory by pre-positioning resources needed to provide capacity for isolation, testing, and treatment of Ebola are essential aspects of pre-outbreak planning.
Before the establishment of an ETU in Bombali, patient transfer to an ETU typically did not occur until there was laboratory confirmation of Ebola. ETUs in other districts were often filled to capacity, so patients in Bombali had to wait in holding centers, which had limited capacity to isolate patients (5), until ETU beds in other districts became available. Ebola patients traveled 214–285 miles (344–459 km) from Bombali's holding centers (at least four hours by ambulance) to the nearest ETU in Kenema or Kailahun. Additionally, the closest laboratory was >100 miles (>161 km) away (a 3–4 hour drive), and samples were only taken to the laboratory once each day. Delays in diagnosis, isolation and treatment (measured by analyzing variables in the Ebola database managed by the Bombali surveillance team) decreased chances of survival (6) and delayed the institution of outbreak control measures. In 2012, CDC developed the viral hemorrhagic fever (VHF) tool, which runs on the Epi Info software platform to collect, manage, and analyze epidemiologic and laboratory data on outbreaks of viral hemorrhagic fevers, including Ebola (additional information available at https://epiinfovhf.codeplex.com/). VHF is used in Sierra Leone as an Ebola database to manage data from Ebola case investigation forms, line lists of contacts for Ebola cases, and laboratory results; Bombali was one of the first districts in Sierra Leone to analyze Ebola outbreak data in realtime using VHF.
In September 2014, Bombali Ministry of Health and Sanitation (MoHS) staff, in collaboration with epidemiologists from CDC and the World Health Organization, began using data from Bombali's VHF database to assess timeliness of outbreak control, document changes in performance over time, identify gaps in response measures, and recommend action steps. The number of newly identified confirmed Ebola cases per week was calculated, plus the intervals from 1) symptom onset to case investigation, 2) symptom onset to patient isolation in an ETU or holding center, 3) symptom onset to laboratory result, 4) patient isolation to laboratory result, and 5) specimen collection to laboratory result. Records of patients with symptom onset during July 1–November 17, 2014, were analyzed to evaluate the timeframe before the establishment of the first ETU and laboratory in Bombali, and those with symptom onset dates during December 1, 2014–January 31, 2015 were analyzed to evaluate the period after ETU and laboratory establishment. Because the ETU became operational 2 weeks before the laboratory, records with reported symptom onset during November 18–30 were excluded from the time interval analysis, as were records with missing data elements that were components of the computed indicators.
Epidemiologic indicator means were calculated and compared by using two-sided t-tests with an alpha level of 0.05. The slope of the epidemic curve was analyzed by using Joinpoint software to identify statistically significant changes in trends over the course of the outbreak (7). Joinpoint software uses a regression model and permutation tests to fit the data starting with the minimum number of joinpoints, then testing for statistical significance of apparent trends by using an alpha-level of 0.05 when more joinpoints are added to the model (7).
The mean value for most indicators decreased after the first ETU and laboratory became operational in Bombali, demonstrating improvements in efforts to control the epidemic (Table). Improvements were seen in the mean interval from symptom onset to laboratory result, from specimen collection to laboratory result, from patient isolation to laboratory result, and from symptom onset to case investigation. The interval from symptom onset to isolation did not significantly change. Ebola weekly case counts by week of symptom onset decreased in late September (after a sharp increase beginning in the middle of the month) and again in late November to early December 2014 (Figure 1). Joinpoint analysis of the slope of the epidemic curve (Figure 2) demonstrated a statistically significant difference during the period after the first ETU and laboratory became operational compared with the preceding 9 weeks (p<0.01).
Discussion
Death from untreated Ebola occurs a mean of 7.5 days after symptom onset, underscoring the need for rapid response (8). Before the establishment of the ETU in Bombali, specimen collection occurred at holding centers throughout the district and relied on availability of a laboratory technician and transport of the specimen to a laboratory, often by motorbike. Delay in receipt of laboratory results hindered the transfer of ill patients to ETUs, so patients waited in overcrowded holding facilities, which only accommodated separation of patients into groups based on confirmed, negative, and pending Ebola laboratory results (4). In addition, a single water supply for bathing and laundry contributed additional risks for exposure and transmission in certain holding centers. Before the ETU and laboratory opened in Bombali, the mean interval of 7.3 days from symptom onset to laboratory result meant infectious patients often were in the final stages of illness before an Ebola diagnosis was confirmed. Patients with Ebola are more infectious in late stages of illness (9), so rapid testing and appropriate isolation are essential to outbreak control. After the laboratory opened, testing capacity within the district allowed at least two specimen batches to be tested each day, and the interval from specimen collection to laboratory results decreased from 2.5 to 1.2 days (Table).
The weekly Ebola case count in Bombali decreased after establishment of the ETU (Figure 1). Multiple other public health interventions were implemented during September–December 2014, which might have contributed to reduced Ebola case counts in Bombali. Interventions included increased access to ambulances, fuel, and food for affected communities; increased human resources engaged in response efforts; community education; and consistent messaging through radio shows and advertisements. Beyond this, there was improved surveillance, case investigation, contact tracing and monitoring; better managed quarantine; survivors' involvement in the response; and improved infection prevention and control practices in health care facilities. Finally, a military command center was created and interactions improved between health educators, contact tracers, and the community.
The findings in this report are subject to at least three limitations. First, VHF data on patient outcome were often missing, especially during the early months of the epidemic. Therefore, it was not possible to correlate survival with establishment of the ETU and laboratory in Bombali. Second, because the VHF application does not capture information on burials performed by trained burial teams or quarantine, VHF could not be used to monitor the impact of safe medical burials or quarantine on the outbreak. Finally, because multiple public health interventions were performed simultaneously during this epidemic, it is not possible to know the independent contribution of each.
The findings are consistent with other investigations that highlight the importance of rapid case identification and isolation (1,10). The World Health Organization has identified prompt detection and treatment of Ebola as key objectives of the outbreak response (10). Establishment of ETUs and laboratories at the onset of an Ebola outbreak in conjunction with other well-established control measures might prevent rapid increase in the number of Ebola cases and thereby contribute to outbreak control. An ETU and laboratory were not available during the first 5 months of the outbreak in Bombali, so emergency response planning for Ebola outbreaks might benefit from pre-positioning of resources to expedite operationalization of facilities that can accommodate Ebola testing, isolation, and treatment.
Acknowledgments
William Bower, Farah Husain, Sara Hersey, Ginger Chew, and the Bombali Surveillance Team of the Ministry of Health and Sanitation for Sierra Leone, Freetown.
1Epidemic Intelligence Service, CDC; 2Office of Public Health Preparedness and Response, CDC; 3Center for Global Health, CDC; 4CDC Zimbabwe; 5Sierra Leone Ministry of Health and Sanitation, Bombali District; 6Ebola Response Bombali District, World Health Organization; 7CDC Namibia; 8CDC Tanzania; 9Center for Surveillance, Epidemiology and Laboratory Services, CDC; 10National Center for Immunization and Respiratory Disease, CDC; 11African Union.
Corresponding author: Brigette Gleason, yer7@cdc.gov, 804-864-7264.
References
- Dixon MG, Schafer IJ. Ebola viral disease outbreak—West Africa, 2014. MMWR Morb Mortal Wkly Rep 2014;63:548–51.
- CDC. 2014 Ebola outbreak in West Africa—case counts. Atlanta, GA: US Department of Health and Human Services, CDC; 2014. Available at http://www.cdc.gov/vhf/ebola/outbreaks/2014-west-africa/case-counts.html.
- World Health Organization. Ebola response roadmap situation report: 1 October 2014. Available at http://reliefweb.int/sites/reliefweb.int/files/resources/roadmapsitrep_1Oct2014_eng.pdf.
- Medecins Sans Frontieres. MSF opens new Ebola treatment centers in Sierra Leone to increase access to care. Available at http://www.doctorswithoutborders.org/article/msf-opens-new-ebola-treatment-centers-sierra-leone-increase-access-care.
- Pathmanathan I, O'Connor KA, Adams ML, et al. Rapid assessment of Ebola infection prevention and control needs—six districts, Sierra Leone, October 2014. MMWR Morb Mortal Wkly Rep 2014;63:1172–4.
- Fowler RA, Fletcher T, Fischer WA 2nd, et al. Caring for critically ill patients with Ebola virus disease. Perspectives from West Africa. Am J Respir Crit Care Med 2014;190:733–7.
- National Cancer Institute. Joinpoint Regression Program, Version 4.2.0. Washington, DC: National Institutes of Health, National Cancer Institute; 2015.
- CDC. Ebola virus disease information for clinicians in U.S healthcare settings. Atlanta, GA: US Department of Health and Human Services, CDC; 2015. Available at http://www.cdc.gov/vhf/ebola/hcp/clinician-information-us-healthcare-settings.html.
- Osterholm MT, Moore KA, Kelley NS, et al. Transmission of Ebola viruses: what we know and what we do not know. MBio 2015;6:e00137–15.
- World Health Organization. Ebola response roadmap. WHO/EVD/Roadmap/14.1. Available at http://apps.who.int/iris/bitstream/10665/131596/1/EbolaResponseRoadmap.pdf.
* On the basis of data in the viral hemorrhagic fever database for Sierra Leone, which is managed by the Sierra Leone Ministry of Health and Sanitation and CDC Data Team in Sierra Leone. Weekly updated sync files are shared among stakeholders of the Ebola Emergency.
† Refers to when the laboratory result was available to the Sierra Leone Ministry of Health and Sanitation.
Summary
What is already known on this topic?
Many areas of West Africa have successfully controlled the Ebola outbreak at a local level through interventions, including establishment of laboratories and Ebola treatment units (ETUs) for testing and treating Ebola. Bombali was among the hardest hit districts in Sierra Leone during the Ebola epidemic, but outbreak control was achieved.
What is added by this report?
Data from the viral hemorrhagic fever (VHF) database demonstrated measurable improvements in timeliness of Ebola control measures in Bombali after the establishment of a local ETU and laboratory amidst ongoing community interventions. After establishment of the ETU and laboratory in Bombali, statistically significant reductions in the mean interval from symptom onset to laboratory result, from specimen collection to laboratory result, from patient isolation to laboratory result, and from symptom onset to case investigation were noted.
What are the implications for public health practice?
The VHF database can be used to analyze epidemiologic indicators both in real time and longitudinally to guide Ebola response efforts. Pre-positioning of laboratory capacity and health facilities that can be used for Ebola testing, isolation, and treatment during an outbreak might hasten outbreak control.
FIGURE 1. Number of confirmed cases of Ebola virus disease (Ebola) and establishment of first Ebola treatment unit, by week of symptom onset and key milestones* — Bombali District, Sierra Leone, June 29, 2014–January 31, 2015
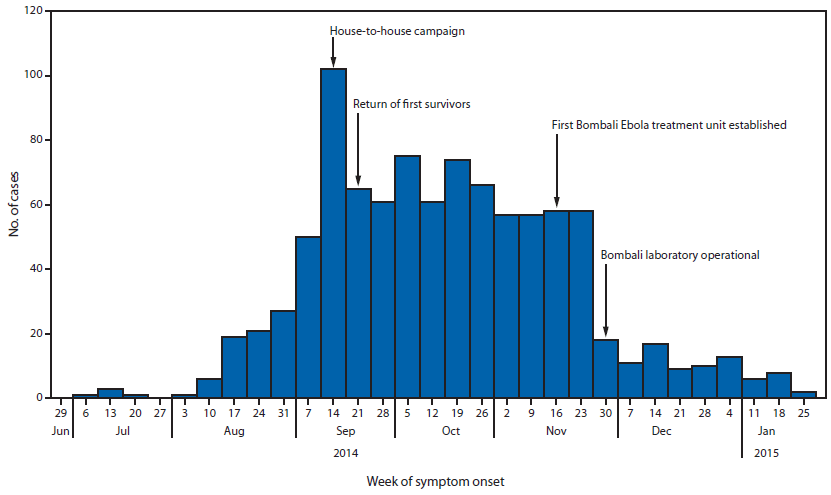
* The house-to-house campaign during September 19–21, 2014, was organized by the Ministry of Health and Sanitation of Sierra Leone so that public health workers could visit every household in the country to educate residents about Ebola and to conduct active case finding. The return of the first survivors to Bombali on September 25, 2014, led to their participation in media messaging to promote the ideas that "Ebola is real" and that survival is possible if care is sought early.
Alternate Text:The figure above is a bar chart showing confirmed cases of Ebola virus disease, by week of symptom onset and key milestones in the Bombali District of Sierra Leone during June 29, 2014-January 31, 2015.
FIGURE 2. Joinpoint analysis of the slope of the Ebola epidemiologic curve of the number of cases for the weeks September 21, 2014 (week 0) through January 31, 2015 (week 17) — Bombali District, Sierra Leone*
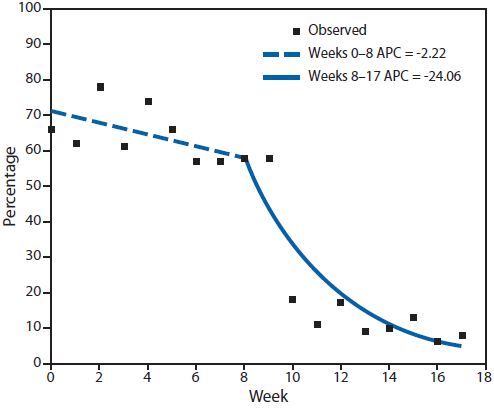
Abbreviation: APC = annual percentage change.
* The Bombali Ebola treatment unit opened on November 17, 2014 (week 8) and admitted the first seven confirmed patients on November 24 (week 9). The laboratory became operational on December 8, 2014 (week 11).
Alternate Text: The figure above is a line chart showing joinpoint analysis of the slope of the Ebola epidemiologic curve of the number of cases for the weeks September 21, 2014 (week 0) through January 31, 2015 (week 17) in the Bombali District of Sierra Leone.
Use of trade names and commercial sources is for identification only and does not imply endorsement by the U.S. Department of
Health and Human Services.
References to non-CDC sites on the Internet are
provided as a service to MMWR readers and do not constitute or imply
endorsement of these organizations or their programs by CDC or the U.S.
Department of Health and Human Services. CDC is not responsible for the content
of pages found at these sites. URL addresses listed in MMWR were current as of
the date of publication.
All MMWR HTML versions of articles are electronic conversions from typeset documents.
This conversion might result in character translation or format errors in the HTML version.
Users are referred to the electronic PDF version (http://www.cdc.gov/mmwr)
and/or the original MMWR paper copy for printable versions of official text, figures, and tables.
An original paper copy of this issue can be obtained from the Superintendent of Documents, U.S.
Government Printing Office (GPO), Washington, DC 20402-9371;
telephone: (202) 512-1800. Contact GPO for current prices.
**Questions or messages regarding errors in formatting should be addressed to
mmwrq@cdc.gov.
