Estimated Lifetime Medical and Work-Loss Costs of Fatal Injuries — United States, 2013
, PhD1; , PhD2; , PhD3; , PhD,1; , PhD1
Injury-associated deaths have substantial economic consequences. In 2013, unintentional injury was the fourth leading cause of death, suicide was the tenth, and homicide was the sixteenth; these three causes accounted for approximately 187,000 deaths in the United States (1). To assess the economic impact of fatal injuries, CDC analyzed death data from the National Vital Statistics System (1) for 2013, along with cost of injury data using the Web-Based Injury Statistics Query and Reporting System (1). This report updates a previous study that analyzed death data from the year 2000 (2), and employs recently revised methodology for determining the costs of injury outcomes, which uses the most current economic data and incorporates improvements for estimating medical costs associated with injury (3). Number of deaths, crude and age-specific death rates, and total lifetime work-loss costs and medical costs were calculated for fatal injuries by sex, age group, intent (intentional versus unintentional), and mechanism of injury. During 2013, the rate of fatal injury was 61.0 per 100,000 population, with combined medical and work-loss costs exceeding $214 billion. Costs from fatal injuries represent approximately one third of the total $671 billion medical and work-loss costs associated with all injuries in 2013 (3). The magnitude of the economic burden associated with injury-associated deaths underscores the need for effective prevention.
The number of injury-associated deaths in the United States during 2013 was obtained from National Vital Statistics System, and lifetime costs were obtained from the Web-based Injury Statistics Query and Reporting System database (1). Injury death rates were calculated using the U.S. Census Bureau's bridged race population estimates for 2013. Lifetime cost estimates, which include lifetime work-loss and medical costs, were computed from average costs of earnings and treating injuries in 2010, adjusted to 2013 prices. For each death record, lifetime work-loss cost was assigned according to the sex and age of the decedent. The sex- and age-specific probability of surviving to a given age was multiplied by the mean earnings of persons of that sex and age using U.S. Census Bureau earnings data, assuming that no one would live beyond age 102 years. Lifetime medical costs were assigned by injury diagnosis and mechanism, place of death, and decedent's age (3). Medical costs were derived from various sources that measure the cost of transport, examination by a coroner or medical examiner, and health care in multiple settings, including emergency departments, hospitals, and nursing homes. Work-loss costs were developed using earnings data from the U.S. Census Bureau's Current Population Survey and life expectancy data from CDC's National Center for Health Statistics. Number of deaths, rates and total lifetime medical and work-loss costs were examined for 2013, stratified by sex, age, and intent of injury. The distribution of costs by mechanism and intent of injury was also examined for the five highest-cost mechanisms, stratified by intent.
The total estimated lifetime medical and work-loss costs associated with fatal injuries in 2013 was $214 billion (Table). Males accounted for approximately 78% of these costs and for 67% of injury deaths. Approximately two thirds of injury deaths were unintentional, and these deaths also represented a majority of the cost ($129.7 billion [61%]). Approximately one fifth of injury-related deaths were suicides, and the cost of these deaths ($50.8 billion) accounted for about 24% of all injury death costs. Approximately 8% of injury-related deaths were homicides, and the associated costs ($26.4 billion) accounted for about 12% of the medical and work-loss costs for all injury deaths. Male victims represented 82% of the costs for suicide ($41.7 billion) and 86% of the costs for homicide ($22.5 billion).
Overall, rates of fatal injury increased with age; however, this pattern differed by injury intent, with higher homicide rates among young persons and higher suicide rates among middle-aged adults. The costs associated with fatal injury were concentrated among adolescents and young adults aged 15–24 years and adults aged 25–64 years. The lowest costs and the lowest proportion of costs were associated with injury deaths in persons aged ≥65 years. These differences are also reflected in the mean cost of injury death by intent (Figure 1). The mean medical and work-loss cost of any injury death in 2013 was slightly more than $1.1 million, ranging from just below $1 million for unintentional injuries, to in excess of $1.6 million for homicides; the cost per suicide was $1.2 million.
Among all injury deaths, drug poisonings accounted for 26% of the costs associated with fatal injuries, followed by transportation-related deaths (23%), firearm-related deaths (22%), deaths from suffocation (9%), and deaths resulting from falls (5%) (Figure 2). Considerable differences were observed in the proportional distribution of costs accounted for by each mechanism among unintentional deaths, homicides, and suicides. Firearm-related fatal injuries accounted for 75% of the homicide-associated costs and 48% of the suicide-associated costs. Other leading mechanisms contributing to suicide costs were suffocation (including hanging) (29%) and drug poisoning (12%). Costs associated with unintentional injury deaths were primarily related to transportation-related deaths (37%) and drug poisonings (38%).
Discussion
Fatal injuries have a profound effect on victim's families and society in general. These deaths also have substantial medical and work-loss costs. Implementing effective prevention strategies can help to reduce these costs. The most recent study examining the medical and work-loss costs related to all types of injury analyzed data from the year 2000 (2). Since publication of that report, substantial changes have occurred in the causes and mechanisms of fatal injuries. For example, the rate of drug poisoning deaths doubled during 1999–2013 (4), and the suicide rate increased by 16% during 2000–2010 (5), whereas the death rate from motor vehicle crashes declined during 2000–2013 (6). These changes in the cause and mechanism of injury deaths suggest that previous estimates of cost associated with fatal injuries are not representative of current costs. This report uses the most recently available data on fatal injuries, as well as an updated costing methodology that incorporates up-to-date medical cost and earnings data.
Although the majority of total costs related to injury deaths were associated with unintentional injuries, substantial costs were also associated with suicide and homicide. The overall medical and work-loss costs associated with fatal injury differ considerably across demographic groups, intents, and mechanisms of injury. For example, males accounted for 75% of the costs of unintentional injury deaths, 86% of homicide-associated costs, and 82% of suicide-associated costs. Persons aged 15–44 years accounted for 82% of homicide-associated costs, compared with 65% and 64% of suicide- and unintentional injury-associated costs, respectively. The higher burden of homicide at younger ages compared with other causes of injury death is reflected in the higher combined medical and work-loss cost per case for homicide.
The costs of injury deaths are not proportional to the rates of injury deaths because of the higher lifetime work-loss costs for persons who die at younger ages. These disparities largely result from differences in lost productivity, which are proportional to years of potential life lost. For example, persons aged <65 years accounted for $199.8 billion (96%) of the overall $208.3 billion associated with fatal injuries. Although persons aged ≥65 years accounted for 28% of all injury-associated deaths (and 35% of all suicides), deaths in this age group accounted for only 1% (homicide) to 6% (unintentional injury) of costs related to injury deaths. Additionally, although the unintentional injury death rate for persons aged ≥65 years was more than twice as high as for any other age group, only 6% of the unintentional costs were incurred by this age group, highlighting the relation between the cost of an injury death and years of potential life lost. Similarly, 18% of all suicides were among those aged ≥65 years, yet <3% of the suicide-related costs were accounted for by this age group.
Although drug poisonings, transportation- and firearm-related injuries, suffocation, and falls accounted for the greatest proportion of costs for all injury deaths, these proportions differed by intent. Firearm-related injuries accounted for most of the homicide-associated costs, and a large share of the cost of suicide, but <1% of the costs of unintentional injuries. Drug poisonings, the leading mechanism of overall injury deaths, accounted for approximately 38% of the cost of unintentional deaths and 12% of the suicide-associated costs. More than 99% of transportation-related fatal injuries, which accounted for the second largest share of all costs, were associated with unintentional injury deaths.
The findings in this report are subject to at least four limitations. First, the costs measured account for medical costs and lost productivity associated with decedents. Other societal costs, including those associated with law enforcement, prosecution, and corrections, as well as the pain and suffering of family members, were not considered. Second, intent of fatal injury, as determined from the manner of death assigned on death certificates by coroners or medical examiners, can differ across jurisdictions (7). Finally, work-loss costs were assigned using the mean earnings of the general population by sex and specific age groups. If the mean earnings of persons who die from injuries differ from those of the general population, the estimates might be higher or lower than the actual lost earnings.
Injury prevention programs, strategies, and practices can reduce risks for deaths, enhance protection at the individual, relationship, neighborhood, and societal levels, and substantially reduce the costs identified in this report. Numerous strategies have demonstrated the potential for preventing different causes and mechanisms of injury. For example, street outreach programs that effectively mediate conflicts in high-crime communities have shown promise in reducing firearm-related violence (8). Information about the cost-effectiveness of injury prevention strategies is also expanding. Child safety seat laws and sobriety checkpoints offer net cost savings, with medical and other resource costs saved that exceed implementation and maintenance costs (9). These current estimates of the economic burden of fatal injuries can used by decision makers to compare the costs of implementing prevention strategies with the cost that might be avoided by preventing injuries.
1Division of Analysis, Research and Practice Integration, National Center for Injury Prevention and Control, CDC; 2Division of Violence Prevention, National Center for Injury Prevention and Control, CDC; 3Division of Unintentional Injury Prevention, National Center for Injury Prevention and Control, CDC.
Corresponding author: Curtis Florence, cflorence@cdc.gov, 770-488-1398.
References
- CDC. Web-Based Injury Statistics Query and Reporting System (WISQARS). Available at http://www.cdc.gov/injury/wisqars.
- Finkelstein EA, Corso PS, Miller TR, et al. The incidence and economic burden of injury in the United States. New York, NY: Oxford University Press; 2006.
- Florence C, Haegerich T, Simon T, et al. Estimated lifetime medical and work-loss costs of emergency department–treated nonfatal injuries—United States, 2013. MMWR Morb Mortal Wkly Rep 2015;64:1078–82.
- Lawrence BA, Miller TA. Medical and work loss cost estimation methods for the WISQARS cost of injury module. Available at http://www.pire.org/documents/WisqarsCostMethods.pdf.
- Baker SP, Hu G, Wilcox HC, Baker TD. Increase in suicide by hanging/suffocation in the U.S., 2000–2010. Am J Prev Med 2013;44:146–9.
- National Center for Statistics and Analysis. 2013 motor vehicle crashes: overview. Available at http://www-nrd.nhtsa.dot.gov/Pubs/812101.pdf.
- Breiding MJ, Wiersema B. Variability of undetermined manner of death classification in the US. Inj Prev 2006;12(Suppl 2):ii49–54.
- Webster DW, Whitehill JM, Vernick JS, Curriero FC. Effects of Baltimore's Safe Streets Program on gun violence: a replication of Chicago's CeaseFire Program. J Urban Health 2013;90:27–40.
- Miller T, Finkelstein E, Zaloshnja E, Hendrie D. The cost of child and adolescent injuries and the savings from prevention, in Injury prevention for children and adolescents: research, practice, and advocacy. Liller K, ed. Washington, DC: American Public Health Association; 2012:15–64.
Summary
What is already known on this topic?
Injuries are a leading cause of death in the United States, particularly among adolescents and young adults. Intentional and unintentional injury-associated deaths result in a substantial economic burden. Injury and violence prevention strategies can save lives and reduce costs.
What is added by this report?
Cost of injury estimates were updated using improved methodology and the most recently available injury data. The total estimated lifetime medical and work-loss costs associated with fatal injuries in 2013 was $214 billion. Males accounted for 78% of economic costs ($166.7 billion). Approximately 61% of the total costs were attributable to unintentional injuries ($129.7 billion), followed by suicide ($50.8 billion [24%]) and homicide ($26.4 billion [12%]). Drug poisonings as a mechanism accounted for the largest share of injury costs (27%), followed by transportation (23%) and firearm-related injuries (22%).
What are the implications for public health practice?
Injury deaths created a substantial economic burden in the United States during 2013. Understanding the causes and mechanisms of injury death that created the largest share of this burden, such as drug overdoses, and understanding disparities among affected groups can inform public health prevention efforts.
|
TABLE. Injury deaths, rates per 100,000 population, and estimated lifetime medical and work-loss costs, by sex, age group, and intent — United States, 2013 |
||||||||
|---|---|---|---|---|---|---|---|---|
|
Intent |
Total |
Sex |
Age group (yrs) |
|||||
|
Male |
Female |
0–14 |
15–24 |
25–44 |
45–64 |
≥65 |
||
|
All intents* |
||||||||
|
No. of deaths |
192,945 |
129,912 |
63,033 |
5,501 |
21,320 |
53,205 |
58,350 |
54,524 |
|
Rate† |
61.03 |
83.46 |
39.28 |
9.00 |
48.50 |
63.87 |
70.23 |
121.97 |
|
Costs§ |
214,394 |
166,717 |
47,355 |
7,786 |
41,527 |
95,540 |
55,250 |
9,164 |
|
Unintentional |
||||||||
|
No. of deaths |
130,557 |
81,916 |
48,641 |
3,993 |
11,619 |
31,563 |
37,414 |
45,942 |
|
Rate† |
41.30 |
52.63 |
30.31 |
6.54 |
26.43 |
37.89 |
45.03 |
102.77 |
|
Costs§ |
129,726 |
97,091 |
32,585 |
5,628 |
22,371 |
56,079 |
35,112 |
7,439 |
|
Homicide |
||||||||
|
No. of deaths |
16,121 |
12,726 |
3,395 |
896 |
4,329 |
6,817 |
3,164 |
905 |
|
Rate† |
5.10 |
8.18 |
2.12 |
1.47 |
9.85 |
8.18 |
3.81 |
2.02 |
|
Costs§ |
26,350 |
22,572 |
3,817 |
1,235 |
8,622 |
12,858 |
3,159 |
202 |
|
Suicide |
||||||||
|
No. of deaths |
41,149 |
32,055 |
9,094 |
395 |
4,878 |
12,899 |
15,756 |
7,215 |
|
Rate† |
13.02 |
20.59 |
5.67 |
0.65 |
11.10 |
15.49 |
18.96 |
16.14 |
|
Costs§ |
50,795 |
41,747 |
8,913 |
664 |
9,578 |
23,242 |
15,038 |
1,443 |
|
Sources: CDC's National Center for Health Statistics National Vital Statistics System for numbers of deaths. Pacific Institute for Research and Evaluation for unit cost estimates. U.S. Census Bureau for population estimates. Numbers and rates computed using the Web-Based Injury Statistics Query and Reporting System (WISQARS) (http://www.cdc.gov/injury/wisqars). * All intents include legal intervention and undetermined intent of injury. † Deaths per 100,000 population. § In millions of 2013 U.S. dollars. Cost estimates were computed from average lifetime work-loss and medical costs by mechanism and intent of injury. The base year for average costs was 2010. Base year costs were indexed to 2013 prices and applied to 2013 death counts. Lifetime medical costs refer to the medical costs associated with the fatal injury event. |
||||||||
FIGURE 1. Mean medical and work-loss costs per injury death, by intent* — United States, 2013
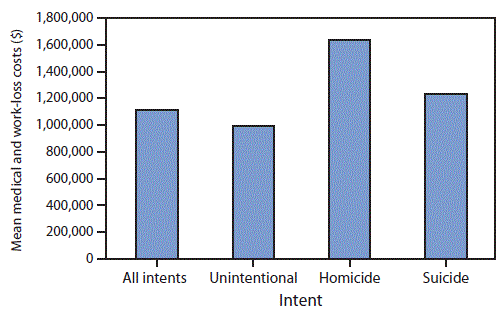
* All intents category includes legal intervention and undetermined intent of injury, in addition to unintentional, homicide, and suicide.
Alternate Text: The figure above is a bar chart showing the mean medical and work-loss costs per injury death, by intent, in the United States during 2013.
FIGURE 2. Distribution of lifetime medical and work-loss cost estimates for fatal injury, by mechanism and intent — United States, 2013
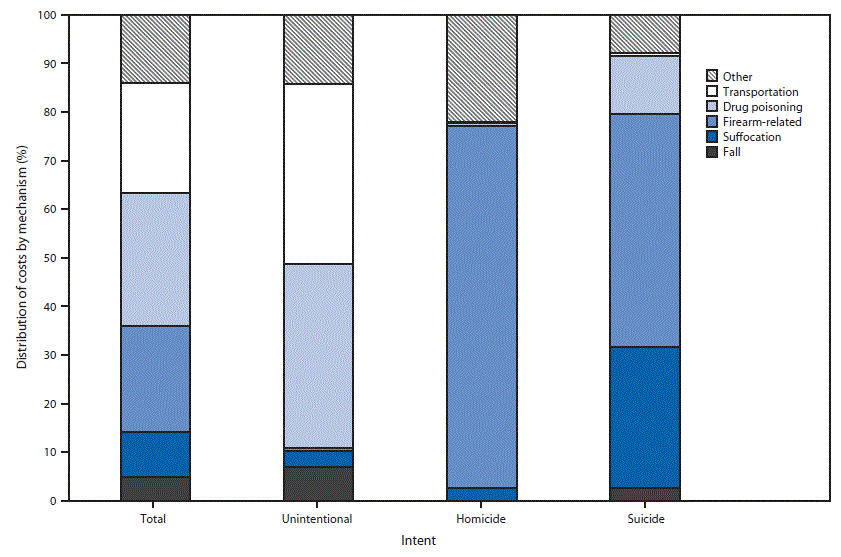
Alternate Text: The figure above is a stacked bar chart showing the distribution of lifetime medical and work-loss cost estimates for fatal injury, by mechanism and intent, in the United States during 2013.
Use of trade names and commercial sources is for identification only and does not imply endorsement by the U.S. Department of
Health and Human Services.
References to non-CDC sites on the Internet are
provided as a service to MMWR readers and do not constitute or imply
endorsement of these organizations or their programs by CDC or the U.S.
Department of Health and Human Services. CDC is not responsible for the content
of pages found at these sites. URL addresses listed in MMWR were current as of
the date of publication.
All MMWR HTML versions of articles are electronic conversions from typeset documents.
This conversion might result in character translation or format errors in the HTML version.
Users are referred to the electronic PDF version (http://www.cdc.gov/mmwr)
and/or the original MMWR paper copy for printable versions of official text, figures, and tables.
An original paper copy of this issue can be obtained from the Superintendent of Documents, U.S.
Government Printing Office (GPO), Washington, DC 20402-9371;
telephone: (202) 512-1800. Contact GPO for current prices.
**Questions or messages regarding errors in formatting should be addressed to
mmwrq@cdc.gov.
