Update: Influenza Activity — United States and Worldwide, May 24–September 5, 2015
, MPH1; , MPH1; , MPH1; , MPH1; , MPH1; , PhD1; , MD1; , MD1; , MS1; , PhD1; , MD1; 1; , PhD1; , PhD1; , MA1; , PhD1; , MD1; , MPH1
During May 24–September 5, 2015,* the United States experienced typical low levels of seasonal influenza activity. Influenza A (H1N1)pdm09 (pH1N1), influenza A (H3N2), and influenza B viruses were detected worldwide and were identified sporadically in the United States. All of the influenza viruses collected from U.S. states and other countries during that time have been characterized antigenically and/or genetically as being similar to the influenza vaccine viruses recommended for inclusion in the 2015–16 Northern Hemisphere vaccine. During May 24–September 5, 2015, three influenza variant† virus infections were reported; one influenza A (H3N2) variant virus (H3N2v) from Minnesota in July, one influenza A (H1N1) variant (H1N1v) from Iowa in August, and one H3N2v from Michigan in August.
United States
The U.S. influenza surveillance system§ is a collaboration between CDC and federal, state, local, and territorial partners, and uses eight data sources to collect influenza information,¶ six of which operate year-round.
During May 24–September 5, 2015, World Health Organization (WHO) and National Respiratory and Enteric Virus Surveillance System (NREVSS) collaborating laboratories in the United States tested 80,345 specimens for influenza; 1,698 (2.1%) were positive for influenza (Figure). Of the 1,698 specimens positive for influenza during the summer months of 2015, a total of 913 (54%) were influenza A viruses, and 785 (46%) were influenza B viruses. Influenza B viruses were reported slightly more frequently than influenza A viruses from late May until mid-June, and influenza A viruses were more commonly reported from late June through early September. Of the 913 influenza A viruses, 551 (60%) were subtyped: 28 (5%) were pH1N1 viruses and 523 (95%) were influenza A (H3N2) viruses. Influenza viruses were reported from the District of Columbia, Puerto Rico, and 47 states in all 10 U.S. Department of Health and Human Services regions.**
During May 24–September 5, data from the U.S. Outpatient Influenza-Like Illness Surveillance Network (ILINet) indicated that the weekly percentage of outpatient visits to health care providers for influenza-like illness (ILI)†† remained below the national baseline§§ of 2.0%, ranging from 0.8% to 1.3%. The percentage of deaths attributed to pneumonia and influenza (P&I), as reported by the 122 Cities Mortality Reporting System, did not exceed the epidemic threshold¶¶ for 2 consecutive weeks and ranged from 5.0% to 6.4%. A total of four influenza-associated pediatric deaths were reported during May 24–September 5; all were associated with influenza B viruses and occurred during weeks 7, 8, 17, and 21 (the weeks ending February 21, February 28, May 2, and May 30, 2015, respectively).
Novel Influenza A Virus Infection
During May 24–September 5, three cases of human infection with novel influenza A viruses were reported. One infection with an H3N2v virus was reported by Minnesota in July, one infection with an H1N1v virus was reported by Iowa in August, and one infection with an H3N2v virus was reported by Michigan in August. All three patients were hospitalized as a result of their illness, but recovered fully. Direct contact with swine in the week preceding illness onset was reported in all three instances. No ongoing community transmission of either virus was detected.
Worldwide
CDC serves as a WHO Collaborating Center for Surveillance, Epidemiology, and Control of Influenza, one of six WHO Collaborating Centers for Influenza in the WHO Global Influenza Surveillance and Response System (GISRS) (1). CDC, along with other international public health partners, provide surveillance and virus characterization data to WHO (2). The timing of influenza activity around the world varies depending on the climate of the region.*** Geographic groups of countries, areas, or territories with similar influenza transmission patterns are grouped by influenza transmission zones (2).
During May 24–September 5, typical seasonal patterns of influenza activity occurred in temperate climate Southern Hemisphere countries. In Australia, influenza activity began to increase in early June, while influenza activity in New Zealand began to increase in mid-July. Activity in both countries remained elevated as of early September. In Australia and New Zealand, influenza B viruses predominated overall, but the proportion of influenza A (H3N2) viruses increased during July and August. Small numbers of pH1N1 viruses were reported from both countries. In South Africa, influenza activity began to increase in late May, peaked in late June, and decreased in late July. Influenza A (H3N2) and pH1N1 viruses predominated in that country, but influenza B viruses also were reported. In temperate countries of South America, influenza activity began to increase in June, remained elevated through July, and decreased in August. Influenza A viruses were reported more frequently than influenza B viruses, and both pH1N1 and influenza A (H3N2) viruses were detected in Chile and Paraguay. Influenza A (H3N2) viruses predominated in Argentina. In temperate climate countries of Europe and North America, influenza activity was low, and small numbers of pH1N1, influenza A (H3N2), and influenza B viruses were identified.
In countries with tropical influenza seasonality, overall influenza activity remained low, and the predominant virus varied by country. In the Caribbean and Central America, influenza A viruses were more commonly reported, with influenza A (H3N2) viruses predominating in Mexico and El Salvador, while pH1N1 viruses were more frequently reported in Cuba. In tropical South America, influenza A viruses predominated. Influenza A (H3N2) and pH1N1 viruses co-circulated in Colombia and Peru, while influenza A (H3N2) viruses predominated in Brazil and Ecuador; however, influenza B viruses were more frequently reported in Bolivia. In South Asia and Southeast Asia, a decrease in influenza activity was observed during August and September, and influenza A (H3N2) viruses predominated in Cambodia, China, Laos, Philippines, Singapore, Thailand, and Vietnam, with smaller numbers of pH1N1 and influenza B viruses reported. In Indonesia, influenza B viruses were more frequently reported, but influenza A (H3N2) and pH1N1 viruses also were identified. During May 24–September 5, four laboratory-confirmed human cases of avian influenza A (H5N1) virus infection were reported to WHO from Egypt, and one case of influenza A (H5N6) and five cases of influenza A (H7N9) were identified in China.†††
Antigenic and Genetic Characterization of Influenza Viruses
The components for the 2015–16 Northern Hemisphere influenza vaccines were selected in February 2015 during the twice-yearly WHO-sponsored vaccine consultation meeting to review data generated by GISRS laboratories. The recommended Northern Hemisphere 2015–16 vaccine composition was the same as was recommended for the 2015 Southern Hemisphere and included an A/California/7/2009 (H1N1)pdm09-like virus, an A/Switzerland/9715293/2013 (H3N2)-like virus, and a B/Phuket/3073/2013-like (B/Yamagata lineage) virus for trivalent influenza vaccines (3). An additional influenza B virus (B/Brisbane/60/2008-like [B/Victoria lineage]) was recommended for quadrivalent vaccines (3). Influenza viruses used to produce most influenza vaccines in the United States must be grown in eggs per current regulatory requirements. However egg propagation of influenza viruses, and influenza A (H3N2) viruses in particular, can lead to genetic changes that might have antigenic implications. The vaccine viruses selected for the Northern Hemisphere 2015–16 vaccine were representative of most, but not all circulating influenza viruses at that time, and had the fewest and least significant egg-adapted changes.
The WHO Collaborating Center for Surveillance, Epidemiology, and Control of Influenza, located at CDC, receives and characterizes influenza virus isolates from laboratories worldwide. CDC and other collaborating centers routinely use hemagglutination inhibition (HI) assays to antigenically characterize influenza viruses to compare how similar currently circulating influenza viruses are to those included in the influenza vaccine, and to monitor for changes in circulating influenza viruses. Beginning in the 2014–15 season and to date, however, a portion of influenza A (H3N2) viruses did not yield sufficient hemagglutination titers for antigenic characterization by HI. For many of these viruses, CDC performed genetic characterization which provided the genetic group identity of circulating viruses. In this way, antigenic properties of these viruses can be inferred from viruses within the same genetic group that have been characterized antigenically. During May 24–September 5, a total of 199 viruses collected from the United States and worldwide were antigenically and/or genetically characterized by CDC, including 20 influenza A (H1N1)pdm09 viruses, 118 influenza A (H3N2) viruses, and 61 influenza B viruses.
All 20 (100%) influenza A (H1N1)pdm09 viruses (16 international and four U.S.) were antigenically similar to the A/California/7/2009, the influenza A (H1N1)pdm09 vaccine component. Of the 118 influenza A (H3N2) viruses characterized (31 international and 87 U.S.), all 118 (100%) were antigenically similar to A/Switzerland/9715293/2013, or belonged to a genetic group for which a majority of antigenically characterized viruses were similar to the A/Switzerland/9715293/2013 vaccine component.
Of the 61 influenza B viruses collected and analyzed (11 international and 50 U.S.), 35 (57%) belonged to the B/Yamagata lineage, and all 35 (100%) of these were antigenically similar to the B/Phuket/3073/2013 virus, the influenza B component for both the 2015–16 Northern Hemisphere trivalent and quadrivalent vaccines. The remaining 26 viruses (43%) belonged to the B/Victoria lineage and were antigenically similar to the B/Brisbane/60/2008 virus, the B/Victoria lineage component of the 2015–16 Northern Hemisphere quadrivalent influenza vaccine.
Additional viruses have been characterized by the other collaborating centers. That information is presented elsewhere (2).
Antiviral Resistance Profiles of Influenza Virus Isolates
The WHO Collaborating Center for Surveillance, Epidemiology, and Control of Influenza at CDC tested 169 influenza virus specimens collected during May 24–September 5 from the U.S. and worldwide for resistance to the influenza neuraminidase inhibitor antiviral medications; oseltamivir, zanamivir, and peramivir, which are the drugs currently approved for use against seasonal influenza. All 19 (16 international and three U.S.) pH1N1 viruses, 84 (five international and 79 U.S.) influenza A (H3N2) viruses, and 66 (11 international and 55 U.S) influenza B viruses tested were sensitive to all three antiviral medications. High levels of resistance to the adamantanes (amantadine and rimantadine) persist among pH1N1 and influenza A (H3N2) viruses. Adamantane drugs are not recommended for use against influenza at this time.
Discussion
During May 24–September 5, 2015, pH1N1, influenza A (H3N2), and influenza B viruses co-circulated worldwide. In the United States, low levels of influenza activity were reported, and influenza A viruses were more frequently reported from late June to September. All of the influenza viruses collected from U.S. states and other countries during that time were antigenically and/or genetically characterized as being similar to the influenza vaccine viruses recommended for inclusion in the 2015–16 Northern Hemisphere vaccine. Antigenic and genetic characterization of circulating influenza viruses can give an indication of the influenza vaccine's ability to produce an immune response against circulating influenza viruses, but vaccine effectiveness studies are needed to determine how much protection has been provided by vaccination to the community. Last season, low vaccine effectiveness observed against the predominant influenza A (H3N2) viruses was consistent with laboratory data indicating that most influenza A (H3N2) viruses that circulated were antigenically and genetically different (drifted) from the influenza A (H3N2) vaccine component of the 2014–15 Northern Hemisphere influenza vaccines (4). It is not possible to predict which influenza virus will predominate or how severe influenza-related disease activity will be during the 2015–16 season, nor is it possible to say with certainty how effective influenza vaccine will be; however, laboratory analysis of influenza viruses to date suggests that the majority of viruses circulating worldwide in the past few months are similar to 2015–16 vaccine viruses.
Annual influenza vaccination is the best method for preventing influenza and its potentially severe complications (3). While vaccine effectiveness can vary, vaccination has been shown to reduce influenza illnesses, doctors' visits, influenza-related hospitalizations, and deaths (5,6). Even during seasons when vaccine effectiveness is reduced, substantial public health impact can still be measured (6–8). In the United States, annual influenza vaccination is recommended for all persons aged ≥6 months who do not have contraindications. Annual influenza vaccination is recommended regardless of whether the vaccine composition has changed because immunity from vaccination might wane after one season. For the 2015–16 influenza season, interim supply projections by manufacturers for the U.S. market range from 171 million and 179 million doses of vaccine. This would to be the largest supply of influenza vaccine distributed in the United States during one season with the exception of the 2009 pandemic.
Multiple influenza vaccines are approved for use and are being distributed during the 2015–16 season, including a quadrivalent live attenuated influenza vaccine (LAIV4), trivalent and quadrivalent inactivated influenza vaccines (IIV3 and IIV4, respectively), a trivalent cell culture–based inactivated influenza vaccine (ccIIV3), a high-dose trivalent inactivated influenza vaccine (hd IIV3), and a recombinant trivalent influenza vaccine (RIV3). One IIV4 formulation also is approved for intradermal administration. Although both LAIV and inactivated influenza vaccine (IIV) have been demonstrated to be effective in children and adults, LAIV is approved for use in persons aged 2 through 49 years with no contraindications or precautions§§§ (3). For the 2015–16 season, the Advisory Committee on Immunization Practices recommended that healthy children aged 2 through 8 years who have no contraindications or precautions receive either LAIV or IIV, with no preference expressed for either vaccine when one is otherwise appropriate and available (3). This removes the 2014–15 preferential recommendation of LAIV for healthy children aged 2 through 8 years (3). For the 2015–16 season, ACIP recommends that children aged 6 months through 8 years who have previously received ≥2 total doses of trivalent or quadrivalent influenza vaccine at any time before July 1, 2015, require only 1 dose for 2015–16 (3). The 2 previous doses do not need to have been given during the same or consecutive seasons (3). Children in this age group who are being vaccinated for the first time or who have not previously received a total of ≥2 doses require 2 doses of influenza vaccine, administered ≥4 weeks apart (9).
Although vaccination is the best method for preventing and reducing the impact of influenza, antiviral medications are a valuable adjunct. Treatment with influenza antiviral medications is recommended as early as possible for patients with confirmed or suspected influenza (either seasonal influenza or novel influenza virus infection) who have severe, complicated, or progressive illness; who require hospitalization; or who are at high risk for influenza-related complications¶¶¶ (10). Antiviral treatment should not be withheld from high-risk or severely ill patients with suspected influenza infection (10). Treatment is most effective when given early in the illness; providers should not delay treatment until test results become available and should not rely on insensitive assays such as rapid antigen detection influenza diagnostic tests to determine treatment decisions (10).
Influenza surveillance reports for the United States are posted online weekly and are available at http://www.cdc.gov/flu/weekly. Additional information regarding influenza viruses, influenza surveillance, influenza vaccines, influenza antiviral medications, and novel influenza A virus infections in humans is available at http://www.cdc.gov/flu.
Acknowledgments
State, county, city, and territorial health departments and public health laboratories; U.S. World Health Organization collaborating laboratories; National Respiratory and Enteric Virus Surveillance System laboratories; U.S. Outpatient Influenza-Like Illness Surveillance Network sites; 122 Cities Mortality Reporting System; World Health Organization FluNet.
1Influenza Division, National Center for Immunization and Respiratory Diseases, CDC.
Corresponding author: Lenee Blanton, lblanton@cdc.gov, 404-639-3747.
References
- World Health Organization. Influenza: WHO Collaborating Centers and Essential Regulatory Laboratories. Available at http://www.who.int/influenza/gisrs_laboratory/collaborating_centres/en.
- World Health Organization. FluNet. Available at. http://www.who.int/influenza/gisrs_laboratory/flunet/en.
- Grohskopf LA, Sokolow LZ, Olsen SJ, Bresee JS, Broder KR, Karron RA. Prevention and control of influenza with vaccines: recommendations of the Advisory Committee on Immunization Practices (ACIP)—United States, 2015–16 influenza season. MMWR Morb Mortal Wkly Rep 2015;64:818–25.
- CDC. CDC presents updated estimates of flu vaccine effectiveness for the 2014–2015 season. Available at http://www.cdc.gov/flu/news/updated-vaccine-effectiveness-2014-15.htm.
- Reed C, Kim IK, Singleton JA, et al. Estimated influenza illnesses and hospitalizations averted by vaccination—United States, 2013–14 influenza season. MMWR Morb Mortal Wkly Rep 2014;63:1151–4.
- Foppa IM, Cheng PY, Reynolds SD, et al. Deaths averted by influenza vaccination in the U.S. during the seasons 2005/06 through 2013/14. Vaccine 2015;33:3003–9.
- Kostova D, Reed C, Finelli L, et al. Influenza illness and hospitalizations averted by influenza vaccination in the United States, 2005–2011. PLoS One 2013;8:e66312.
- Fry AM, Kim IK, Reed C, et al. Modeling the effect of different vaccine effectiveness estimates on the number of vaccine-prevented influenza-associated hospitalizations in older adults. Clin Infect Dis 2014;59:406–9.
- Neuzil KM, Jackson LA, Nelson J, et al. Immunogenicity and reactogenicity of 1 versus 2 doses of trivalent inactivated influenza vaccine in vaccine-naive 5-8-year-old children. J Infect Dis 2006;194:1032–9.
- Fiore AE, Fry A, Shay D, Gubareva L, Bresee JS, Uyeki TM. Antiviral agents for the treatment and chemoprophylaxis of influenza—recommendations of the Advisory Committee on Immunization Practices (ACIP). MMWR Recomm Rep 2011;60(No. RR-1):1–24.
* Data as of September 11, 2015.
† Influenza viruses that circulate in swine are called swine influenza viruses when isolated from swine, but are called variant influenza viruses when isolated from humans. Seasonal influenza viruses that circulate worldwide in the human population have important antigenic and genetic differences from influenza viruses circulating in swine.
§ The CDC influenza surveillance system collects information in five categories from eight data sources: 1) viral surveillance (World Health Organization collaborating laboratories, the National Respiratory and Enteric Virus Surveillance System, and novel influenza A virus case reporting); 2) outpatient illness surveillance (U.S. Outpatient Influenza-Like Illness Surveillance Network); 3) mortality (122 Cities Mortality Reporting System and influenza-associated pediatric mortality reports); 4) hospitalizations (Influenza Hospitalization Surveillance Network [FluSurv-NET], which includes the Emerging Infections Program and surveillance in three additional states); and 5) summary of the geographic spread of influenza (state and territorial epidemiologist reports).
¶ An overview of influenza surveillance in the United States is available at http://www.cdc.gov/flu/weekly/overview.htm.
** The 10 regions include the following jurisdictions: Region 1: Connecticut, Maine, Massachusetts, New Hampshire, Rhode Island, and Vermont; Region 2: New Jersey, New York, Puerto Rico, and the U.S. Virgin Islands; Region 3: Delaware, District of Columbia, Maryland, Pennsylvania, Virginia, and West Virginia; Region 4: Alabama, Florida, Georgia, Kentucky, Mississippi, North Carolina, South Carolina, and Tennessee; Region 5: Illinois, Indiana, Michigan, Minnesota, Ohio, and Wisconsin; Region 6: Arkansas, Louisiana, New Mexico, Oklahoma, and Texas; Region 7: Iowa, Kansas, Missouri, and Nebraska; Region 8: Colorado, Montana, North Dakota, South Dakota, Utah, and Wyoming; Region 9: Arizona, California, Hawaii, Nevada, American Samoa, Commonwealth of the Northern Mariana Islands, Federated States of Micronesia, Guam, Marshall Islands, and Republic of Palau; Region 10: Alaska, Idaho, Oregon, and Washington.
†† Defined as a temperature of ≥100°F (≥37.8°C), oral or equivalent, and cough and/or sore throat, without a known cause other than influenza.
§§ The national baseline is the mean percentage of visits for ILI during noninfluenza weeks for the previous three seasons plus two standard deviations. Noninfluenza weeks are defined as periods of ≥2 consecutive weeks in which each week accounted for <2% of the season›s total number of specimens that tested positive for influenza. The national percentage of patient visits for ILI is weighted on the basis of state population.
¶¶ The seasonal baseline proportion of P&I deaths is projected using a robust regression procedure in which a periodic regression model is applied to the observed percentage of deaths from P&I that were reported by the 122 Cities Mortality Reporting System during the preceding 5 years. The epidemic threshold is set at 1.645 standard deviations above the seasonal baseline.
*** In temperate climates, the onset and peak of influenza activity might vary substantially from one influenza season to the next, but generally begins to increase in the late fall. In the Northern Hemisphere's temperate regions, annual epidemics of influenza typically occur during October–February, but the peak of influenza activity can occur as late as April or May. In temperate regions of the Southern Hemisphere, influenza activity typically peaks during May through August. Although temperate regions of the world experience a seasonal peak in influenza activity, influenza viruses can be isolated year-round. The timing of seasonal peaks in influenza activity in tropical and subtropical countries varies by region, and multiple peaks of activity during the same year have been seen in some areas.
††† The list of WHO Disease Outbreak News updates are available at http://www.who.int/csr/don/archive/year/2015/en.
§§§ LAIV should not be used in the following populations: 1) persons aged <2 years or >49 years; 2) those with contraindications listed in the package insert (children aged 2 through 17 years who are receiving aspirin or aspirin-containing products and persons who have experienced severe allergic reactions to the vaccine or any of its components, or to a previous dose of any influenza vaccine); 3) pregnant women; 4) immunosuppressed persons; 5) persons with a history of egg allergy; 6) children aged 2 through 4 years who have asthma or who have had a wheezing episode noted in the medical record within the past 12 months, or for whom parents report that a health care provider stated that the child had wheezing or asthma within the last 12 months; 7) persons who have taken influenza antiviral medications within the previous 48 hours; and 8) persons who care for severely immunosuppressed persons who require a protective environment (such persons should not receive LAIV, or should avoid contact with immunosuppressed persons for 7 days after receipt, given the theoretical risk for transmission of the live attenuated vaccine virus).
¶¶¶ Persons at high risk include 1) children aged <5 years (especially those aged <2 years); 2) adults aged ≥65 years; 3) persons with chronic pulmonary (including asthma), cardiovascular (except hypertension alone), renal, hepatic, hematologic (including sickle cell disease), metabolic disorders (including diabetes mellitus), or neurologic and neurodevelopment conditions (including disorders of the brain, spinal cord, peripheral nerve, and muscle, such as cerebral palsy, epilepsy [seizure disorders], stroke, intellectual disability [mental retardation], moderate to severe developmental delay, muscular dystrophy, or spinal cord injury); 4) persons with immunosuppression, including that caused by medications or by human immunodeficiency virus infection; 5) women who are pregnant or postpartum (within 2 weeks after delivery); 6) persons aged ≤18 years who are receiving long-term aspirin therapy; 7) American Indians/Alaska Natives; 8) persons who are morbidly obese (i.e., with a body mass index ≥40); and 9) residents of nursing homes and other chronic care facilities.
Summary
What is already known on this topic?
CDC collects, compiles, and analyzes data on influenza activity year-round in the United States. The influenza season generally begins in the fall and continues through the winter and spring months; however, the timing and severity of disease and the predominant viral strains can vary by geographic location and season.
What is added by this report?
Worldwide, influenza activity during May 24–September 5, 2015, was elevated in the temperate Southern Hemisphere and tropical regions, compared with their levels outside the usual influenza season. In the United States, low levels of seasonal influenza activity were detected.
What are the implications for public health practice?
In the United States, an influenza vaccine is recommended for all persons aged ≥6 months and can reduce the likelihood of becoming ill with influenza and transmitting the virus to others. Annual influenza vaccination is recommended for optimal protection regardless of whether the vaccine composition has changed since the previous season because immunity wanes over time. Although vaccination is the best way to prevent influenza, treatment with influenza antiviral medications can reduce severe outcomes of influenza, especially when initiated as early as possible, in patients with confirmed or suspected influenza who have severe, complicated, or progressive illness; who require hospitalization; or who are at high risk for influenza-related complications.
FIGURE. Number* and percentage of respiratory specimens testing positive for influenza reported by World Health Organization and National Respiratory and Enteric Virus Surveillance System collaborating laboratories, by type, subtype, and week — United States, September 28, 2014–September 5, 2015†
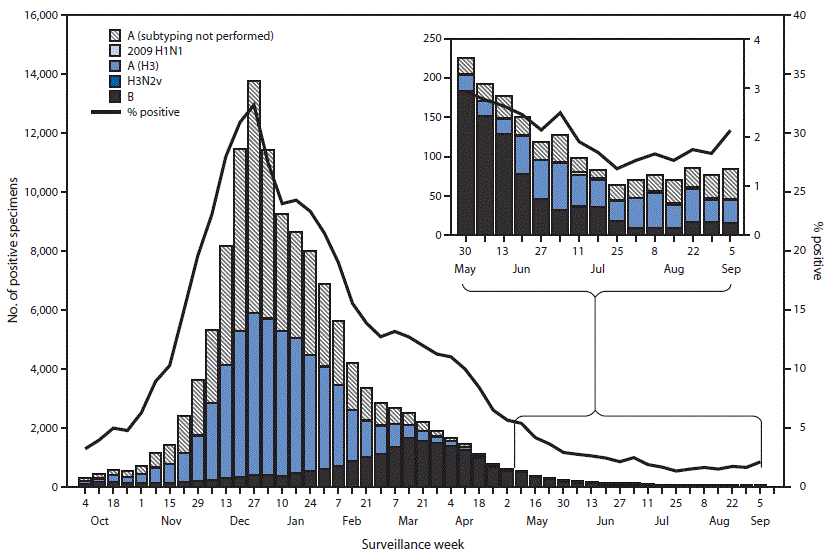
* N = 127,986.
† As of September 11, 2015.
Alernate Text: The figure above is a bar chart showing the number and percentage of respiratory specimens testing positive for influenza reported by World Health Organization and National Respiratory and Enteric Virus Surveillance System collaborating laboratories, by type, subtype, and week, in the United States during September 28, 2014–September 5, 2015.
Use of trade names and commercial sources is for identification only and does not imply endorsement by the U.S. Department of
Health and Human Services.
References to non-CDC sites on the Internet are
provided as a service to MMWR readers and do not constitute or imply
endorsement of these organizations or their programs by CDC or the U.S.
Department of Health and Human Services. CDC is not responsible for the content
of pages found at these sites. URL addresses listed in MMWR were current as of
the date of publication.
All MMWR HTML versions of articles are electronic conversions from typeset documents.
This conversion might result in character translation or format errors in the HTML version.
Users are referred to the electronic PDF version (http://www.cdc.gov/mmwr)
and/or the original MMWR paper copy for printable versions of official text, figures, and tables.
An original paper copy of this issue can be obtained from the Superintendent of Documents, U.S.
Government Printing Office (GPO), Washington, DC 20402-9371;
telephone: (202) 512-1800. Contact GPO for current prices.
**Questions or messages regarding errors in formatting should be addressed to
mmwrq@cdc.gov.
