Persons using assistive technology might not be able to fully access information in this file. For assistance, please send e-mail to: mmwrq@cdc.gov. Type 508 Accommodation and the title of the report in the subject line of e-mail.
Progress Toward Poliomyelitis Eradication — Nigeria, January 2011–September 2012
In 1988, the World Health Assembly launched the Global Polio Eradication Initiative (GPEI) and, in 2012, declared the completion of polio eradication a programmatic emergency for global public health (1). To date, wild poliovirus (WPV) cases reported worldwide in 2012 are at historically low levels. Nigeria is one of only three countries with uninterrupted WPV transmission (in addition to Pakistan and Afghanistan) and has been the origin of WPV imported into 25 previously polio-free countries since 2003 (2–4). This report updates previous reports (2–3,5) and describes polio eradication activities and progress in Nigeria during January 2011–September 2012, as of October 30, 2012. The number of reported WPV cases increased from 21 in 2010 to 62 in 2011. During January–September 2012, a total of 99 WPV cases were reported, more than doubling from the 42 cases reported during the same period in 2011. During 2011, a total of 32 circulating vaccine-derived polio virus type 2 (cVDPV2) cases were confirmed; six cVDPV2 cases were confirmed during January–September 2012, compared with 18 cVDPV2 cases during the same period in 2011. Nigeria's 2012 Polio Eradication Emergency Plan (6) includes senior government leadership oversight, new program management and strategic initiatives, an accountability framework, and a surge in human resources to address chronically missed children during supplemental immunization activities (SIAs).* In 2012, indicators of immunization campaign quality show modest improvements; available data indicate gaps in surveillance. Continuing WPV transmission in Nigeria poses an ongoing risk for WPV reintroduction and outbreaks in polio-free countries and is a major obstacle to achieving global eradication (7).
Vaccination Activities
Infants and children are vaccinated against polio as part of a routine vaccination program and through SIAs. The estimated national routine vaccination coverage of infants with 3 doses of trivalent oral poliovirus vaccine (OPV) in Nigeria was 73% in 2011, compared with 54% in 2007 (8). Surveys indicate substantially lower coverage than the national average in the northern states, with wide variation within the majority of northern states.†
During January 2011–September 2012, one national and 10 subnational SIAs were conducted, primarily in high-risk northern states, targeting children aged <5 years using bivalent OPV type 1 and 3, as well as three national and four subnational SIAs using trivalent OPV. After the four campaigns conducted during January–September 2012, lot quality-assurance sampling§ surveys were used to assess the quality of SIAs in reaching all children. The proportion of sampled local government areas (LGAs) (equivalent to districts), in the 12 high-risk northern states that failed to meet the <20% missed children threshold was 82% (72 of 88) after the February 2012 SIA; the proportion decreased over subsequent SIAs: 74% (68 of 92) after the March SIA, 65% (70 of 108) after the May SIA, and 63% (91 of 145) after the July SIA.¶
A surrogate measure of OPV coverage through routine vaccination and SIAs is based on parental recall and vaccination cards of children aged 6–35 months with acute flaccid paralysis (AFP) not attributed to poliovirus (nonpolio AFP [NPAFP]). During all of 2011 and January–September 2012, 3% of children aged 6–35 months in high-risk northern states with NPAFP had never received a dose of OPV ("zero-dose children"), compared with 7% in 2010; the proportion of children in high-risk northern states with NPAFP cases who received ≥4 doses of OPV was 75% in 2011 and 76% during January–September 2012, compared with 60% in 2010 (Table).
Poliovirus Surveillance
AFP surveillance. Polio surveillance depends on detection of AFP cases with confirmation of poliomyelitis by viral isolation. Quality surveillance is measured through performance indicators with defined targets: NPAFP detection rates of ≥2 cases per 100,000 children aged <15 years and adequate stool specimen collection** in ≥80% of AFP cases. In 2011, the annual national NPAFP rate (per 100,000 population aged <15 years) was 7.9, and the proportion of AFP cases with adequate specimen collection was 93%. To date, the annualized national NPAFP rate in 2012 is 9.2, and the proportion of AFP cases with adequate specimen collection is 94%. Both indicators were met in all states during 2011 and all but one state during January–September 2012 (Table). The proportions of LGAs in high-risk northern states that met each indicator in 2011 and January–September 2012 were 82% and 80%, respectively.
Environmental surveillance. To supplement AFP surveillance, collection of sewage samples every 4–5 weeks for poliovirus testing began in July 2011 at three sites in Kano state. During July–December 2011, cVDPV2 was isolated from 12 (67%) of 18 samples collected from Kano; during January–September 2012, of 25 collected, WPV type 3 (WPV3) was isolated from one specimen (4%), and cVDPV2 was isolated from three specimens (12%). Environmental surveillance every 2 weeks at four sites in Sokoto began in March 2012, and WPV1 and cVDPV2 were detected in 15 specimens (30%) and 22 specimens (44%), respectively, of 50 collected. During January–September 2012, AFP surveillance confirmed 18 WPV1, three WPV3, and three cVDPV2 cases in Kano; in Sokoto, eight WPV1 cases and three cVDPV2 cases were confirmed, indicating variability in environmental surveillance sensitivity possibly attributable to site selection.
WPV and cVDPV Case Incidence
During 2011, a total of 62 WPV (47 WPV1 and 15 WPV3) cases were reported in Nigeria, compared with 21 (eight WPV1 and 13 WPV3) cases in 2010, an increase of 195%; 99 WPV (82 WPV1 and 17 WPV3) cases were reported during January–September 2012, compared with 42 (33 WPV1 and nine WPV3) cases during the same period in 2011 (Figures 1 and 2), an increase of 136%. Cases occurred in 42 LGAs in eight states in 2011 and 55 LGAs in 11 states in 2012; all cases occurred in high-risk northern states, with the exception of one WPV3 case reported in Taraba in July 2012. Of 161 cases with onset during January 2011–September 2012, 148 (92%) occurred in children aged <5 years, and 13 (8%) occurred among children aged 5–14 years; 40 (25%) were "zero-dose" children, and 58 (36%) were children reported to have received ≥4 doses of OPV.
During 2011, a total of 32 cVDPV2 transmission cases were confirmed, a 19% increase from 27 cVDPV2 cases in 2010; six cVDPV2 cases were reported during January–September 2012, a 67% decrease from 18 cases during the same period in 2011 (Figures 1 and 2). Cases occurred in 27 LGAs in eight states in 2011 and three LGAs in two states (Kano and Sokoto) in 2012. Of 38 cases with onset during January 2011–September 2012, a total of 37 (97%) occurred in children aged <5 years, and one (3%) occurred among children aged 5–14 years; seven (18%) were "zero-dose" children, and 17 (45%) were children reported to have received ≥4 doses of OPV.
WPV and cVDPV Genomic Sequence Analysis
Analysis of the nucleotide sequence of the VP1 region of all WPV and cVDPV2 isolates is used to investigate transmission links, track international spread, and assess both viral diversity as a measure of circulation intensity and surveillance sensitivity (9).†† After a substantial decline in the genetic diversity (reflected by the number of genetic clusters) of WPV1 strains from 21 clusters in 2009 to four clusters in 2010, the number of clusters increased to eight in 2011. The number of WPV3 clusters declined from 21 in 2009 to six in 2010 and to four in 2011. Genomic sequence analysis shows much less genetic linkage than expected with sensitive AFP surveillance, including some chains of WPV transmission during 2011–2012 not detected for more than a year. The proportion of WPV and cVDPV2 isolates (from cases and contacts) with less than expected genetic linkage (>98.5%) was 60% (29 of 48) in 2010, 31% (30 of 98) in 2011, and 16% (16 of 103) to date in 2012.
Reported by
National Primary Health Care Development Agency and Federal Ministry of Health; World Health Organization Country Office, Abuja; Poliovirus Laboratory, Univ of Ibadan, Ibadan; Poliovirus Laboratory, Univ of Maiduguri Teaching Hospital, Maiduguri, Nigeria. African Regional Polio Reference Laboratory, National Institute for Communicable Diseases, Johannesburg, South Africa. Immunization and Vaccine Development, World Health Organization Regional Office for Africa, Brazzaville, Congo; Polio Eradication Dept, World Health Organization, Geneva, Switzerland. Div of Viral Diseases, National Center for Immunization and Respiratory Diseases; Global Immunization Div, Center for Global Health, CDC. Corresponding contributor: Stacie Dunkle, Global Immunization Div, Center for Global Health, CDC; sdunkle@cdc.gov; 404-861-4841.
Editorial Note
Indigenous WPV1 and WPV3 transmission has continued in the northern states of Nigeria because of long-standing weaknesses in health system infrastructure, programmatic limitations in the planning and implementation of SIAs, and insufficient accountability, compounded by low public confidence in OPV since 2003 in some communities (10). By 2009, substantial progress in implementation of polio eradication activities (attributed to enhanced collaboration with traditional, religious, and political leaders) was followed by a sharp decline in cases; however, a substantial proportion of children, including each newborn cohort, remained chronically unvaccinated or undervaccinated. As WPV continues to circulate in multiple "sanctuaries"§§ in northern states (7), WPV1 and WPV3 cases have increased since 2010, with cases occurring in a growing number of LGAs. Only 17 WPV3 cases were reported in Nigeria during January–September 2012, but WPV3 strains in Nigeria are more genetically diverse than WPV3 strains in Pakistan, the only other country with circulating WPV3 in 2012 (4). Cases of cVDPV2 have declined in 2012; however, extensive cVDPV2 circulation continues to be detected by environmental surveillance in Sokoto.
Although subnational AFP surveillance indicators generally are being met and sequence analysis suggests some improvement in sensitivity over time, environmental surveillance and genomic sequence evidence indicate that substantial surveillance gaps persist (5,9); these gaps might result from variability in AFP surveillance sensitivity at the LGA level or within population subgroups. Key challenges to achieving the high routine and supplementary vaccination coverage that is required to eliminate poliovirus transmission in Nigeria remain and have been compounded by insecurity in some states since late 2011. To address these challenges, the Nigeria 2012 Polio Eradication Emergency Plan (6) includes new initiatives to enhance high-level political oversight and improve program management and accountability, and provides for the deployment of a surge in human resources by government and partner organizations (primarily the World Health Organization and the United Nations Children's Fund) in high-risk states, down to the lowest administrative levels (wards). The augmented technical staff is implementing new strategies to reach chronically missed children during SIAs; these include the use of revised, detailed, and extensively validated house-to-house SIA microplans, more rigorous selection and training of vaccinators, revision of the size and composition of vaccination teams, and increased attention to the identification and vaccination of nomadic and other vulnerable populations. In some states, satellite mapping improved the demarcation of LGA, ward, and team boundaries and identified previously missed settlements. Volunteer community mobilizers have been deployed to settlements with historically high vaccination refusal rates. Insecurity in some LGAs in Borno and Yobe states creates difficulties in reaching undervaccinated children; addressing this will require enhanced engagement of affected communities.
A Nigerian presidential task force was established in March 2012 to provide leadership and oversight of state and local task forces and to improve local accountability for implementation of SIAs. An accountability "dashboard" tool¶¶ has been developed and implemented for monitoring SIA preparations and execution at the LGA level. In addition, experienced Indian surveillance medical officers and a National Stop Transmission of Polio program of health professionals have been deployed to support the development of sustainable management capacity in high-risk LGAs. Efforts continue to identify and include nomadic and otherwise vulnerable children in current microplans, strengthen SIA supervision, and enhance community awareness and availability of routine vaccination through outreach services. The epidemiologic impact of the recent implementation of the Polio Eradication Emergency Plan has yet to be observed; however, improvements in SIA coverage are establishing a stronger footing for measurable progress in 2013. If WPV case counts and extent of circulation are not reduced substantially by mid-2013, additional innovative vaccination strategies to interrupt all WPV transmission will need to be considered. Ongoing WPV transmission in northern Nigeria remains a threat for reintroduction into southern Nigeria and surrounding polio-free countries in Africa, and is a major obstacle to success of GPEI (7).
References
- World Health Assembly. Poliomyelitis: intensification of the global eradication initiative. Resolution WHA65.5. Geneva, Switzerland: World Health Organization; 2012. Available at http://apps.who.int/gb/ebwha/pdf_files/wha65/a65_r5-en.pdf. Accessed November 7, 2012
- CDC. Progress toward global polio eradication—Africa, 2011. MMWR 2012;61:190–4.
- CDC. Progress toward interruption of wild poliovirus transmission—worldwide, January 2011–March 2012. MMWR 2012;61:353–7.
- CDC. Progress toward poliomyelitis eradication—Afghanistan and Pakistan, January 2011–August 2012. MMWR 2012;61:790–5.
- CDC. Progress toward poliomyelitis eradication—Nigeria, January 2010–June 2011. MMWR 2011;60:1053–7.
- National Primary Health Care Agency. Nigeria Polio Eradication Emergency Plan, 2012. Annex 2 of the Global Polio Eradication Emergency Action Plan 2012–2013. World Health Organization: Geneva, Switzerland; 2012. Available at http://www.polioeradication.org/portals/0/document/aboutus/governance/imb/6imbmeeting/7.5_6imb.pdf. Accessed November 1, 2012.
- Independent Monitoring Board of the Global Polio Eradication Initiative. Every missed child: report of the Independent Monitoring Board of the Global Polio Eradication Initiative. Geneva, Switzerland: World Health Organization; 2012. Available at http://www.polioeradication.org/portals/0/document/aboutus/governance/imb/6imbmeeting/imb6_report.pdf. Accessed November 1, 2012.
- World Health Organization. WHO vaccine-preventable diseases monitoring system: 2012 global summary. Geneva, Switzerland: World Health Organization; 2012. Available at http://www.who.int/vaccines/globalsummary/immunization/countryprofileselect.cfm. Accessed November 1, 2012.
- CDC. Tracking progress toward global polio eradication, 2010–2011. MMWR 2012;61:265–9.
- CDC. Progress toward poliomyelitis eradication—Nigeria, January 2004–July 2005. MMWR 2005;54:873–7.
* Mass campaigns conducted for a brief period (days to weeks) in which 1 dose of oral poliovirus vaccine is administered to all children aged <5 years, regardless of vaccination history. Campaigns can be conducted nationally or in sections of the country.
† Additional information available at http://www.measuredhs.com/pubs/pdf/sr173/sr173.pdf.
§ A sample of 10 children aged <5 years was selected from each of six randomly selected wards within local government areas. The <20% missed children threshold is defined as eight or fewer of these 60 children not being vaccinated in the most recent SIA.
¶ Preliminary results from lot quality-assurance sampling after an SIA in northern states in October 2012 demonstrate an additional decline in the proportion of LGAs failing to meet the <20% missed children threshold (63 of 134 [47%]).
** Adequate stool specimen collection is defined as two specimens collected at least 24 hours apart, both within 14 days of paralysis onset, and shipped on ice or frozen packs to a World Health Organization–accredited laboratory, arriving in good condition.
†† All isolates are sequenced across the interval encoding the major capsid protein (VP1) (approximately 900 nucleotides), and results are analyzed to determine the likely origin (by state and local government area) of the virus. Isolates within a cluster share >95% VP1 nucleotide sequence identity.
§§ Discrete geographic locations with large numbers of missed children where the virus has ample opportunity to circulate.
¶¶ An interactive, visual presentation of the current status and historical trends of data. In this case, the data represent LGA-level information on key pre-, intra-, and post-SIA indicators to allow for course-correcting decision making at the state and national levels.
What is already known on this topic?
Nigeria is one of three countries, including Afghanistan and Pakistan, where wild poliovirus (WPV) transmission has never been interrupted. Long-standing weaknesses in health system infrastructure, programmatic limitations in implementation of vaccination campaigns, weak accountability mechanisms, and a loss of public confidence in oral poliovirus vaccine since 2003 in some areas have contributed to ongoing circulation.
What is added by this report?
The number of WPV cases in northern Nigeria nearly tripled in 2011 compared with 2010, and more than doubled in the first 9 months of 2012 compared with the same period in 2011. In addition, transmission of circulating vaccine-derived polio virus type 2 continues. Nigeria's 2012 Polio Eradication Emergency Plan includes new program management and accountability initiatives along with a surge in human resources to vaccinate repeatedly missed children. Indicators of the quality of vaccination campaigns show modest improvements in 2012; routine vaccination coverage continues to be low. Despite national and state-level acute flaccid paralysis surveillance indicators generally being met, available data indicate continued gaps in surveillance.
What are the implications for public health practice?
Continuing WPV transmission in Nigeria poses an ongoing risk for WPV reintroduction into polio-free countries and is a major obstacle to the success of global eradication. Recent initiatives by government and partners have yet to demonstrate their impact epidemiologically, but indicate promise. If WPV case counts and extent of circulation are not reduced substantially by mid-2013, additional innovative strategies to interrupt WPV transmission might need to be considered.
FIGURE 1. Number of cases of wild poliovirus type 1 (WPV1), wild poliovirus type 3 (WPV3), and circulating vaccine-derived polio virus type 2 (cVDPV2), by month — Nigeria, January 2009–September 2012*
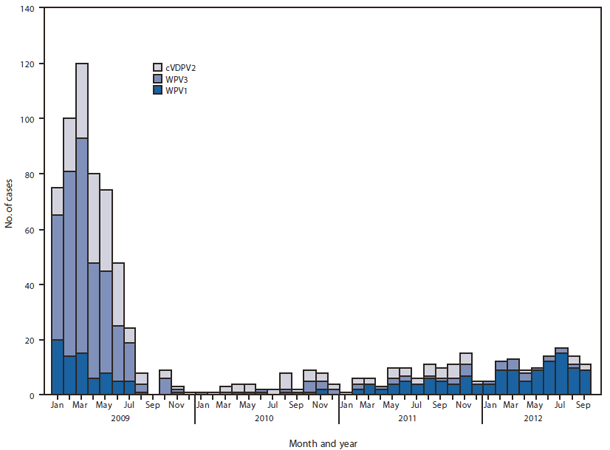
* Data as of October 30, 2012.
Alternate Text: The figure above shows the number of cases of wild poliovirus type 1 (WPV1), wild poliovirus type 3 (WPV3), and circulating vaccine-derived polio virus type 2, by month, in Nigeria during January 2009-September 2012. During January-September 2012, 99 WPV (82 WPV1 and 17 WPV3) cases were reported, compared with 38 (28 WPV1 and 10 WPV3) cases during the same period in 2011.
FIGURE 2. Cases of wild poliovirus type 1 (WPV1), wild poliovirus type 3 (WPV3), and circulating vaccine-derived polio virus type 2 (cVDPV2),* by year — Nigeria, January 2011–September 2012†
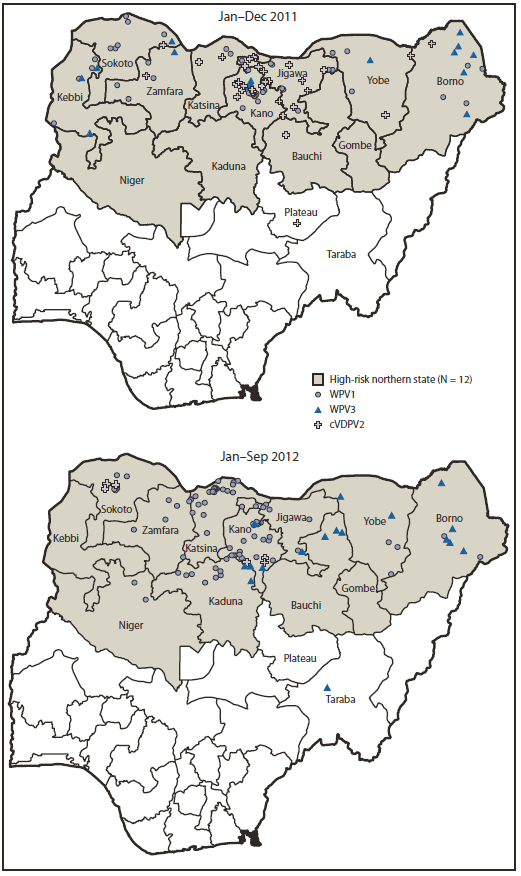
* Each instance of a symbol represents one case of poliovirus and is drawn at random within district boundaries.
† Data as of October 30, 2012.
Alternate Text: The figure above shows cases of wild poliovirus type 1 (WPV1), wild poliovirus type 3 (WPV3), and circulating vaccine-derived polio virus type 2 (cVDPV2), by year, in Nigeria during January 2011-September 2012. During 2011, a total of 62 WPV (47 WPV1 and 15 WPV3) cases were reported in Nigeria, compared with 21 (eight WPV1 and 13 WPV3) cases in 2010, an increase of 195%.
Use of trade names and commercial sources is for identification only and does not imply endorsement by the U.S. Department of
Health and Human Services.
References to non-CDC sites on the Internet are
provided as a service to MMWR readers and do not constitute or imply
endorsement of these organizations or their programs by CDC or the U.S.
Department of Health and Human Services. CDC is not responsible for the content
of pages found at these sites. URL addresses listed in MMWR were current as of
the date of publication.
All MMWR HTML versions of articles are electronic conversions from typeset documents.
This conversion might result in character translation or format errors in the HTML version.
Users are referred to the electronic PDF version (http://www.cdc.gov/mmwr)
and/or the original MMWR paper copy for printable versions of official text, figures, and tables.
An original paper copy of this issue can be obtained from the Superintendent of Documents, U.S.
Government Printing Office (GPO), Washington, DC 20402-9371;
telephone: (202) 512-1800. Contact GPO for current prices.
**Questions or messages regarding errors in formatting should be addressed to
mmwrq@cdc.gov.
