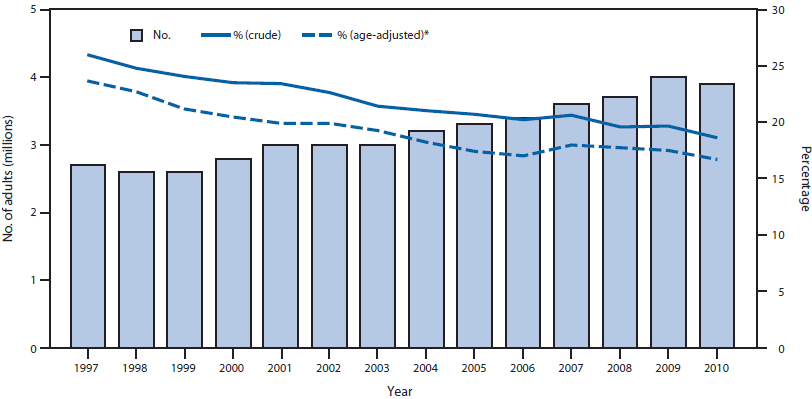
FIGURE 1. Number of adults aged ≥18 years with self-reported diabetes and visual impairment and percentage of adults aged ≥18 years with self-reported diabetes who also reported visual impairment --- National Health Interview Survey, United States, 1997--2010
Persons using assistive technology might not be able to fully access information in this file. For assistance, please send e-mail to: mmwrq@cdc.gov. Type 508 Accommodation and the title of the report in the subject line of e-mail.
Self-Reported Visual Impairment Among Persons with Diagnosed Diabetes — United States, 1997–2010
Diabetes can lead to visual impairment (VI) and blindness (1). However, early detection and treatment of many common eye diseases, such as diabetic retinopathy and glaucoma, can reduce the risk for developing VI (1). Surveillance of VI among persons with diabetes is important for evaluating the effectiveness of efforts to reduce VI and other complications of diabetes. To examine trends in the prevalence of self-reported VI among adults (persons aged ≥18 years) with diagnosed diabetes in the United States and to assess reported access to eye-care providers, CDC analyzed 1997--2010 data from the National Health Interview Survey (NHIS). This report describes the results of that analysis, which indicated that although the number of adults with diagnosed diabetes reporting VI increased, the age-adjusted percentage of adults with diagnosed diabetes who reported VI declined significantly, from 23.7% in 1997 to 16.7% in 2010. During this 14-year period, age-adjusted VI prevalence declined significantly among most categories of adults with diabetes: men, women, whites, Hispanics, those with some college or higher education, and those diagnosed with diabetes for ≥3 years. Prevalence also declined among those aged ≥45 years. The percentage of adults with diagnosed diabetes and self-reported VI who reported having consulted an eye-care provider in the past year remained constant at approximately 63%. Continued efforts are needed to sustain and improve the declining trends in self-reported VI and to increase rates of recommended eye examinations in the population with diabetes.
NHIS is a survey of the civilian, noninstitutionalized population of the United States (2). Adult respondents were asked whether a health professional had ever told them they had diabetes. Women who responded that they had been told they had diabetes during pregnancy only were not considered to have diabetes. Respondents who answer "yes" to the question, "Do you have any trouble seeing even with glasses or contacts?" were considered to have VI. Respondents who answered "yes" to the question, "During the past 12 months, have you seen or talked to an optometrist, ophthalmologist, or eye doctor (someone who prescribes eyeglasses) about your own health?" were considered to have had contact with an eye-care provider in the past year. Prevalence of self-reported VI in persons with diabetes was estimated by age, sex, race, ethnicity, education level, time since diagnosis of diabetes, current insulin use, contact with an eye-care provider in the past year, and health insurance coverage in the past year. The racial groups (i.e., whites and blacks) included persons of both Hispanic and non-Hispanic ethnicity, and the ethnic group (i.e., Hispanics) included persons of any race. Annual prevalences were calculated using 3-year moving averages to improve the precision and reliability of the estimates, and these averaged annual estimates were age-adjusted on the basis of the 2000 U.S. standard population. Joinpoint regression based on single years of data was used to analyze trends. Joinpoint regression uses permutation tests to identify points (i.e., joinpoints) where linear trends change significantly in direction or magnitude (e.g., zero joinpoints indicates a straight line).* The rate of change for each trend is tested to determine whether it is significantly different from zero, and each trend in the final model is described by an annual percentage change with a 95% confidence interval. Results were considered significant if p<0.05. The NHIS response rate for adult respondents over the entire 14-year period averaged 70.5% but ranged from 80.4% in 1997 to 60.8% in 2010.
From 1997 to 2010, the number of adults with self-reported diabetes and VI increased from 2.7 million to 3.9 million (p<0.001) (Figure 1). However, the crude percentage of adults with diabetes who reported VI decreased from 26.0% in 1997 to 18.6% in 2010 (p<0.001). The age-adjusted prevalence of self-reported VI among persons with diagnosed diabetes decreased from 23.7% to 16.7% (p<0.001). During this period, prevalence of self-reported VI declined significantly in all age groups examined except those aged 18--44 years. The age-adjusted prevalence declined significantly in all groups except blacks and persons diagnosed with diabetes <3 years before (Table). The age-adjusted VI prevalence declined significantly among adults with self-reported diabetes regardless of current insulin use or whether in the past 12 months they had had health insurance coverage or had seen an eye-care provider. Among those with a high school education or less, the age-adjusted VI prevalence declined significantly, from 26.4% in 1997 to 18.2% in 2005 (p=0.008) and then increased (but not significantly) to 20.7% in 2010 (p=0.17).
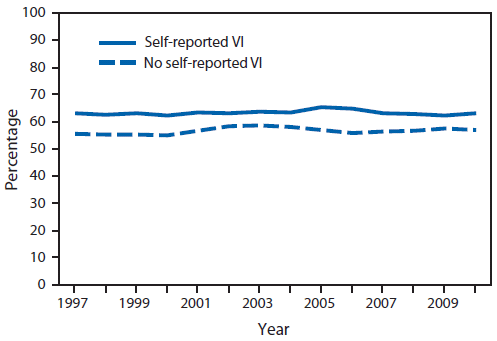
The percentage of adults with self-reported diabetes who reported annual contact with an eye-care provider remained constant throughout the period, regardless of VI status (Figure 2). During 1997-- 2010, reported annual contact with an eye-care provider was approximately 63% among persons with self-reported diabetes and VI, and approximately 57% among those with self-reported diabetes but no self-reported VI (63.1% versus 56.8% in 2010; p=0.21).
Reported by
Nilka R. Burrows, MPH, Israel A. Hora, MS, Yanfeng Li, MPH, Jinan B. Saaddine, MD, Div of Diabetes Translation, National Center for Chronic Disease Prevention and Health Promotion, CDC. Corresponding contributor: Nilka R. Burrows, nburrows@cdc.gov, 770-488-1057.
Editorial Note
This report highlights encouraging trends in the prevalence of self-reported VI among persons with diagnosed diabetes. From 1997 to 2010, although the number of adults with self-reported diabetes and VI increased, the percentage of adults who reported VI among those with self-reported diabetes declined. Similar declines in the age-adjusted prevalence of self-reported VI suggest that aging of the population had little effect on trends. Consistent with this finding, declining trends in severe diabetic retinopathy have been seen in patients with type 1 diabetes (3,4). The decline in self-reported VI prevalence among persons with diagnosed diabetes during 1997--2010 might be attributable, in part, to better control of VI risk factors (e.g., better blood glucose, blood pressure, and lipid control) (5), improved detection and treatment of eye problems, or other factors. An alternative explanation for the declining trend in self-reported VI is that the large and sustained increase of new cases of diabetes since the 1990s (6) might have led to a large number of persons who have not had diabetes long enough to develop VI. Once these patients have had diabetes long enough, the encouraging trends in self-reported VI prevalence might reverse. In addition, reported annual contact with eye-care providers among persons with self-reported diabetes and VI remained constant at approximately 63% during 1997--2010. This finding is consistent with previous studies and surveillance data, which indicate suboptimal levels of eye examination among persons with diabetes (6,7). An annual dilated eye examination is recommended for persons with diabetes (8). Continued efforts are needed to sustain and improve the declining trends in self-reported VI among persons with diagnosed diabetes, and effective strategies are needed to increase awareness about eye health and improve rates of recommended eye examinations in this population.
In 2010, nearly 26 million persons in the United States had diabetes, and 79 million adults were at high risk for developing type 2 diabetes (1). By 2050, given the current increasing trend in the number of persons with diagnosed diabetes (6), 16.0 million persons aged ≥40 years are projected to have diabetic retinopathy, 9.9 million will have cataracts, 3.4 million will have vision-threatening diabetic retinopathy, and 1.4 million will have glaucoma (8). However, persons with diabetes can take steps to control the disease and lower the risk for complications, and persons at high risk for diabetes can prevent or delay the onset of type 2 diabetes with weight loss and physical activity (1).
The findings in this report are subject to at least five limitations. First, NHIS excludes military personnel and persons in nursing homes and other institutions and does not include information on persons with undiagnosed diabetes. Second, NHIS data were self-reported. The validity of self-reported diagnosed diabetes is high (9). However, the validity of self-reported VI and access to eye-care providers among persons with diagnosed diabetes remains unclear. Third, NHIS data about access to eye-care providers does not capture recent advances in screening for diabetic retinopathy, such as digital fundus photography (or telemedicine), and thus might underestimate the level of recommended eye-care received by persons with diabetes (10). Fourth, VI severity could not be assessed. Finally, NHIS response rates averaged 70% but declined during 1997--2010. The potential impact this decline might have had on the trend analysis is unknown.
Although this report highlights encouraging trends in the prevalence of self-reported VI among persons with diagnosed diabetes, declines were not observed across all population subgroups, and the reported annual contact with eye-care providers remained suboptimal. Continued surveillance of VI among persons with diagnosed diabetes, risk factors for VI, and the level of care received by patients with diabetes, will help public health officials monitor and assess progress toward Healthy People 2020 national objectives for improving vision health.†
References
- CDC. National diabetes fact sheet: national estimates and general information on diabetes and prediabetes in the United States, 2011. Atlanta, GA: US Department of Health and Human Services, CDC, 2011. Available at http://www.cdc.gov/diabetes/pubs/factsheet11.htm. Accessed November 10, 2011.
- CDC. National Health Interview Survey. Questionnaires, datasets, and related documentation: 1997 to the present. Atlanta, GA: US Department of Health and Human Services, CDC, 2011. Available at http://www.cdc.gov/nchs/nhis/quest_data_related_1997_forward.htm. Accessed November 10, 2011.
- Kytö JP, Harjutsalo V, Forsblom C, et al. Decline in the cumulative incidence of severe diabetic retinopathy in patients with type 1 diabetes. Diabetes Care 2011;34:2005--7.
- Hovind P, Tarnow L, Rossing K, et al. Decreasing incidence of severe diabetic microangiopathy in type 1 diabetes. Diabetes Care 2003;26:1258--64.
- Imperatore G, Cadwell BL, Geiss L, et al. Thirty-year trends in cardiovascular risk factor levels among US adults with diabetes: National Health and Nutrition Examination Surveys, 1971--2000. Am J Epidemiol 2004;160:531--9.
- CDC. National Diabetes Surveillance System. Atlanta, GA: US Department of Health and Human Services, CDC; 2011. Available at http://apps.nccd.cdc.gov/ddtstrs/default.aspx. Accessed November 10, 2011.
- Kuo S, Fleming BB, Gittings NS, et al. Trends in care practices and outcomes among Medicare beneficiaries with diabetes. Am J Prev Med 2005;29:396--403.
- Saaddine JB, Honeycutt AA, Narayan KM, Zhang X, Klein R, Boyle JP. Projection of diabetic retinopathy and other major eye diseases among people with diabetes mellitus: United States, 2005--2050. Arch Ophthalmol 2008;126:1740--7.
- Saydah SH, Geiss LS, Tierney E, Benjamin SM, Engelgau M, Brancati F. Review of the performance of methods to identify diabetes cases among vital statistics, administrative, and survey data. Ann Epidemiol 2004;14:507--16.
- Liesenfeld B, Kohner E, Piehlmeier W, et al. A telemedical approach to the screening of diabetic retinopathy: digital fundus photography. Diabetes Care 2000;23:345--8.
* Additional information available at http://srab.cancer.gov/joinpoint.
† Additional information available at http://www.healthypeople.gov/2020/topicsobjectives2020/overview.aspx?topicid=42.
What is already known on this topic?
Diabetes can lead to visual impairment (VI) and blindness. Early detection and treatment of eye diseases, such as diabetic retinopathy and glaucoma, can reduce the risk for developing VI.
What is added by this report?
The prevalence of self-reported VI among adults with diagnosed diabetes has declined significantly, with age-adjusted rates decreasing from 23.7% in 1997 to 16.7% in 2010. However, throughout this period, reported annual contact with eye-care providers did not change and remained at approximately 63% among persons with self-reported diabetes and VI.
What are the implications for public health practice?
Surveillance of VI among persons with diabetes is important for evaluating the success of efforts to reduce diabetes complications. Continued awareness of the risk factors for diabetic eye diseases and interventions to improve eye care are needed to sustain and improve the declining trends in self-reported VI among persons with diabetes.
* Based on the 2000 U.S. standard population.
Alternate Text: The figure above shows the number of adults aged ≥18 years with self-reported diabetes and visual impairment (VI), and the percentage of adults aged ≥18 years with self-reported diabetes who also reported VI. These figures were for the United States, during 1997-2010, according to the National Health Interview Survey. From 1997 to 2010, the number of adults with self-reported diabetes and VI increased from 2.7 million to 3.9 million (p<0.001)
FIGURE 2. Age-adjusted* percentage of adults aged ≥18 years with self-reported diabetes who reported annual contact with an eye-care provider, by visual impairment (VI) status --- National Health Interview Survey, United States, 1997--2010
* Based on the 2000 U.S. standard population.
Alternate Text: The figure above shows the age-adjusted percentage of adults aged ≥18 years with self-reported diabetes who reported annual contact with an eye-care provider, by VI status, in the United States during 1997-2010, according to the National Health Interview Survey. The percentage of adults with self-reported diabetes who reported annual contact with an eye-care provider remained constant throughout the period regardless of VI status. During 1997- 2010, reported annual contact with an eye-care provider was approximately 63% among persons with self-reported diabetes and VI, and approximately 57% among those with self-reported diabetes but no self-reported VI (63.1% versus 56.8% in 2010; p=0.21).
Use of trade names and commercial sources is for identification only and does not imply endorsement by the U.S. Department of
Health and Human Services.
References to non-CDC sites on the Internet are
provided as a service to MMWR readers and do not constitute or imply
endorsement of these organizations or their programs by CDC or the U.S.
Department of Health and Human Services. CDC is not responsible for the content
of pages found at these sites. URL addresses listed in MMWR were current as of
the date of publication.
All MMWR HTML versions of articles are electronic conversions from typeset documents.
This conversion might result in character translation or format errors in the HTML version.
Users are referred to the electronic PDF version (http://www.cdc.gov/mmwr)
and/or the original MMWR paper copy for printable versions of official text, figures, and tables.
An original paper copy of this issue can be obtained from the Superintendent of Documents, U.S.
Government Printing Office (GPO), Washington, DC 20402-9371;
telephone: (202) 512-1800. Contact GPO for current prices.
**Questions or messages regarding errors in formatting should be addressed to
mmwrq@cdc.gov.
