Persons using assistive technology might not be able to fully access information in this file. For assistance, please send e-mail to: mmwrq@cdc.gov. Type 508 Accommodation and the title of the report in the subject line of e-mail.
Occupational Highway Transportation Deaths --- United States, 2003--2008
Highway transportation crashes are the leading cause of fatal injuries in the United States for both workers and the general population (1,2). Prevention of work-related highway transportation deaths, and highway transportation deaths in general, are long-standing public health priorities (1,3). To assess trends and help guide the prevention of occupational highway transportation deaths, CDC analyzed data from the Census of Fatal Occupational Injuries (CFOI) for 2003--2008 (2).
A total of 8,173 workers died from highway transportation incidents during 2003--2008, representing 24% of all fatal occupational injuries for the period. The annual average fatality rate for workers was 0.9 highway transportation deaths per 100,000 workers; that rate decreased an average of 2.8% annually during the period. Workers employed in the trucking industry accounted for the greatest number (2,320) and highest rate of highway transportation deaths (19.6 per 100,000 workers). Public health, highway safety, labor, and state agencies; highway designers; and transportation-related associations need to work together to implement effective interventions to reduce the risk for highway transportation deaths for all workers. Employers should adopt, communicate, and enforce safety policies designed to reduce highway transportation deaths (e.g., requiring the use of safety belts in fleet vehicles, restricting cellular telephone use while driving, and allowing for adequate travel time), and ensure these policies are followed by employees.
The U. S. Department of Labor Bureau of Labor Statistics (BLS) collects CFOI data on occupational injury deaths from multiple sources, including death certificates, police reports, and workers' compensation reports. To be included in CFOI, the decedent must have been working, working as a volunteer in a similar manner to a paid employee, or present at a site as a job requirement (2). Occupational highway transportation* deaths are defined as those events that involve a motorized or nonmotorized vehicle on a public roadway where the victim was the operator or passenger in the vehicle. Pedestrians struck by vehicles in or on the side of public roadways are excluded. Deaths while traveling between work locations are included; deaths while commuting to and from work is not. To calculate fatality rates, labor force denominator estimates were derived from the Current Population Survey (CPS) for U.S. workers aged ≥16 years (4). Workers aged <16 years, volunteers, and military personnel posted in the United States are included in the fatality counts but excluded from the fatality rate calculations because they are not included in the CPS. Trends and demographic differences were assessed using Poisson regression and significance set at α = 0.05.
During 2003--2008, a total of 8,173 occupational highway transportation deaths occurred in the United States (average: 1,362 per year) (Table 1), equating to an annual average fatality rate of 0.9 deaths per 100,000 workers. The fatality rate decreased an estimated 2.8% annually during the period (p=0.0268). Highway transportation fatality rates were highest among workers aged ≥65 years (2.1 deaths per 100,000 workers), followed by those aged 55--64 years (1.2 deaths per 100,000 workers). The fatality rate for males (1.6 deaths per 100,000 workers [p<0.0001]) was significantly greater than for females (0.2 deaths per 100,000 workers). American Indians or Alaska Natives had a highway transportation fatality rate of 1.8 per 100,000 workers. That rate was significantly greater than the rates seen for any other racial or ethnic group, which had rates of ≤1.0 (p<0.0001 for all comparisons).
The most common type of crash resulting in an occupational highway transportation death was a collision between two or more vehicles (4,009 deaths). Crashes between vehicles moving in opposite directions accounted for 38% (1,532) of these multiple-vehicle crash deaths (Table 1). The most common noncollision highway crashes involved jackknifed or overturned vehicles (1,551 deaths). Victims most often had been in a tractor-trailer (2,761 deaths) or automobile (1,353 deaths) at the time of the crash.
The transportation, warehousing, and utilities industry had the highest number (2,776) and crude rate (7.9 deaths per 100,000 workers) of occupational highway transportation deaths by industry (Table 2). Within that industry, truck transportation (i.e., trucking) accounted for 2,320 highway transportation deaths (average: 386 per year) and had the highest fatality rate (19.6 deaths per 100,000 workers) among the industry sectors. Government, which includes local, state, and federal workers, accounted for the second highest number of deaths (1,029), and logging had the second highest fatality rate (11.7 deaths per 100,000 workers). The finance and insurance industry had the lowest rate of occupational highway transportation deaths (<0.2 deaths per 100,000 workers) among the industry sectors.
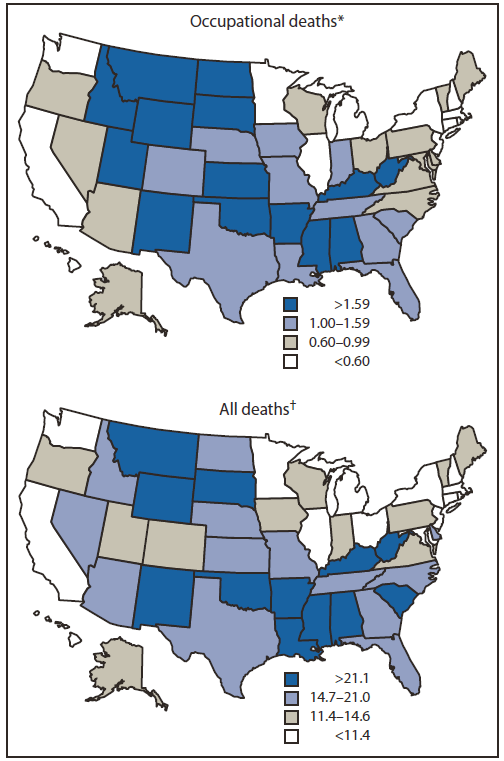
Occupational highway transportation fatality rates varied geographically during this 6-year period (Figure).† The highest rates (≥1.0 deaths per 100,000 workers) were concentrated in the Mountain, North West Central, and South regions of the United States.§ The lowest fatality rates (<1.0) were concentrated in the East North Central, Northeast, and Pacific regions. Wyoming had the highest highway transportation fatality rate (7.0), followed by Montana (3.3). The lowest rates were in Rhode Island and Massachusetts (0.2).
Reported by
Mandy K. Green, MPH, Oregon Public Health Div. Robert Harrison, MD, California Dept of Public Health. Kathy Leinenkugel, MPA, Iowa Dept of Public Health. Claire B. Nguyen, MS, Oklahoma State Dept of Health. Meredith Towle, Colorado Dept of Public Health and Environment. Todd Schoonover, PhD, Washington State Dept of Labor and Industries. Terry Bunn, PhD, Univ of Kentucky. Joyce Northwood, PhD, Bur of Labor Statistics, US Dept of Labor. Stephanie G. Pratt, PhD, John R. Myers, MS, Div of Safety Research, National Institute for Occupational Safety and Health, CDC. Corresponding contributor: John R. Myers, CDC, 304-285-6005, jrmyers@cdc.gov.
Editorial Note
Prevention of work-related highway deaths and injuries has long been a priority for CDC's National Institute for Occupational Safety and Health (NIOSH) (1). CDC recently has denoted highway transportation injury and fatality prevention as a public health "winnable battle" (3). In 2008, a total of 32,883 nonpedestrian highway deaths occurred in the United States, equating to a fatality rate of 10.8 deaths per 100,000 U.S. residents> (5).¶ Workers accounted for 1,215 of these highway deaths (Table 1), which made up 23.3% of all occupational deaths in 2008 (2). The rate of all highway transportation deaths declined an estimated 3.2% annually (p=0.0008) during 2003--2008 (5), a rate of decline slightly greater than the 2.8% annual decline for occupational highway transportation deaths reported in this analysis. Reasons for these declines are unclear, but might be related to the improved crashworthiness of vehicles, increases in safety belt use, or reductions in the number of workers driving and work-related miles driven during the recent economic recession.
Occupational highway transportation deaths differ from those among the general motoring public in terms of persons at risk, type of vehicle, and type of crash. Occupational highway transportation deaths pose the greatest risk to workers aged ≥55 years and to males (rate ratio: 8.4 compared with female workers) (Table 1). For transportation deaths overall in 2008, persons aged 16--24 years were at greatest risk, and males were at greater risk than females, although the relative difference was smaller (rate ratio: 2.6) (5). Contributing factors for work-related transportations deaths include fatigue and prescription drug use, which might be associated with age; roadway crash deaths overall are known to be associated with alcohol consumption, especially for drivers aged 16--24 years (1,5,6). Alcohol has not been shown to be a major contributor to work-related crashes involving large trucks (7), nor work-related crashes in general (1,6).
The majority of work-related highway transportation fatalities occurred among occupants of trucks (67% of deaths), especially tractor-trailers (34% of deaths), whereas occupants of passenger cars constituted the largest percentage of road traffic fatalities (40% of deaths) in 2008 (5). Occupational highway deaths involved a high number of collisions between two or more vehicles (49% of deaths) and noncollision incidents, especially jackknifed trucks and overturned vehicles (19% of deaths). For all road traffic fatalities during 2008, the most common crash types were collisions between vehicles (37%) and collisions between a vehicle and a fixed object (34%) (5). By state, risk patterns for occupational highway transportation deaths were similar to those for all road traffic fatalities (5) (Figure).
Workplace driving in the United States falls into two distinct categories: large trucks and buses, whose operation is regulated by the U.S. Department of Transportation (DOT),** and lighter-weight fleet or personal vehicles driven for work purposes, whose operation is largely unregulated by the federal government.†† A voluntary consensus standard (Safe practices for motor vehicle operations, ANSI Z15.1-2006) (8) outlines a comprehensive, corporate fleet motor-vehicle safety program, but the operation of lighter vehicles (including light trucks) in the workplace is governed primarily by state traffic laws and augmented by individual employer policies.
Modifiable behavioral and environmental risk factors for work-related highway transportation deaths include long hours of work, fatigue, sleepiness, occupational stress, time pressures, distracted driving, nonuse of safety belts, use of prescription and nonprescription medications, road design and maintenance, and motor vehicle safety technology (1,6). Employer commitment to road safety at the highest levels of management and a comprehensive, integrated approach to safety management at all supervisory levels are best-practice recommendations seen as essential ingredients in reducing the risk for work-related crashes (1,8--10).
The findings in this report are subject to at least four limitations. First, the cross-sectional nature of this analysis allows for identification of associations between exposure and incidents, but is only suggestive of risk factors. Second, CPS is a monthly survey of households and might underreport the employment of certain workers, especially those without permanent addresses or telephone access, or those who are undocumented. Underreporting in the workforce results in an overestimation of the occupational fatality rates provided in this report. Third, the fatality rates presented in this report do not account for the amount of time or distance workers spend on public roadways as part of their job duties. Using either as a denominator could provide a different assessment of risk between industries and demographic variables. Such data are not available for all workers in the United States. Finally, CFOI includes cases determined to be in work status but excludes those in commuter status. These determinations are difficult where the work relationship might not be clear, or when the distinction between traveling between job sites and commuting is unclear.
Preventing workplace crashes rests on worker compliance with regulations and traffic laws, supplemented by best-practice safety initiatives by employers (8). Under these recognized practices, employers should prioritize road traffic safety and initiate activities such as implementation and enforcement of policies that require use of safety belts and prohibit unsafe behaviors such as impaired driving and use of cellular phones and other mobile devices that might distract the driver while the vehicle is in motion. Proposed strategies for fatigue management focus on flexible voluntary programs to supplement regulatory requirements, route and trip planning to reduce stress and fatigue, and in-vehicle monitoring and feedback. Other recommended injury prevention practices include rigorous driver selection and training procedures as part of a comprehensive driver management program, prehire checks of employee driving records and periodic checks thereafter, continuing risk assessment of drivers, selection of fleet vehicles with high levels of occupant protection and advanced safety features, and collection of fleet safety performance indicators (8--10).
References
- CDC. Work-related roadway crashes, challenges and opportunities for prevention. Cincinnati, OH: US Department of Health and Human Services, CDC, National Institute for Occupational Safety and Health; 2003. Available at http://www.cdc.gov/niosh/docs/2003-119/pdfs/2003-119.pdf. Accessed February 23, 2011.
- US Bureau of Labor Statistics. Census of fatal occupational injuries summary, 2009. Washington, DC: US Department of Labor, US Bureau of Labor Statistics; 2010. Available at http://www.bls.gov/news.release/cfoi.nr0.htm. Accessed February 23, 2011.
- CDC. CDC's winnable battles. Atlanta, GA: US Department of Health and Human Services, CDC; 2010. Available at http://www.cdc.gov/about/winnablebattles.htm. Accessed February 23, 2011.
- Bureau of Labor Statistics. Current population survey, 1998--2007 (microdata files) and labor force, employment, and unemployment from the current population survey. In: BLS handbook of methods. Washington, DC: US Department of Labor, Bureau of Labor Statistics; 2008. Available at http://www.bls.gov/cps/home.htm. Accessed February 23, 2011.
- National Highway Traffic Safety Administration. Traffic safety facts 2008. Washington, DC: US Department of Transportation, National Highway Traffic Safety Administration; 2009. DOT-HS-811-170. Available at
http://www-nrd.nhtsa.dot.gov/pubs/811170.pdf . Accessed February 23, 2011.
- Robb G, Sultana S, Ameratunga S, Jackson R. A systematic review of epidemiological studies investigating risk factors for work-related road traffic crashes and injuries. Inj Prev 2008;14:51--8.
- Federal Motor Carrier Safety Administration. Report to Congress on the large truck crash causation study. Washington, DC: US Department of Transportation, Federal Motor Carrier Safety Administration; 2006. MC-R/MC-RRA. Available at http://www.fmcsa.dot.gov/facts-research/research-technology/report/ltccs-2006.htm. Accessed April 25, 2011.
- American National Standards Institute, American Society of Safety Engineers. Safe practices for motor vehicle operations. New York, NY: American National Standards Institute; Des Plaines, IL: American Society of Safety Engineers; 2006. ANSI/ASSE Z15.1-2006.
- Haworth N, Tingvall C, Kowadlo N. Review of best practice road safety initiatives in the corporate and/or business environment. Clayton, Victoria, Australia: Monash University Accident Research Centre; 2000. MUARC report No. 166.
- Newnam S, Griffin MA, Mason C. Safety in work vehicles: a multilevel study linking safety values and individual predictors to work-related driving crashes. J Appl Psych 2008;93:632--44.
What is already known on this topic?
Highway transportation crashes are the leading cause of occupational fatalities in the United States.
What is added by this report?
Occupational highway transportation fatality rates declined 2.8% annually during 2003--2008, and groups at greatest risk for occupational highway transportation deaths (e.g., workers aged ≥55 years and truck occupants) differ from those identified for highway transportation deaths in the general motoring public.
What are the implications for public health practice?
Employers need to know more about the fatality risks to workers from highway transportation crashes, and employer-based strategies (e.g., requiring the use of safety belts in fleet vehicles, restricting cellular telephone use while driving, and allowing for adequate travel time) should be disseminated and implemented more widely.
|
Characteristic
|
No. of workers employed (cumulative)*
|
Highway fatal injuries†
|
Rate ratio
|
Standard error
|
|
No.
|
Rate§
|
|
Year
|
|
2003
|
137,736,000
|
1,353
|
0.96
|
1.17
|
0.04
|
|
2004
|
139,252,000
|
1,398
|
0.98
|
1.20
|
0.05
|
|
2005
|
141,730,000
|
1,437
|
0.99
|
1.21
|
0.05
|
|
2006
|
144,427,000
|
1,356
|
0.92
|
1.12
|
0.04
|
|
2007
|
146,047,000
|
1,414
|
0.94
|
1.15
|
0.04
|
|
2008
|
145,362,000
|
1,215
|
0.82
|
1.00
|
---
|
|
Sex
|
|
Male
|
457,071,000
|
7,402
|
1.59
|
8.37
|
0.31
|
|
Female
|
397,482,000
|
771
|
0.19
|
1.00
|
---
|
|
Age group (yrs)
|
|
<16
|
---
|
20
|
---
|
---
|
---
|
|
16--24
|
117,869,000
|
709
|
0.56
|
1.00
|
---
|
|
25--34
|
185,506,000
|
1,477
|
0.77
|
1.38
|
0.06
|
|
35--44
|
206,419,000
|
1,878
|
0.90
|
1.61
|
0.06
|
|
45--54
|
200,734,000
|
2,007
|
0.99
|
1.77
|
0.07
|
|
55--64
|
112,587,000
|
1,408
|
1.23
|
2.20
|
0.09
|
|
≥65
|
31,439,000
|
674
|
2.11
|
3.77
|
0.18
|
|
Race/Ethnicity¶
|
|
White
|
597,950,000
|
6,008
|
0.98
|
1.00
|
---
|
|
Black
|
89,535,000
|
910
|
1.01
|
1.03
|
0.03
|
|
American Indian or Alaska Native
|
4,040,000
|
73
|
1.76
|
1.80
|
0.19
|
|
Asian
|
37,670,000
|
131
|
0.34
|
0.35
|
0.03
|
|
Other or multiple races
|
15,124,000
|
53
|
0.34
|
0.35
|
0.06
|
|
Hispanic
|
114,275,000
|
998
|
0.87
|
0.89
|
0.03
|
|
Type of event
|
|
Collisions between vehicles
|
854,554,000
|
4,009
|
0.46
|
---
|
---
|
|
Reentry to roadway
|
---
|
52
|
---
|
---
|
---
|
|
Moving in same direction
|
---
|
932
|
---
|
---
|
---
|
|
Moving in opposite direction
|
---
|
1,532
|
---
|
---
|
---
|
|
Moving in an intersection
|
---
|
798
|
---
|
---
|
---
|
|
Moving and stationary vehicle-in roadway
|
---
|
320
|
---
|
---
|
---
|
|
Moving and stationary vehicle-side of roadway
|
---
|
141
|
---
|
---
|
---
|
|
Other or unspecified collisions between vehicles
|
---
|
234
|
---
|
---
|
---
|
|
Vehicle striking other objects
|
854,554,000
|
2,158
|
0.25
|
---
|
---
|
|
Noncollision
|
854,554,000
|
1,848
|
0.21
|
---
|
---
|
|
Jackknife/Overturn
|
---
|
1,551
|
---
|
---
|
---
|
|
Ran off roadway
|
---
|
120
|
---
|
---
|
---
|
|
Other or unspecified
|
---
|
152
|
---
|
---
|
---
|
|
Other or unspecified
|
854,554,000
|
158
|
0.02
|
---
|
---
|
|
Primary vehicle involved
|
|
Highway vehicles
|
854,554,000
|
7,847
|
0.90
|
---
|
---
|
|
Automobile
|
---
|
1,353
|
---
|
---
|
---
|
|
Bus
|
---
|
85
|
---
|
---
|
---
|
|
Motorcycle, moped
|
---
|
146
|
---
|
---
|
---
|
|
Delivery truck
|
---
|
294
|
---
|
---
|
---
|
|
Dump truck
|
---
|
278
|
---
|
---
|
---
|
|
Pickup truck
|
---
|
1,187
|
---
|
---
|
---
|
|
Semitrailer, tractor trailer
|
---
|
2,761
|
---
|
---
|
---
|
|
Other or unspecified trucks
|
---
|
986
|
---
|
---
|
---
|
|
Vans
|
---
|
599
|
---
|
---
|
---
|
|
Other or unspecified highway vehicles
|
---
|
158
|
---
|
---
|
---
|
|
All other vehicles
|
854,554,000
|
326
|
0.03
|
---
|
---
|
|
Total
|
854,554,000
|
8,173
|
0.94
|
---
|
---
|
|
Industry sector*
|
No. of workers in sector (cumulative)†
|
Highway fatal injuries§
|
|
No.§
|
Rate¶
|
|
Agriculture, forestry, fishing, hunting
|
12,817,000
|
502
|
3.83
|
|
Logging
|
650,000
|
76
|
11.69
|
|
Agricultural and forest services
|
894,000
|
50
|
5.59
|
|
Mining
|
3,914,000
|
221
|
5.65
|
|
Oil, gas extraction
|
509,000
|
29
|
5.70
|
|
Support activities for mining
|
2,044,000
|
161
|
7.88
|
|
Construction
|
63,901,000
|
871
|
1.36
|
|
Manufacturing
|
97,719,000
|
380
|
0.39
|
|
Wholesale
|
26,583,000
|
488
|
1.84
|
|
Petroleum products
|
805,000
|
69
|
8.57
|
|
Farm supplies
|
346,000
|
18
|
5.16
|
|
Retail
|
98,651,000
|
418
|
0.42
|
|
Transport, warehousing, utilities
|
35,034,000
|
2,776
|
7.91
|
|
Truck transportation
|
11,797,000
|
2,320
|
19.62
|
|
Taxi and limousine services
|
1,365,000
|
93
|
6.81
|
|
Information
|
20,036,000
|
176
|
0.86
|
|
Finance, insurance
|
41,821,000
|
70
|
0.17
|
|
Real estate
|
17,955,000
|
89
|
0.50
|
|
Professional, technical services
|
51,304,000
|
116
|
0.23
|
|
Administrative, waste services
|
34,700,000
|
470
|
1.35
|
|
Waste management
|
2,035,000
|
172
|
8.45
|
|
Education, health services
|
115,357,000
|
221
|
0.19
|
|
Leisure, hospitality
|
70,247,000
|
150
|
0.20
|
|
Other services
|
41,582,000
|
176
|
0.40
|
|
Government
|
122,929,000
|
1,029
|
0.72
|
|
Total
|
854,554,000
|
8,173
|
0.94
|
FIGURE. Fatality rates for occupational highway transportation deaths and all highway transportation deaths --- United States, 2003--2008
Alternate Text: The figure above shows fatality rates for occupational highway transportation deaths and all highway transportation deaths in the United States, from 2003-2008. Occupational highway transportation fatality rates var¬ied geographically during this 6-year period.