FIGURE 1. Number* and percentage of respiratory specimens testing positive for influenza reported by World Health Organization and National Respiratory and Enteric Virus Surveillance System collaborating laboratories, by type, subtype, and surveillance week --- United States, October 3--December 11, 2010
Persons using assistive technology might not be able to fully access information in this file. For assistance, please send e-mail to: mmwrq@cdc.gov. Type 508 Accommodation and the title of the report in the subject line of e-mail.
Update: Influenza Activity --- United States, October 3--December 11, 2010
During October 3--December 11, 2010, influenza activity remained low in most regions of the United States. Influenza viruses characterized thus far in the influenza season are well matched to the strains included in the 2010--11 influenza vaccine. This report summarizes U.S. influenza activity* during this period.
Viral Surveillance
During October 3--December 11, approximately 140 World Health Organization (WHO) and National Respiratory and Enteric Virus Surveillance System collaborating laboratories in the United States tested 42,497 respiratory specimens for influenza viruses; 2,807 (6.6%) were positive (Figure 1). Of these, 1,598 (57%) were influenza A viruses, and 1,209 (43%) were influenza B viruses. A total of 805 (50%) of the 1,598 influenza A viruses were subtyped; 679 (84%) of these were influenza A (H3) viruses, and 126 (16%) were 2009 influenza A (H1) viruses. Influenza virus--positive tests have been reported from 48 states and the District of Columbia and in all 10 of the surveillance regions since October 3. However, of the 2,807 influenza positive tests reported to CDC so far this season, most (1,778 [63%]) have been reported from Region 4 (southeastern United States). Region 4 is the only region where influenza B viruses have been reported more frequently than influenza A viruses. Influenza B viruses from Region 4 account for 1,034 (58%) of the influenza-positive tests reported from the region and 86% of all influenza B viruses reported for the country.
Antigenic Characterization
WHO collaborating laboratories in the United States are requested to submit a subset of their influenza-positive respiratory specimens to CDC for further antigenic characterization. CDC has antigenically characterized 89 influenza viruses collected by U.S. laboratories during the 2010--11 season, including 13 2009 influenza A (H1N1), 26 influenza A (H3N2), and 50 influenza B viruses. All viruses were antigenically related to the components included in the 2010--11 influenza vaccine: A/California/7/2009-like (H1N1), A/Perth/16/2009-like (H3N2), and B/Brisbane/60/2008-like.
Antiviral Resistance of Influenza Virus Isolates
Since October 1, a total of 104 influenza viruses have been tested for antiviral resistance. Of the 17 2009 influenza A (H1N1), 33 influenza A (H3N2), and 54 influenza B viruses tested, all were sensitive to both oseltamivir and zanamivir.
Novel Influenza A Viruses
Three cases of human infection with a novel influenza A virus were reported during November and December, one each from Wisconsin, Pennsylvania, and Minnesota. Onset of the illnesses occurred in September, October, and November, respectively. All three patients were infected with swine-origin influenza A (H3N2) viruses. Two of the three cases occurred in adults, and the third occurred in a child. Two of the three patients were hospitalized; all three have fully recovered from their illness. The three cases are not related, and influenza viruses recovered from each of these cases were similar but not identical, indicating that they did not come from a common source. All three patients had either contact with swine or lived in areas close to swine farms. No evidence of human-to-human transmission of these viruses was identified in the first two cases, and investigation of the third case is ongoing.
State-Specific Activity Levels
For the week ending December 11, influenza activity† was reported as regional in four states and Puerto Rico. Twenty states reported local activity, and 21 additional states as well as the District of Columbia and U.S. Virgin Islands reported sporadic activity. Five states and Guam reported no influenza activity. No states have reported geographically widespread influenza activity to date for the 2010--11 influenza season.
Outpatient Influenza-Like Illness
Since October 3, the weekly percentage of outpatient visits for influenza-like illness (ILI)§ reported by the approximately 1,500 U.S. Outpatient ILI Surveillance Network (ILINet) weekly reporters in 50 states, New York City, Chicago, and the District of Columbia that comprise ILINet, has ranged from 1.1% to 1.9%, which is below the national baseline of 2.5% (Figure 2). On a regional level, only Region 4 has reported ILI at or above their respective region-specific baseline, and that was for a single week that ended on November 27.¶
Data collected in ILINet also are used to produce a measure of ILI activity by state. Activity levels are based on the percentage of outpatient visits in a state for ILI and are compared to the average percentage of ILI visits that occur during spring and fall weeks with little or no influenza virus circulation. Activity levels range from minimal, which would correspond to ILI activity from outpatient clinics being at or below the average, to high, which would correspond to ILI activity from outpatient clinics being much higher than the average. Because the clinical definition of ILI is very general, not all ILI is caused by influenza; however, when combined with laboratory data, the information on ILI activity provides a clear picture of influenza activity in the United States.
Since October 3, only two states, Georgia and Alabama, have experienced high levels of ILI activity. No other state has reported a level of activity higher than low.
Aggregate Hospitalization and Death Reporting Activity (AHDRA)
The AHDRA system, which was implemented during the 2009 pandemic and has continued on a voluntary basis for the 2010--11 influenza season, tracks weekly counts of laboratory-confirmed influenza-associated hospitalizations and deaths. An average of 24 jurisdictions have provided reports on laboratory-confirmed influenza-associated hospitalizations, and an average of 22 jurisdictions have provided reports on laboratory-confirmed influenza-associated deaths per week this season. During October 3--December 11, a total of 497 laboratory-confirmed influenza-associated hospitalizations and 12 laboratory-confirmed influenza-associated deaths were reported to CDC.
Pneumonia- and Influenza-Related Mortality
For the week ending December 11, pneumonia and influenza (P&I) was reported as an underlying or contributing cause of death for 6.9% of all deaths reported to the 122-Cities Mortality Reporting System. This percentage is below the epidemic threshold of 7.3% for that week. During October 3--December 11, the weekly percentage of deaths attributed to P&I ranged from 6.0% to 7.0%, remaining below the epidemic threshold.**
Influenza-Related Pediatric Mortality
Two influenza-related pediatric deaths have been reported for the 2010--11 season, one each from Texas and New York. One death was associated with an influenza A (H3) virus and the other with an influenza A virus for which the subtype was not determined. Both children were aged <5 years and had bacterial coinfections, but no chronic medical conditions were reported.
Reported by
WHO Collaborating Center for Surveillance, Epidemiology, and Control of Influenza. L Brammer, MPH, S Epperson, MPH, K Kniss, MPH, D Mustaquim, MPH, A Bishop, MPH, R Dhara, MPH, M Jhung, MD, T Wallis, MS, L Finelli, DrPH, L Gubareva, PhD, J Bresee, MD, A Klimov, PhD, N Cox, PhD, Influenza Div, National Center for Immunization and Respiratory Diseases.
Editorial Note
Influenza activity in the United States during October 3--December 11 was low overall, with cocirculation of influenza A (H3N2), 2009 A (H1N1), and B viruses. Regional differences in influenza activity have been noted, with the highest levels seen in the southeastern states, where influenza B viruses have predominated. Influenza activity likely will continue to increase in the weeks ahead. During the 2009--10 season, as a result of pandemic 2009 influenza A (H1N1) circulation, influenza activity peaked unusually early (late October); however, during 22 of the 27 influenza seasons before the 2009--10 season, influenza activity peaked in January or later (1). Health-care providers should offer influenza vaccination throughout the influenza season to protect as many persons as possible from influenza virus infection and its complications.
Although influenza activity has been low nationwide, the first pediatric influenza-associated deaths of the 2010--11 season have been reported, and influenza-associated deaths also have been reported among adults through the AHDRA system. Health-care providers are reminded to consider influenza infection in the differential diagnosis of persons hospitalized with acute respiratory illness, including those with clinical or radiologically confirmed pneumonia. Influenza antiviral medication treatment is recommended for persons with suspected or laboratory-confirmed influenza illness who 1) are hospitalized; 2) have a severe, progressive, or complicated illness course; or 3) are at increased risk for influenza-related complications (e.g. persons with asthma, pregnant women, children aged <2 years, and adults aged ≥65 years) (2). If influenza diagnostic testing is performed, antiviral treatment should not be delayed pending test results because the benefit of antiviral treatment is greatest when started within the first 2 days of illness (2,3). Additional information regarding use of influenza antiviral medications is available online.††
Health-care providers should be alerted to the possibility of bacterial coinfection among children and adults with influenza and request bacterial cultures if pneumonia is suspected. Clinicians should be aware of the possibility of coinfection with Staphylococcus aureus (including methicillin-resistant strains) in persons with influenza when choosing empiric antibiotic therapy for patients with suspected influenza-related pneumonia. In addition, health-care providers are asked to contact their local or state health department as soon as possible when deaths associated with laboratory-confirmed influenza occur among children.
Three human infections with swine-origin influenza A (H3N2) virus have been identified since October, increasing the total number of detections of human infections with this virus to six during 2009 and 2010. The increase in detection of this virus might have resulted, in part, from changes in testing methods implemented at state public health laboratories at the start of the 2009 influenza A (H1N1) pandemic to allow for detection of swine-origin influenza A viruses (4,5). Before the pandemic, recognition of swine-origin influenza A (H3N2) virus infection in humans was possible only for the small subset of viruses for which detailed antigenic or genetic analysis was performed. The continued detection of transmission of influenza viruses from swine to humans and the earlier detections of outbreaks in swine herds resulting from the transmission of 2009 H1N1 infection from humans (6) illustrates the importance of continued influenza surveillance among both human and animal populations. Thorough investigations of all cases of novel influenza virus infections are important to rule out sustained human-to-human transmission. Clinical laboratories that identify viruses that cannot be subtyped should contact their state laboratories. State or local health departments are urged to contact CDC immediately if they detect an influenza virus thought to be of animal origin or any influenza A virus that cannot be subtyped with the influenza reagents currently available.
CDC continues year-round influenza surveillance to provide information needed to ensure up-to-date recommendations regarding prevention and treatment of influenza. Influenza surveillance reports for the United States are posted online weekly during October--May and are available on the CDC website.§§ Additional information regarding influenza viruses, surveillance, diagnosis, vaccine, and antiviral medications, and novel influenza A infections in humans also is available from CDC.¶¶
Acknowledgments
This report is based, in part, on data contributed by participating state and territorial health departments and state public health laboratories, World Health Organization collaborating laboratories, National Respiratory and Enteric Virus Surveillance System collaborating laboratories, the U.S. Outpatient ILI Surveillance Network, the Aggregate Hospitalization and Death Reporting Activity system, the Influenza Associated Pediatric Mortality Surveillance System, and the 122 Cities Mortality Reporting System.
References
- CDC. Update: influenza activity---United States, August 30, 2009--January 9, 2010. MMWR 2010;59:38--43.
- CDC. 2010--2011 Influenza antiviral medications: summary for clinicians. Available at http://www.cdc.gov/flu/professionals/antivirals/summary-clinicians.htm. Accessed December 16, 2010.
- Jain S, Kamimoto L, Bramley AM, et al. Hospitalized patients with 2009 H1N1 influenza in the United States, April--June 2009. N Engl J Med 2009;361:1935--44.
- Jernigan DB, Lindstrom SL, Johnson JR. Detecting 2009 pandemic influenza A (H1N1) virus infection: availability of diagnostic testing led to rapid pandemic response. Clin Infect Dis 2011;52(Suppl 1):S36--43.
- Medical devices and flu emergencies. Emergency use authorization for CDC human influenza virus real-time RT-PCR detection and characterization panel with additional specimens and reagents. Available at http://www.fda.gov/medicaldevices/safety/emergencysituations/ucm161496.htm.
- Pasma T, Joseph T. Pandemic (H1N1) 2009 infection in swine herds, Manitoba, Canada. Emerg Infect Dis 2010;16:706--8.
* The CDC influenza surveillance system collects five categories of information from nine data sources: 1) viral surveillance (World Health Organization collaborating U.S. laboratories, the National Respiratory and Enteric Virus Surveillance System, and novel influenza A virus case reporting), 2) outpatient illness surveillance (U.S. Outpatient ILI Surveillance Network), 3) mortality (122 Cities Mortality Reporting System, Aggregate Hospitalization and Death Reporting Activity, and influenza-associated pediatric mortality reports), 4) hospitalizations (Emerging Infections Program and Aggregate Hospitalization and Death Reporting Activity), and 5) summary of geographic spread of influenza (state and territorial epidemiologist reports).
† Levels of activity are 1) no activity; 2) sporadic: isolated laboratory-confirmed influenza cases or a laboratory-confirmed outbreak in one institution, with no increase in activity; 3) local: increased ILI, or at least two institutional outbreaks (ILI or laboratory-confirmed influenza) in one region with recent laboratory evidence of influenza in that region; virus activity no greater than sporadic in other regions; 4) regional: increased ILI activity or institutional outbreaks (ILI or laboratory-confirmed influenza) in at least two but less than half of the regions in the state with recent laboratory evidence of influenza in those regions; and 5) widespread: increased ILI activity or institutional outbreaks (ILI or laboratory-confirmed influenza) in at least half the regions in the state, with recent laboratory evidence of influenza in the state.
§ Defined as a temperature of ≥100.0°F (≥37.8°C), oral or equivalent, and cough or sore throat, in the absence of a known cause other than influenza.
¶ The national and regional baselines are the mean percentage of visits for ILI during noninfluenza weeks for the previous three seasons plus two standard deviations. A noninfluenza week is a week during which <10% of specimens tested positive for influenza. National and regional percentages of patient visits for ILI are weighted on the basis of state population. Use of the national baseline for regional data is not appropriate.
** The seasonal baseline proportion of P&I deaths is projected using a robust regression procedure in which a periodic regression model is applied to the observed percentage of deaths from P&I that were reported by the 122 Cities Mortality Reporting System during the preceding 5 years. The epidemic threshold is 1.645 standard deviations above the seasonal baseline.
†† Available at http://www.cdc.gov/flu/professionals/antivirals.
§§ Available at http://www.cdc.gov/flu/weekly/fluactivity.htm.
¶¶ Available at http://www.cdc.gov/flu.
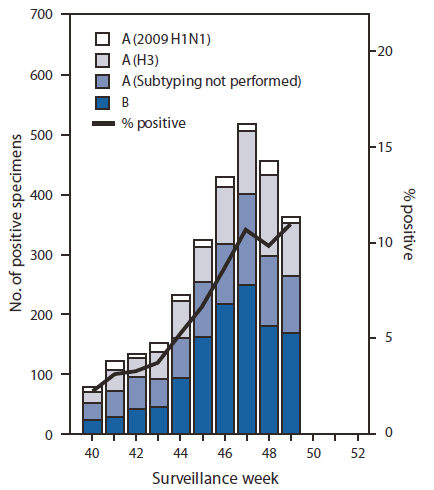
* N = 2,807.
Alternate Text: The figure above shows the number and percentage of respiratory specimens testing positive for influenza reported by World Health Organization and National Respiratory and Enteric Virus Surveillance System collaborating laboratories, by type, subtype, surveillance week, and year in the United States from October 3-December 11, 2010.
FIGURE 2. Percentage of visits for influenza-like illness (ILI) reported by the U.S. Outpatient Influenza-Like Illness Surveillance Network (ILINet), by surveillance week --- United States, September 30, 2007, through December 11, 2010
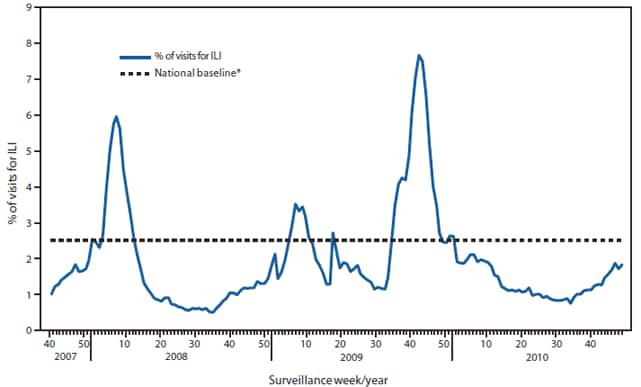
* The national baseline is the mean percentage of visits for ILI during noninfluenza weeks for the previous three seasons plus two standard deviations. A noninfluenza week is a week during which <10% of speciments tested positive for influenza. Use of the national baseline for regional data is not appropriate.
Alternate Text: The figure above shows the percentage of visits for influenza-like illness (ILI). Data was reported by the U.S. Outpatient Influenza-Like Illness Surveillance Network (ILINet), by surveillance week in the United States, from September 30, 2007 through December 11, 2010.
Use of trade names and commercial sources is for identification only and does not imply endorsement by the U.S. Department of
Health and Human Services.
References to non-CDC sites on the Internet are
provided as a service to MMWR readers and do not constitute or imply
endorsement of these organizations or their programs by CDC or the U.S.
Department of Health and Human Services. CDC is not responsible for the content
of pages found at these sites. URL addresses listed in MMWR were current as of
the date of publication.
All MMWR HTML versions of articles are electronic conversions from typeset documents.
This conversion might result in character translation or format errors in the HTML version.
Users are referred to the electronic PDF version (http://www.cdc.gov/mmwr)
and/or the original MMWR paper copy for printable versions of official text, figures, and tables.
An original paper copy of this issue can be obtained from the Superintendent of Documents, U.S.
Government Printing Office (GPO), Washington, DC 20402-9371;
telephone: (202) 512-1800. Contact GPO for current prices.
**Questions or messages regarding errors in formatting should be addressed to
mmwrq@cdc.gov.
