Persons using assistive technology might not be able to fully access information in this file. For assistance, please send e-mail to: mmwrq@cdc.gov. Type 508 Accommodation and the title of the report in the subject line of e-mail.
Incidence of End-Stage Renal Disease Attributed to Diabetes Among Persons With Diagnosed Diabetes --- United States and Puerto Rico, 1996--2007
During 2007, approximately 110,000 persons in the United States and Puerto Rico began treatment for end-stage renal disease (ESRD) (i.e., kidney failure requiring dialysis or transplantation) (1). Diabetes is the leading cause of ESRD in the United States, accounting for 44% of new cases in 2007 (1). Although the number of persons initiating treatment for kidney failure each year who have diabetes listed as a primary cause (ESRD-D) has increased since 1996 (1,2), ESRD-D incidence among persons with diagnosed diabetes has declined since 1996 (3). To determine whether this decline occurred in every U.S. region and in every state, CDC analyzed 1996--2007 data from the U.S. Renal Data System (USRDS) and the Behavioral Risk Factor Surveillance System (BRFSS). During the period, the age-adjusted rate of ESRD-D among persons with diagnosed diabetes declined 35% overall, from 304.5 to 199.1 per 100,000 persons with diagnosed diabetes, and declined in all U.S. regions and in most states. No state showed a significant increase in the age-adjusted ESRD-D rate. Continued awareness of risk factors for kidney failure and interventions to improve diabetes care are needed to sustain and improve these trends.
USRDS collects, analyzes, and distributes ESRD clinical and claims data to the Centers for Medicare and Medicaid Services (CMS) (1). Health-care providers are required by law to complete the CMS Medical Evidence Report for each new patient with ESRD. USRDS collects demographic data and ESRD-related information (e.g., date patients were first treated, diagnosed primary cause of renal failure). The USRDS Renal Data Extraction and Referencing System, an online data querying application, was used to determine the number of persons initiating ESRD treatment (i.e., dialysis or transplantation) with diabetes listed as a primary cause in each state, the District of Columbia (DC), and Puerto Rico for each of the years during 1996--2007. Throughout the period, the proportion of new ESRD cases that were ESRD-D ranged from 43% to 45% (1). Incidence of ESRD-D was calculated at a state/territorial and U.S. census region level by dividing the number of persons with a new diagnosis of ESRD-D in the geographic unit (determined by their initiation of treatment) by the estimated number of persons with diagnosed diabetes in the geographic unit. The number of persons aged ≥18 years with diagnosed diabetes was estimated from BRFSS, which conducts state-based, random-digit--dialed telephone surveys in the 50 states, DC, Puerto Rico, and other U.S. territories. In 2007, the median BRFSS response rate was 50.6% (range: 26.9%--65.4%) for the 50 states and DC and 70.4% for Puerto Rico.
Respondents were classified as having diagnosed diabetes if they answered "yes" to the question "Has a doctor ever told you that you have diabetes?" Women who were told that they had diabetes only during pregnancy were classified as not having diabetes. BRFSS data were weighted to represent the noninstitutionalized U.S. population. Data were analyzed using statistical software to estimate standard errors and calculate 95% confidence intervals (CIs). Incidence was age adjusted directly to the 2000 U.S. standard population, and weighted least squares regression was used for state and regional-level trend analyses. Linear and quadratic terms were included in the models, and results were considered significant if p<0.05. Nonsignificant quadratic terms were dropped from the models. Significant terms indicated a trend (i.e., linear or nonlinear) in the data over time.
During 1996--2007, the total number of adults aged ≥18 years in the United States and Puerto Rico who began treatment for ESRD-D each year increased significantly, from 32,716 (state range: 32−3,719) to 48,712 (state range: 37--6,059) (test for trend, p<0.001) (Table, Figure 1). More recently, the number of ESRD-D cases appears to be leveling off (Figure 1). During 2007, approximately 40% of the new ESRD-D cases occurred in the South, and approximately 20% occurred in each of the other three U.S. census regions (Table).* However, the rate of ESRD-D among persons with diagnosed diabetes in 2007 was significantly higher in the West (219.2 per 100,000) compared with the Northeast (182.6 per 100,000). During 1996--2007, the age-adjusted ESRD-D incidence in persons with diagnosed diabetes decreased 35%, from 304.5 per 100,000 (state range: 152.7--544.4) to 199.1 per 100,000 (state range: 108.1--450.0) (p<0.001) (Table, Figure 1). Incidence declined significantly in all U.S. regions (Figure 2). Estimated age-adjusted ESRD-D incidence declined in most states, but the trend was not significant in every state (Table). The age-adjusted ESRD-D incidence in Puerto Rico increased significantly from 1996 to 2003 (p<0.001), and decreased, but not significantly, from 2003 to 2007 (p=0.30).
Reported by
NR Burrows, MPH, I Hora, MS, P Cho, MPH, RB Gerzoff, MS, LS Geiss, MA, Div of Diabetes Translation, National Center for Chronic Disease Prevention and Health Promotion, CDC.
Editorial Note
ESRD is a costly and disabling condition that can result in premature death (1). During 1996--2007, the number of ESRD-D cases increased, as did the number of persons with diagnosed diabetes (2). However, during this period, the rate of increase in the number of persons with diagnosed diabetes was greater than the rate of increase in the number of ESRD-D cases. Thus, among persons with diagnosed diabetes, the age-adjusted ESRD-D rate decreased during the period by 35%, from 304.5 to 199.1 per 100,000 persons with diagnosed diabetes. The age-adjusted ESRD-D incidence also declined in all U.S. regions and in most states. Consistent with this finding, similar declining trends have been seen for other diabetes-related complications, such as lower-extremity amputation and visual impairment (2). Reasons for this decline in ESRD-D incidence cannot be determined from surveillance data but might include reductions in risk factors for kidney failure (e.g., hyperglycemia and hypertension) (4,5) or better treatment of kidney disease, including the use of new pharmacologic agents (e.g., angiotensin-converting enzyme inhibitors [ACEIs] or angiotensin-receptor blockers [ARBs]) that slow the decline in kidney function and thus delay ESRD-D (1,6). In 2007, nearly 80% of persons aged 20--64 years with diabetes and chronic kidney disease used ACEIs or ARBs (1).
Although age-adjusted ESRD-D incidence in the United States has declined, the number of newly diagnosed cases has increased, and that trend likely will continue as the U.S. population ages and as the number of persons with diabetes increases (2). Furthermore, control of ESRD risk factors remains suboptimal (7,8), and strategies are needed to sustain declines in ESRD-D incidence to reduce the future ESRD burden. In addition to diabetes and hypertension, risk factors for kidney disease include cardiovascular disease, obesity, elevated cholesterol, increasing age, and a family history of kidney disease (1). Effective interventions to improve control of blood sugar, hypertension, and lipid levels might slow the progression of kidney disease (6), and effective community-based approaches to prevent obesity and increase physical activity might reduce the incidence of type 2 diabetes (9).
The findings in this report are subject to at least three limitations. First, data were collected for patients whose ESRD treatment was reported to CMS and do not include patients who died before receiving treatment or persons who refused treatment and thus were not reported to CMS. Under the ESRD entitlement program, persons initiating treatment for ESRD in the United States and Puerto Rico are entitled to receive Medicare benefits from CMS (1). Second, changes in incidence of diagnosed ESRD-D might have been caused by factors other than a true change in disease incidence. These factors might include access to or acceptance of ESRD treatment or changes in treatment and care practices. Furthermore, changes in physician reporting of the primary cause of kidney failure could affect incidence, and revised diagnostic criteria for diabetes in 1997 might have led to a greater number of persons being detected with diabetes earlier in the disease process (10). Finally, the estimated population with diagnosed diabetes is likely to be an underestimate because BRFSS is a telephone survey that excludes the institutionalized population, active duty military personnel, and persons with cellular telephones, and because prevalence is based on self-report.
Continued awareness and interventions to reduce the prevalence of risk factors for kidney failure and to improve diabetes care are needed to sustain the decrease in ESRD-D incidence. CDC and state and territorial diabetes prevention and control programs have been working with public and private partners to reduce the incidence of type 2 diabetes and to improve outcomes for persons with diabetes. CDC's new National Diabetes Prevention Program is supporting the nationwide implementation of community-based lifestyle programs to prevent or delay the onset of type 2 diabetes among persons at high risk (9). In partnership with YMCA USA, UnitedHealth Group, Indiana University, University of Pittsburgh, and Emory University, CDC is beginning this new program in 17 communities throughout the United States. The National Diabetes Education Program (NDEP), sponsored by CDC and the National Institutes of Health, works with partners at the federal, state, and local levels to improve the treatment and outcomes for persons with diabetes, promote early diagnosis, and prevent or delay the onset of type 2 diabetes. NDEP conducts national, multicultural campaigns to educate persons with diabetes, their families, and health-care providers about the importance of controlling blood glucose, blood pressure, and cholesterol to improve health outcomes and lower the risk for complications (including kidney disease), and to promote behaviors to prevent or delay the onset of type 2 diabetes among persons at risk.† To assess progress in diabetes prevention and control, CDC's National Diabetes Surveillance System monitors the incidence of diabetes and the health and well being of the population with diabetes (2). In addition, CDC soon will establish a Chronic Kidney Disease Surveillance System to monitor the burden of chronic kidney disease in the United States and evaluate prevention strategies.§
Acknowledgments
This report is based, in part, on contributions from BRFSS state coordinators and the Div of Behavioral Surveillance, Office of Surveillance, Epidemiology, and Laboratory Svcs, CDC.
References
- US Renal Data System. USRDS 2009 annual data report: atlas of chronic kidney disease and end-stage renal disease in the United States. Bethesda, MD: National Institutes of Health, National Institute of Diabetes and Digestive and Kidney Diseases; 2009.
- CDC. National Diabetes Surveillance System. Atlanta, GA: US Department of Health and Human Services, CDC; 2010. Available at http://apps.nccd.cdc.gov/ddtstrs/default.aspx. Accessed October 21, 2010.
- Burrows NR, Li Y, Geiss LS. Incidence of treatment for end-stage renal disease among individuals with diabetes in the U.S. continues to decline. Diabetes Care 2010;33:73−7.
- Hoerger TJ, Segel JE, Gregg EW, Saaddine JB. Is glycemic control improving in U.S. adults? Diabetes Care 2008;31:81--6.
- Imperatore G, Cadwell BL, Geiss L, et al. Thirty-year trends in cardiovascular risk factor levels among US adults with diabetes: National Health and Nutrition Examination Surveys, 1971--2000. Am J Epidemiol 2004;160:531--9.
- James MT, Hemmelgarn BR, Tonelli M. Early recognition and prevention of chronic kidney disease. Lancet 2010;375:1296--309.
- Saydah SH, Fradkin J, Cowie CC. Poor control of risk factors for vascular disease among adults with previously diagnosed diabetes. JAMA 2004;291:335--42.
- Saaddine JB, Cadwell B, Gregg EW, et al. Improvements in diabetes processes of care and intermediate outcomes: United States, 1988--2002. Ann Intern Med 2006;144:465--74.
- Ackermann RT, Finch EA, Brizendine E, Zhou H, Marrero DG. Translating the Diabetes Prevention Program into the community: the DEPLOY Pilot Study. Am J Prev Med 2008;35:357--63.
- Expert Committee on the Diagnosis and Classification of Diabetes Mellitus. Report of the Expert Committee on the Diagnosis and Classification of Diabetes Mellitus. Diabetes Care 1997;20:1183--97.
* Midwest: Illinois, Indiana, Iowa, Kansas, Michigan, Minnesota, Missouri, Nebraska, North Dakota, Ohio, South Dakota, and Wisconsin; Northeast: Connecticut, Maine, Massachusetts, New Hampshire, New Jersey, New York, Pennsylvania, Rhode Island, and Vermont; South: Alabama, Arkansas, Delaware, District of Columbia, Florida, Georgia, Kentucky, Louisiana, Maryland, Mississippi, North Carolina, Oklahoma, South Carolina, Tennessee, Texas, Virginia, and West Virginia; West: Alaska, Arizona, California, Colorado, Hawaii, Idaho, Montana, Nevada, New Mexico, Oregon, Utah, Washington, and Wyoming.
† Additional information is available at http://ndep.nih.gov/about-ndep/index.aspx.
§ Additional information is available at http://www.cdc.gov/diabetes/projects/kidney.htm.
What is already known on this topic?
The incidence of end-stage renal disease attributed to diabetes (ESRD-D) in the U.S. population with diagnosed diabetes has declined since 1996.
What is added by this report?
The decline in incidence of ESRD-D during 1996--2007 was confirmed in all U.S. regions and most states.
What are the implications for public health practice?
Continued awareness and interventions to reduce the prevalence of risk factors for kidney failure and to improve diabetes care are needed to sustain the widespread decrease in ESRD-D incidence.
FIGURE 1. Number and age-adjusted rate* of persons aged ≥18 years with diagnosed diabetes who began treatment for end-stage renal disease attributed to diabetes --- United States and Puerto Rico, 1996--2007

* Per 100,000 persons with diagnosed diabetes and age adjusted by the direct method to the 2000 U.S. standard population.
Alternate Text: The figure above shows the number and age-adjusted rate of persons aged ≥18 years with diagnosed diabetes who began treatment for end-stage renal disease attributed to diabetes (ESRD-D) in the United States and Puerto Rico during 1996-2007. During 1996-2007, the total number of adults aged ≥18 years in the United States and Puerto Rico who began treatment for ESRD-D each year increased significantly, from 32,716 (state range: 32−3,719) to 48,712 (state range: 37-6,059) (test for trend, p<0.001).
FIGURE 2. Age-adjusted rate* of treatment initiation for end-stage renal disease attributed to diabetes among persons aged ≥18 years with diagnosed diabetes, by U.S. census region† --- United States, 1996--2007
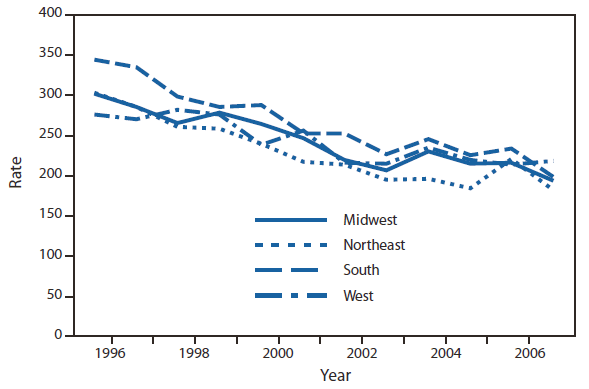
* Per 100,000 persons with diagnosed diabetes and age adjusted by the direct method to the 2000 U.S. standard population.
† Midwest: Illinois, Indiana, Iowa, Kansas, Michigan, Minnesota, Missouri, Nebraska, North Dakota, Ohio, South Dakota, and Wisconsin; Northeast: Connecticut, Maine, Massachusetts, New Hampshire, New Jersey, New York, Pennsylvania, Rhode Island, and Vermont; South: Alabama, Arkansas, Delaware, District of Columbia, Florida, Georgia, Kentucky, Louisiana, Maryland, Mississippi, North Carolina, Oklahoma, South Carolina, Tennessee, Texas, Virginia, and West Virginia; West: Alaska, Arizona, California, Colorado, Hawaii, Idaho, Montana, Nevada, New Mexico, Oregon, Utah, Washington, and Wyoming.
Alternate Text: The figure above shows the age-adjusted rate of treatment initiation for end-stage renal disease attributed to diabetes (ESDR-D) among persons aged ≥18 years with diagnosed diabetes during 1996-2007. During 1996-2007, the age-adjusted ESRD-D incidence in persons with diagnosed diabetes decreased 35%, from 304.5 per 100,000 (state range: 152.7-544.4) to 199.1 per 100,000 (state range: 108.1-450.0) (p<0.001). Incidence declined significantly in all U.S. regions.
Use of trade names and commercial sources is for identification only and does not imply endorsement by the U.S. Department of
Health and Human Services.
References to non-CDC sites on the Internet are
provided as a service to MMWR readers and do not constitute or imply
endorsement of these organizations or their programs by CDC or the U.S.
Department of Health and Human Services. CDC is not responsible for the content
of pages found at these sites. URL addresses listed in MMWR were current as of
the date of publication.
All MMWR HTML versions of articles are electronic conversions from typeset documents.
This conversion might result in character translation or format errors in the HTML version.
Users are referred to the electronic PDF version (http://www.cdc.gov/mmwr)
and/or the original MMWR paper copy for printable versions of official text, figures, and tables.
An original paper copy of this issue can be obtained from the Superintendent of Documents, U.S.
Government Printing Office (GPO), Washington, DC 20402-9371;
telephone: (202) 512-1800. Contact GPO for current prices.
**Questions or messages regarding errors in formatting should be addressed to
mmwrq@cdc.gov.
