Persons using assistive technology might not be able to fully access information in this file. For assistance, please send e-mail to: mmwrq@cdc.gov. Type 508 Accommodation and the title of the report in the subject line of e-mail.
Potentially Preventable Hospitalizations — United States, 2001–2009
Corresponding author: Ernest Moy, Agency for Healthcare Research and Quality. Telephone: 301-427-1329; E-mail: Ernest.moy@ahrq.hhs.gov.
Introduction
Potentially preventable hospitalizations are admissions to a hospital for certain acute illnesses (e.g., dehydration) or worsening chronic conditions (e.g., diabetes) that might not have required hospitalization had these conditions been managed successfully by primary care providers in outpatient settings. Although not all such hospitalizations can be avoided, admission rates in populations and communities can vary depending on access to primary care, care-seeking behaviors, and the quality of care available (1,2). Because hospitalization tends to be costlier than outpatient or primary care, potentially preventable hospitalizations often are tracked as markers of health system efficiency. The number and cost of potentially preventable hospitalizations also can be calculated to help identify potential cost savings associated with reducing these hospitalizations overall and for specific populations.
This report is part of the second CDC Health Disparities and Inequalities Report (CHDIR). The 2011 CHDIR (2) was the first CDC report to assess disparities across a wide range of diseases, behavior risk factors, environmental exposures, social determinants, and health-care access. The topic presented in this report is based on criteria that are described in the 2013 CHDIR Introduction (3). This report updates information on potentially preventable hospitalizations that was presented in the first CHDIR (4). The purposes of this report are to discuss and raise awareness of differences in the race/ethnicity and income of persons with excess potential preventable hospitalizations and to prompt actions to reduce these disparities.
Methods
To examine trends in a composite measure of potentially preventable hospitalizations among adults aged ≥18 years in the United States, the Agency for Healthcare Research and Quality (AHRQ) analyzed data for 2001–2009 from the Healthcare Cost and Utilization Project (HCUP) databases (available at http://www.ahrq.gov/research/data/hcup/index.html). HCUP databases combine the data-collection efforts of state data organizations, hospital associations, private data organizations, and the federal government to create a national information resource of discharge-level health-care data. HCUP includes the largest collection of longitudinal hospital care data in the United States with all-payer, encounter-level information, beginning with 1988.
Numbers of potentially preventable hospitalizations in 2009 were estimated by race/ethnicity and income quartile for the following eight conditions: diabetes, hypertension, congestive heart failure, angina without procedure, asthma, dehydration, bacterial pneumonia, and urinary infections. Hospitalizations include all inpatient stays with these conditions listed as the principal diagnosis regardless of admitting source (e.g., admissions through an emergency room, transfers from other facilities, and direct admissions by a provider). Because coding of race/ethnicity varies across state hospital databases, analyses by race/ethnicity used a specially created 40% sample of hospitals from states that contribute comparable race/ethnicity data to HCUP (concerning approximately 16 million discharges from 2,000 hospitals in 36 states in 2009) (5). Race was classified as non-Hispanic white, non-Hispanic black, Asian/Pacific Islander (A/PI), and other. Ethnicity was classified as Hispanic and non-Hispanic. Persons of Hispanic ethnicity might be of any race or combination of races. Area income, based on the income of the neighborhood in which a patient lives, was used as a proxy for socioeconomic status. Area income was divided into quartiles on the basis of the mean household income by the patient's ZIP Code. Quartile 1 refers to the lowest income communities, and quartile 4 refers to the wealthiest communities. Analyses by area income used the Nationwide Inpatient Sample, a nationally stratified 20% sample of hospitals from states that contribute data to HCUP (concerning approximately 8 million discharges from 1,000 hospitals in 44 states in 2009). Data regarding patients' educational attainment or disability status were unavailable or insufficient to provide estimates for certain populations (i.e., American Indians/Alaska Natives, Native Hawaiians and Other Pacific Islanders, and persons of multiple races). Data on disparities related to sex and geographic location are not presented but are available at http://www.ahrq.gov/research/findings/nhqrdr/nhqrdr11/index.html#Efficiency.
Disparities in hospital admission rates per 100,000 population for 2001–2009 were estimated, and potential cost savings related to income and race/ethnicity were examined. Hospitalization rates for the potentially preventable conditions were calculated by using the AHRQ Prevention Quality Indicators (PQIs) modified version 4.2, which were adjusted by age and gender on the basis of the 2000 U.S. standard population (5). Excess potentially preventable hospitalizations by area income were estimated by comparing the 2009 AHRQ PQI composite rate of hospitalizations for residents of the neighborhoods in the highest income quartile, the group with the lowest rate, with the composite rate for residents of neighborhoods in lower income quartiles. Similarly, excess potentially preventable hospitalizations by race/ethnicity were estimated by comparing the 2009 AHRQ PQI composite rate of hospitalizations for A/PIs, the group with the lowest rate, with the composite rate for other racial/ethnic groups. Total charges included on hospital claims were converted to costs by using hospital-level cost-to-charge ratios based on the Centers for Medicare and Medicaid Services' (CMS) hospital cost report data (5). Costs associated with potentially preventable hospitalizations were estimated by multiplying numbers of excess hospitalizations for a group by the average cost per hospitalization for that group. Costs are for the hospital cost of producing the services and do not include physician costs associated with hospital stay.
Results
During 2001–2009, the AHRQ PQI composite rate decreased from 1,635 to 1,395 per 100,000 adults. Declines in potentially preventable hospitalization rates were observed across all income quartiles between 2001 and 2009 (Figure 1). In all years, rates of hospitalizations were higher among residents of neighborhoods in the three lower income quartiles (quartiles 1–3) compared with residents of neighborhoods in the highest income quartile (quartile 4).
During 2009, if residents of the lowest income neighborhoods (quartile 1) had the same rate of hospitalizations as residents of the highest income neighborhoods (quartile 4), they would have had approximately 500,000 fewer hospitalizations and saved $3.6 billion in hospitalization costs (Figure 2). If residents of income quartiles 2 and 3 had had the same hospitalization rate as residents of income quartile 4, they would have had approximately 220,000 and 90,000 fewer hospitalizations and saved $1.7 billion and $700 million, respectively, in 2009.
Significant declines in hospitalization rates also were observed across all race/ethnicity groups during 2001–2009 (Figure 3). In general, non-Hispanic blacks and Hispanics had higher rates of hospitalizations than non-Hispanic whites, and A/PIs had lower rates than non-Hispanic whites.
During 2009, if non-Hispanic whites had had the same rate of hospitalizations as A/PIs, they would have had 700,000 fewer hospitalizations and saved $7.7 billion in hospitalization costs (Figure 4). If non-Hispanic blacks and Hispanics had the same hospitalization rate as A/PIs, they would have had 540,000 and 240,000 fewer hospitalizations, respectively, and saved $3.7 billion and $700 million, respectively, in 2009.
Discussion
The findings in this report are consistent with previous studies showing decreasing rates of potentially preventable hospitalizations for specific conditions such as congestive heart failure (6,7) and for these hospitalizations in aggregate (8). Because rates of all groups defined by race/ethnicity and neighborhood income decreased at a similar pace, disparities that were present in 2001 persisted through 2009. These findings extend previous work by demonstrating that these disparities accounted for a considerable share of costs associated with potentially preventable hospitalizations.
Reducing hospitalization rates is a key to controlling health-care costs. For many chronic conditions, inpatient costs are the dominant expense. For example, approximately half of the expenditures of persons with diabetes are spent on hospital inpatient care, compared with 12% spent on diabetes medications and supplies and 9% spent on physician office visits (9). Disease management programs typically incur higher outpatient and pharmacy costs that are offset by lower inpatient costs (10). Programs to prevent chronic diseases also generate savings by lowering rates of hospitalizations. Patient-centered medical homes generate most of their savings by reducing hospitalizations, and it is anticipated that the success of accountable care organizations also will depend on their ability to hold down inpatient costs (11).
Populations with the highest rates of potentially preventable hospitalizations have the largest potential for lower rates and inpatient costs. Communities with high rates of potentially preventable hospitalizations might see the benefit of investing in primary care, care coordination, and community health worker strategies that can lower inpatient costs. The national Million Hearts initiative (http://millionhearts.hhs.gov/index.html) aims to prevent one million heart attacks and strokes by focusing in primary care settings on the "ABCS": aspirin when appropriate, blood pressure control, cholesterol management, and smoking cessation. Community-based prevention efforts are focused on reducing sodium in the food supply, eliminating consumption of transfats, and promoting tobacco cessation. Implementation of these interventions can reduce potentially preventable hospitalizations and decrease disparities for hypertension, congestive heart failure, and angina.
Limitations
The data provided in this report are subject to at least three limitations. First, hospital administrative data might be incomplete. Data from only two thirds of the 50 states were usable in this analysis, and individual states might differ in how conditions and race/ethnicity are coded. Coding of conditions by hospitals also might change over time. Second, cost estimates capture only hospital facility costs during the inpatient stay and do not include costs of inpatient or outpatient physician visits, including follow-up outpatient care. Although incomplete, because hospital facility costs are the largest type of health expenditure, analyses over time and across populations might be informative. Finally, these analyses cannot address causality. Rather than residence in low-income neighborhoods contributing to poorer health and thus requiring hospitalization, for some patients, poorer health might lead to residence in low-income neighborhoods. Moreover, whether providing improved primary care to residents of low-income neighborhoods can reduce their rates of potentially preventable hospitalizations to the rates experienced by residents of high-income neighborhoods is unclear.
Conclusion
Potentially preventable hospitalizations are common and costly. Identification of disparities in potentially preventable hospitalizations rates is necessary to address communities and groups that would benefit the most. Because residents of low-income neighborhoods have the highest rates or preventable hospitalizations, providing interventions among low-income neighborhoods might yield the largest reductions in hospitalizations.
Acknowledgment
This report is based in part on data provided by the partner organizations that participated in the HCUP Nationwide Inpatient Sample and the State Inpatient Databases. A list of these organizations is available at http://www.hcup-us.ahrq.gov/db/hcupdatapartners.jsp.
References
- Bindman AB, Grumbach K, Osmond D, et al. Preventable hospitalizations and access to health care. JAMA 1995;274:305–11.
- CDC. CDC Health disparities and inequalities report—United States, 2011. MMWR 2011;60 (Suppl; January 14, 2011).
- CDC. Introduction: In: CDC health disparities and inequalities report—United States, 2013. MMWR 2013;62(No. Suppl 3).
- CDC. Potentially preventable hospitalizations—United States, 2004–2007. In: CDC health disparities and inequalities report—United States, 2011. MMWR 2011;60(Suppl; January 14, 2011).
- Coffey R, Barrett M, Houchens R, et al. Methods applying AHRQ quality indicators to Healthcare Cost and Utilization Project (HCUP) data for the tenth (2012) National Healthcare Quality Report (NHQR) and National Healthcare Disparities Report (NHDR). Rockville, MD: Agency for Healthcare Research and Quality. Available at http://www.hcup-us.ahrq.gov/reports/methods/methods.jsp.
- Chen J, Normand SL, Wang Y, Krumholz HM. National and regional trends in heart failure hospitalization and mortality rates for Medicare beneficiaries, 1998–2008. JAMA 2011;306:1669–78.
- Will JC, Valderrama AL, Yoon PW. Preventable hospitalizations for congestive heart failure: establishing a baseline to monitor trends and disparities. Prev Chronic Dis 2012;9:110260. DOI: http://dx.doi.org/10.5888/pcd9.110260.
- Agency for Healthcare Research and Quality. 2011 national healthcare quality report. Rockville, MD: Agency for Healthcare Research and Quality; 2012. Available at http://www.ahrq.gov/research/findings/nhqrdr/nhqr11/index.html.
- American Diabetes Association. Economic costs of diabetes in the U.S. in 2007. Diabetes Care 2008;31:596–615.
- Dall TM, Roary M, Yang W, et al. Health care use and costs for participants in a diabetes disease management program, United States, 2007–2008. Prev Chronic Dis 2011;8:A53.
- Longworth DL. Accountable care organizations, the patient-centered medical home, and health care reform: what does it all mean? Cleve Clin J Med 2011;78:571–82.
FIGURE 1. Rate* of potentially preventable hospitalizations† among adults aged ≥18 years, by income quartile§ — United States, 2001–2009
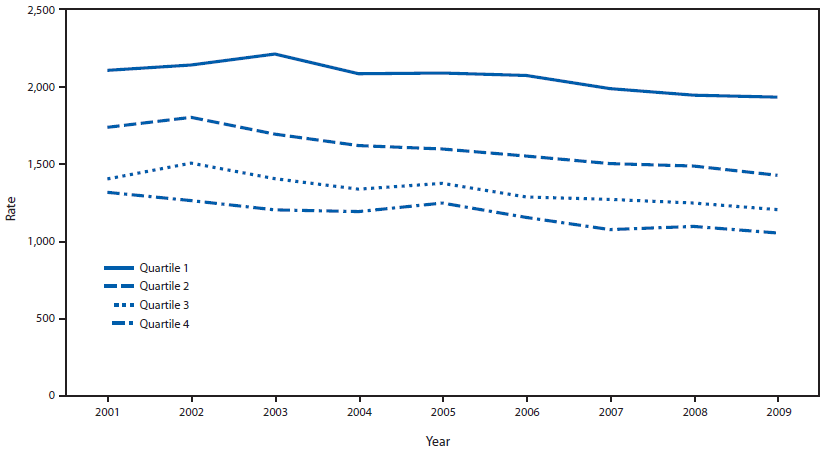
Source: Agency for Healthcare Research and Quality, Healthcare Cost and Utilization Project, Nationwide Inpatient Sample, 2001–2009.
* Per 100,000 population.
† For diabetes, hypertension, congestive heart failure, angina without procedure, asthma, dehydration, bacterial pneumonia, and urinary infections.
§ Area income was divided into quartiles based on the mean household income by the patient's ZIP Code. Quartile 1 refers to the lowest income communities, and quartile 4 refers to the wealthiest communities.
Alternate Text: The figure shows the rate of potentially preventable hospitalizations among U.S. adults aged ≥18 years for diabetes, hypertension, congestive heart failure, angina without procedure, asthma, dehydration, bacterial pneumonia, and urinary infections by income quartile for the period 2001-2009. Area income was divided into quartiles based on the mean household income by the patient's ZIP Code. Quartile 1 refers to the lowest income communities, and quartile 4 refers to the wealthiest communities.
FIGURE 2. Number of potentially preventable hospitalizations* among adults aged ≥18 years, by income quartile† — United States, 2009
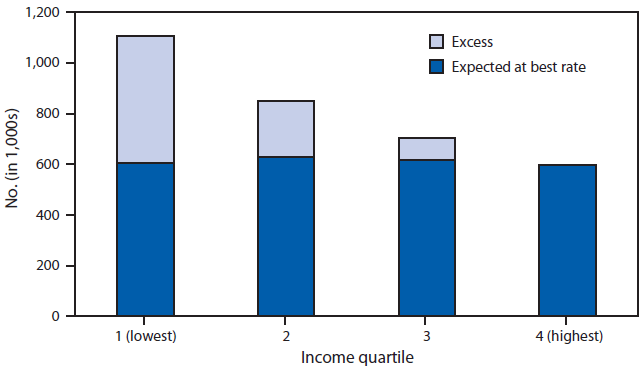
Source: Agency for Healthcare Research and Quality, Healthcare Cost and Utilization Project, Nationwide Inpatient Sample, 2009.
* For diabetes, hypertension, congestive heart failure, angina without procedure, asthma, dehydration, bacterial pneumonia, and urinary infections.
† Area income was divided into quartiles based on the mean household income by the patient's ZIP Code. Quartile 1 refers to the lowest income communities, and quartile 4 refers to the wealthiest communities.
Alternate Text: The figure shows the number of potentially preventable hospitalizations among U.S. adults aged ≥18 years for diabetes, hypertension, congestive heart failure, angina without procedure, asthma, dehydration, bacterial pneumonia, and urinary infections by income quartile for 2009. Area income was divided into quartiles based on the mean household income by the patient's ZIP Code. Quartile 1 refers to the lowest income communities, and quartile 4 refers to the wealthiest communities.
FIGURE 3. Rate* of potentially preventable hospitalizations† among adults aged ≥18 years, by race/ethnicity — United States, 2001–2009
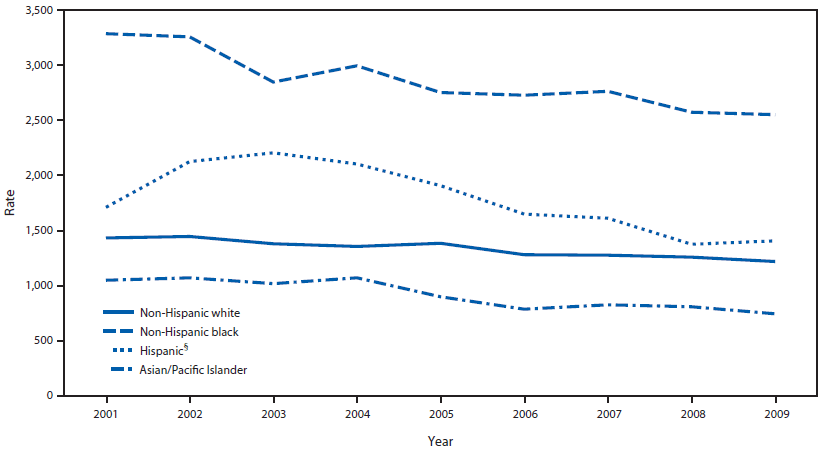
Source: Agency for Healthcare Research and Quality, Healthcare Cost and Utilization Project, State Inpatient Databases disparities analytic file, 2001–2009.
* Per 100,000 population.
† For diabetes, hypertension, congestive heart failure, angina without procedure, asthma, dehydration, bacterial pneumonia, and urinary infections.
§ Persons of Hispanic ethnicity can be of any race or combination of races
Alternate Text: The figure shows the rate per 100,000 population of potentially preventable hospitalizations among U.S. adults aged ≥18 years by race/ethnicity for diabetes, hypertension, congestive heart failure, angina without procedure, asthma, dehydration, bacterial pneumonia, and urinary infections for the period 2001-2009.
FIGURE 4. Number of potentially preventable hospitalizations* among adults aged ≥18 years, by race/ethnicity — United States, 2009
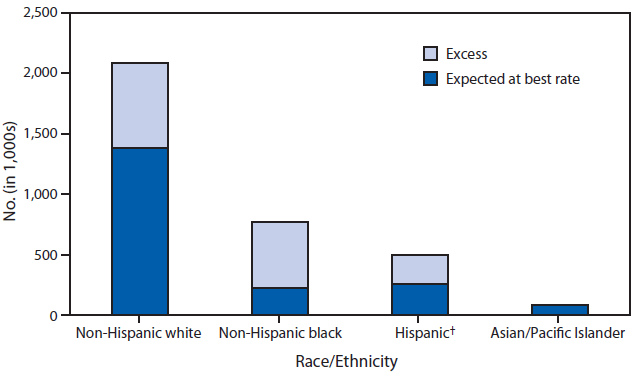
Source: Agency for Healthcare Research and Quality, Healthcare Cost and Utilization Project, State Inpatient Databases disparities analytic file, 2009.
* For diabetes, hypertension, congestive heart failure, angina without procedure, asthma, dehydration, bacterial pneumonia, and urinary infections.
† Persons of Hispanic ethnicity can be of any race or combination of races.
Alternate Text: The figure shows the number of potentially preventable hospitalizations among U.S. adults aged ≥18 years by race/ethnicity for diabetes, hypertension, congestive heart failure, angina without procedure, asthma, dehydration, bacterial pneumonia, and urinary infections for 2009.
Use of trade names and commercial sources is for identification only and does not imply endorsement by the U.S. Department of
Health and Human Services.
References to non-CDC sites on the Internet are
provided as a service to MMWR readers and do not constitute or imply
endorsement of these organizations or their programs by CDC or the U.S.
Department of Health and Human Services. CDC is not responsible for the content
of pages found at these sites. URL addresses listed in MMWR were current as of
the date of publication.
All MMWR HTML versions of articles are electronic conversions from typeset documents.
This conversion might result in character translation or format errors in the HTML version.
Users are referred to the electronic PDF version (http://www.cdc.gov/mmwr)
and/or the original MMWR paper copy for printable versions of official text, figures, and tables.
An original paper copy of this issue can be obtained from the Superintendent of Documents, U.S.
Government Printing Office (GPO), Washington, DC 20402-9371;
telephone: (202) 512-1800. Contact GPO for current prices.
**Questions or messages regarding errors in formatting should be addressed to
mmwrq@cdc.gov.
