At a glance
- This report presents annual estimates of the percentages of foodborne illness attributed to 17 food categories for Salmonella, Escherichia coli O157, and Listeria monocytogenes.
- These estimates can inform food safety decision-making and provide pathogen-specific direction for reducing foodborne illness.
- Data came from 49,848 illnesses linked to 1,390 foodborne disease outbreaks that occurred from 1998 through 2023.

Executive summary
Background
Each year in the United States, an estimated 9.9 million people get sick, 53,300 are hospitalized, and 931 die of a foodborne disease caused by seven major food pathogens—including the three pathogens presented in this report. These estimates highlight the scope of this public health problem. However, to develop effective prevention measures, food safety agencies and partners need to understand the types of foods contributing to the problem.
The Interagency Food Safety Analytics Collaboration (IFSAC) is a tri-agency group created by CDC, the U.S. Food and Drug Administration (FDA), and the U.S. Department of Agriculture's Food Safety and Inspection Service (USDA-FSIS).
Key findings
Using outbreak surveillance data from 1998 through 2023, this report presents annual estimates of the percentages of foodborne illness attributed to 17 food categories for Salmonella, Escherichia coli (E. coli) O157, and Listeria monocytogenes (Listeria).
Highlights
- Salmonella illnesses came from a wide variety of foods.More than 75% of Salmonella illnesses were attributed to six food categories: chicken (19.1%), fruits (14.2%), seeded vegetables (13.0%, such as tomatoes), pork (11.7%), other produce (10.0%, such as nuts), and beef (7.8%).
- E. coli O157 illnesses were most often linked to two food categories.Over 85% of E. coli O157 illnesses were linked to vegetable row crops (67.9%, such as leafy greens) and beef (18.6%).
- Listeria illnesses were most often linked to three food categories.More than 75% of illnesses were attributed to dairy (31.9%), vegetable row crops (27.4%), and fruits (15.9%), but the rarity of Listeria outbreaks makes these estimates less reliable than those for other pathogens.
Attribution estimates for Campylobacter are not presented in this year's report. Evidence suggests the sources of Campylobacter outbreaks likely differ considerably from the sources of non-outbreak-associated illnesses caused by this pathogen. IFSAC continues to explore viable alternatives for estimating the sources of Campylobacter illnesses.
How we got the data
IFSAC derived these estimates using the same method used for previous estimates, with some modifications. The original method, dating back to the estimates from 2012, was described in a report and a peer-reviewed journal article.
The data in this year's report came from 49,848 illnesses linked to 1,390 foodborne disease outbreaks that occurred from 1998 through 2023 and for which each confirmed or suspected implicated food was assigned to a single food category. The method relies most heavily on the last five years of outbreak data (2019–2023).
Foods are categorized using a scheme IFSAC created that classifies foods into 17 categories that closely align with the U.S. food regulatory agencies' classification needs. Caution should be exercised when comparing estimates across years. For example, a decrease in a percentage may result from a decrease in the number of illnesses attributed to that food but may also reflect an increase in illnesses attributed to another food.
Why this report is important
This collaborative effort to provide annual attribution estimates continues IFSAC's work to improve foodborne illness source attribution, which can help inform efforts to prioritize food safety initiatives, interventions, and policies for reducing foodborne illnesses. These consensus estimates allow all three agencies to take a consistent approach to identifying food safety priorities to protect public health.
Introduction
Context and scope
Each year in the United States, an estimated 9.9 million people get sick, 53,300 are hospitalized, and 931 die of a foodborne disease caused by seven major food pathogens—including the three pathogens presented in this report.1 These estimates highlight the scope of this public health problem. However, to develop effective prevention measures, food safety agencies and partners need to understand the percentage of foodborne illnesses associated with specific foods; we call this work foodborne illness source attribution.
With the creation of IFSAC in 2011, CDC, FDA, and USDA-FSIS agreed to improve data and methods used to estimate foodborne illness source attribution and provide timely estimates of the food sources of four priority foodborne pathogens: Salmonella, Shiga toxin-producing E. coli O157, Listeria monocytogenes (Listeria), and Campylobacter. IFSAC considers these four pathogens to be priorities because of the frequency and severity of illness they cause, and because targeted interventions can significantly reduce these illnesses.
Consistent with the 2020–2022 reports, attribution estimates for Campylobacter are not presented due to observed limitations of using outbreak data to attribute Campylobacter illnesses to food sources. IFSAC continues to explore viable alternatives for estimating the sources of Campylobacter illnesses.
Analysis
IFSAC developed a method for analyzing outbreak data to estimate which foods are responsible for illnesses related to the four priority pathogens, using a scheme IFSAC created to classify foods into 17 categories that closely align with the U.S. food regulatory agencies' classification needs.2 Examples of foods included in each food category can be found in the Appendix. IFSAC described this method and the resulting estimates for the year 2012 in a report and a peer-reviewed article.3
IFSAC derived these estimates using the same method, with some modifications. IFSAC publishes annual estimates of the sources of foodborne illness for the priority pathogens while continuing to work on methods to further improve these estimates.
Goals
The consensus among the three agencies on methods and attribution estimates can help inform efforts to prioritize food safety initiatives, interventions, and policies for reducing foodborne illnesses. These estimates achieve IFSAC's goals of using improved methods to develop estimates of foodborne illness source attribution for priority pathogens and of achieving consensus that these are the best current estimates for the agencies to use in their food safety activities.
These estimates can also help scientists; federal, state, and local policymakers; the food industry; consumer advocacy groups; and the public to assess whether prevention-oriented measures are working.
Methods
The data
We analyzed data extracted from CDC's Foodborne Disease Outbreak Surveillance System45 on outbreaks (defined as two or more illnesses with a common exposure6) that were confirmed or suspected to be caused by three priority pathogens — Salmonella, E. coli O157, and Listeria — from 1998 through 2023.
Because the analysis only includes E. coli O157 outbreaks,A outbreaks caused by a combination of O157 and non-O157 E. coli are excluded. Similarly, outbreaks caused by a combination of Salmonella Enteritidis (SE) and any other Salmonella serotype are omitted because IFSAC's method runs two separate models for SE and non-SE outbreaks.3 Outbreaks caused by multiple non-SE serotypes of Salmonella, however, are included.
Finally, the analysis excludes outbreaks that met one or more of the following conditions: occurred solely in a U.S. territory; had no identified food vehicle or contaminated ingredient; or were caused by more than one pathogen, including pathogens not included in this report.
Food categories
Each outbreak was assigned to a single food category using the IFSAC food categorization scheme2 based on confirmed or suspected implicated foods and ingredients (i.e., a single ingredient was confirmed or suspected to be implicated or all ingredients in the food were assigned to the same food category).
We excluded outbreaks that could not be assigned to a single food category, as the food was often complex (i.e., composed of ingredients belonging to more than one category) and the contaminated ingredient in the complex food could not be identified.
Modeling
We developed pathogen-specific analysis of variance models using our previously described method3 to mitigate the impact of large outbreaks and control for epidemiological factors. We estimated the number of log-transformed illnesses associated with each outbreak based on three factors deemed to be important during exploratory analyses: food category, type of preparation location (e.g., restaurant, home), and whether the outbreak occurred in one or more states.
Model estimates were back-transformed and down-weighted with a function that declines exponentially for outbreaks older than the most recent five years (i.e., before 2019) because we considered foods more recently implicated to be the most relevant for estimating current attribution.
For Salmonella and E. coli O157, we assigned outbreaks to the year in which the first illnesses occurred. However, since the 2021 report, we have adjusted our method to assign model-estimated illnesses for Listeria outbreaks proportionally to the years in which illnesses in that outbreak occurred. This change reflects the fact that about half of Listeria outbreaks in our data span multiple years.
Estimating source attribution
We used the resulting down-weighted model-estimated illnesses to calculate each estimated attribution percentage: the sum of illnesses associated with a pathogen-food category pair was divided by the sum of illnesses associated with that pathogen across all food categories.
We calculated 90% credibility intervals and considered non-overlapping credibility intervals an indication of statistical significance at the p<0.10 level. After down-weighting, 56% of overall data came from the most recent five years (2019–2023), 38% from the next most recent five years (2014–2018), and 6% from the oldest data (1998–2013).
In the graphs and tables, food categories appear in descending order of their estimated attribution percentage, and those that contributed to a cumulative attribution of approximately 75% of illnesses are indicated.
Results
Outbreaks
Of these, we excluded 113 outbreaks according to our pathogen exclusion criteria, leaving 4,043 outbreaks. We further excluded
- 1,755 outbreaks without a confirmed or suspected implicated food
- 892 outbreaks for which the food vehicle could not be assigned to one of the 17 food categories, and
- 6 outbreaks that occurred solely in a U.S. territory.
The resulting dataset included 1,390 outbreaks in which the confirmed or suspected implicated food or foods could be assigned to a single food category. These outbreaks were caused or suspected to be caused by:
Due to down-weighting, the last five years of outbreaks provided the majority of information for the estimates; outbreaks from 2019 through 2023 provided 57% of model-estimated illnesses used to calculate attribution for Salmonella, 59% for E. coli O157, and 31% for Listeria.
The overall results and those for each pathogen are shown in Figures 1 through 4 below.
Overall
Figure 1
Estimated percentage (with 90% credibility intervals) of foodborne Salmonella, E. coli O157, and Listeria illnesses attributed to 17 food categories based on 1998–2023 outbreak data, United States
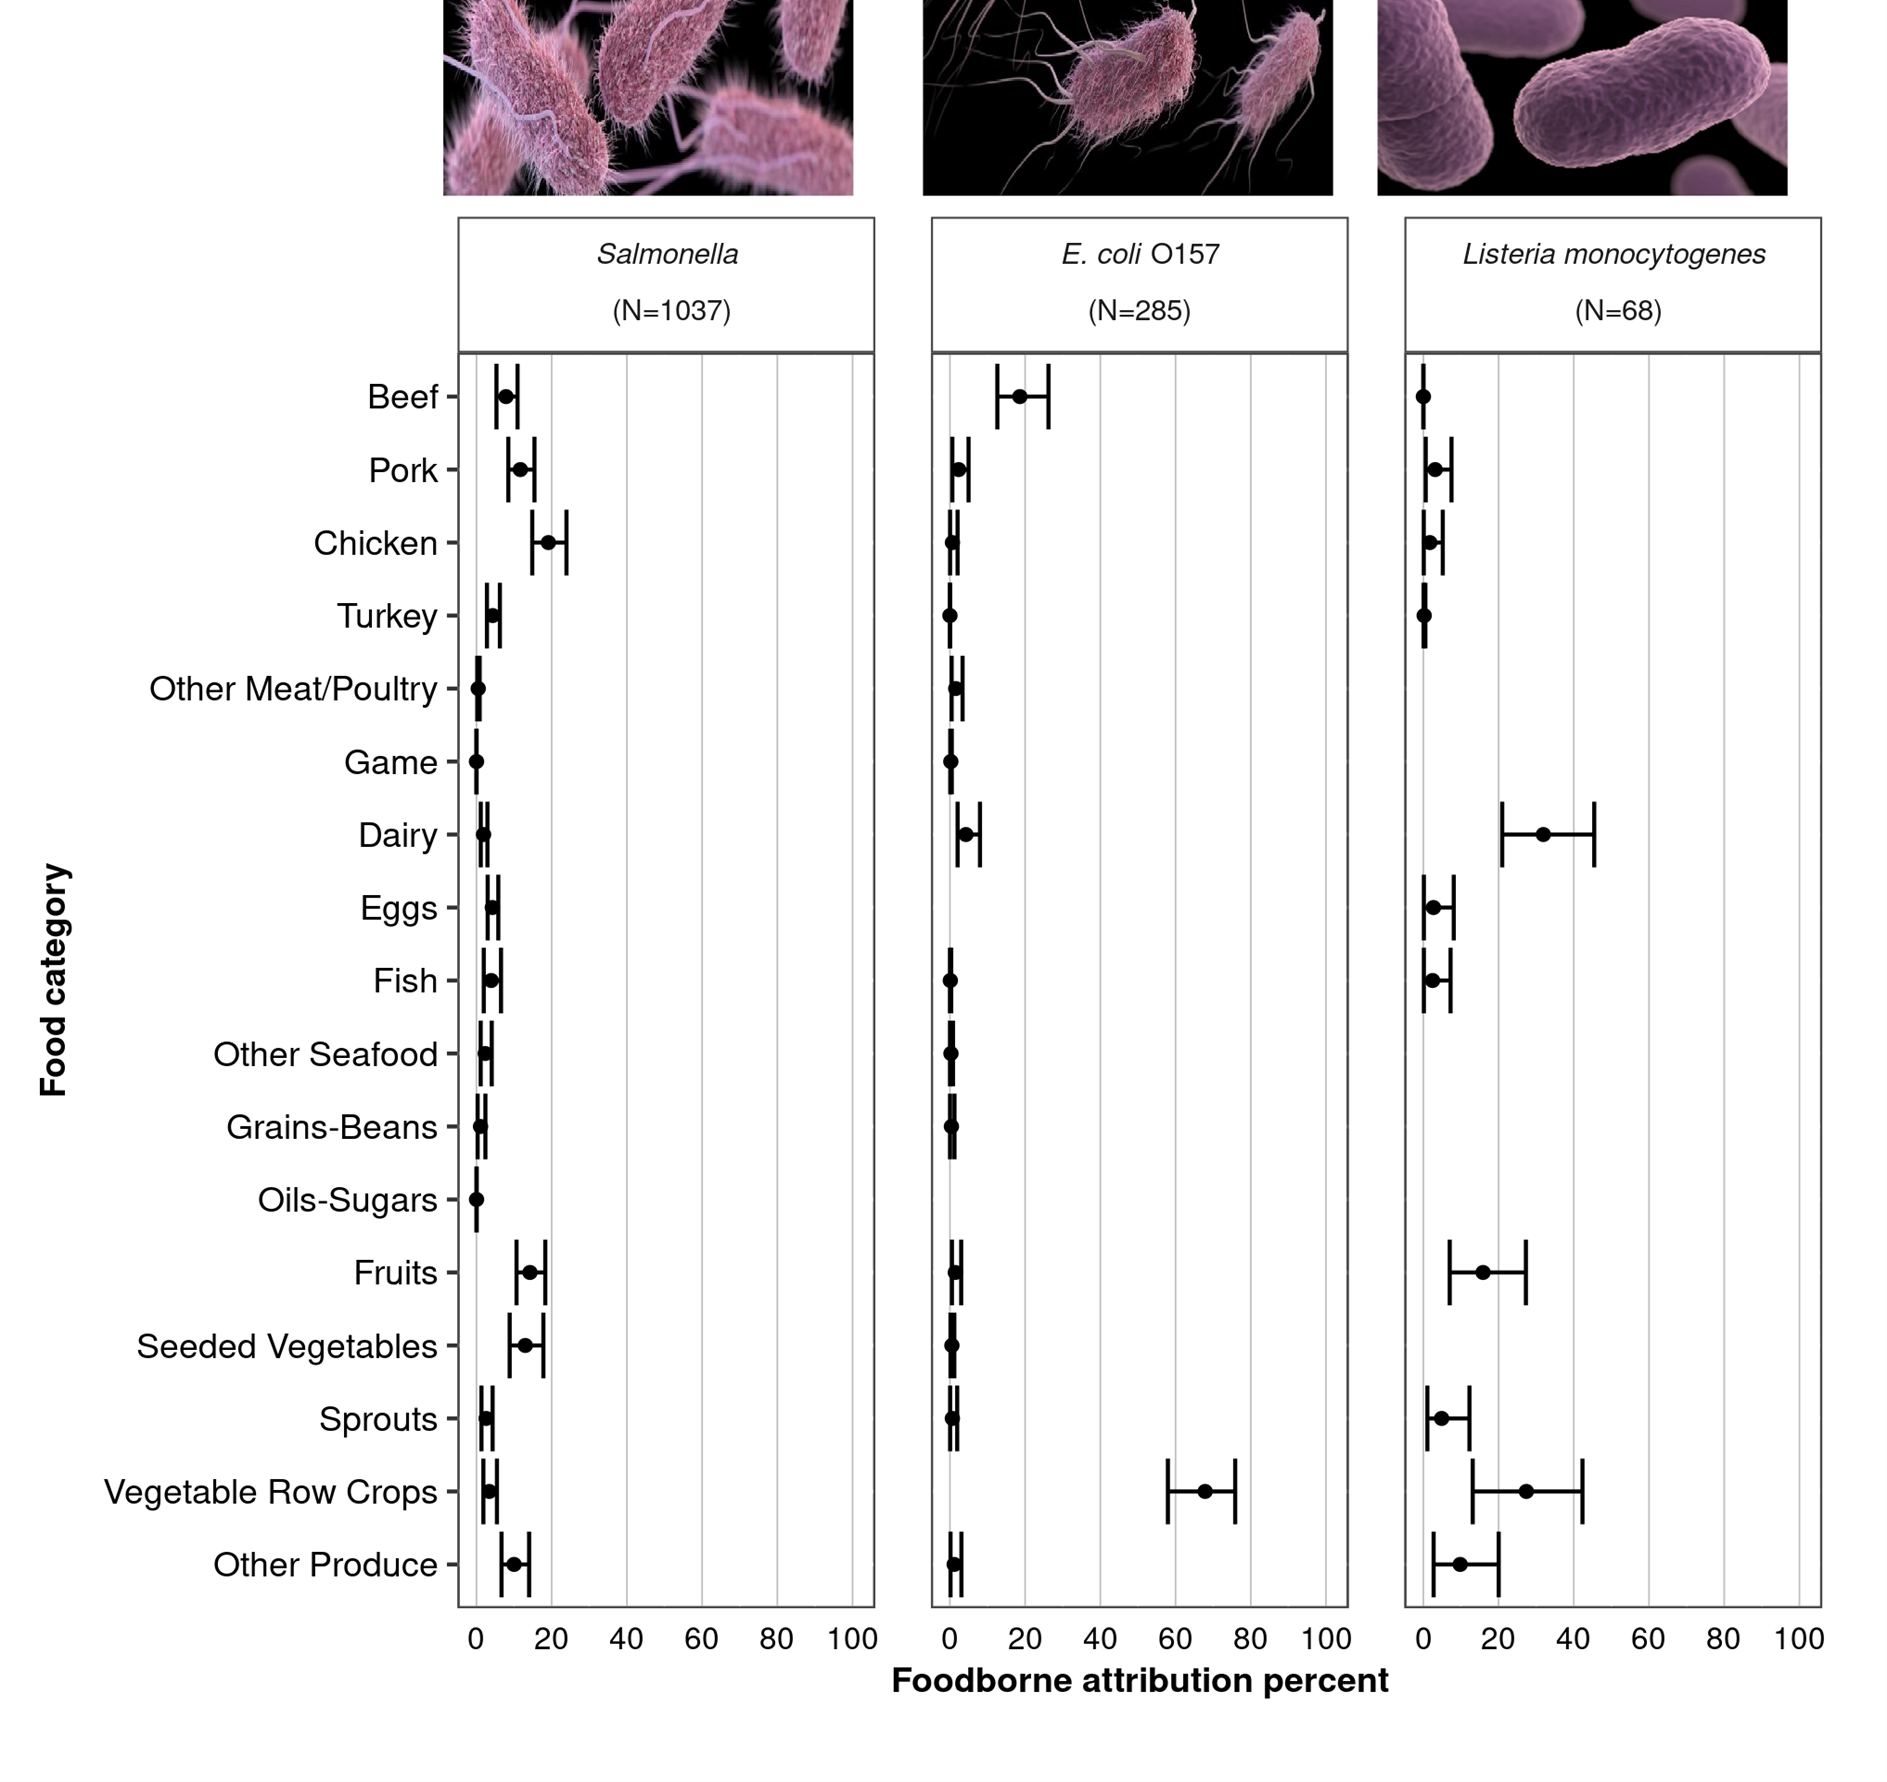
Key results
- Results are based on 1,037 outbreaks caused or suspected to be caused by Salmonella, 285 by E. coli O157, and 68 by Listeria.
- Estimated Salmonella illnesses were more evenly distributed across several food categories compared with illnesses from E. coli O157, and Listeria where most of the illnesses were attributed to fewer than four food categories.
- Credibility intervals overlap for most Salmonella and all Listeria categories that make up the top 75% of attribution sources, indicating no statistically significant difference among them.
Salmonella
Figure 2
Estimated percentage of foodborne Salmonella illnesses (with 90% credibility intervals), in descending order, attributed to each of 17 food categories, based on 1998–2023 outbreak data, United States

Key results
- Over 75% of illnesses were attributed to six food categories: chicken, fruits, seeded vegetables (such as tomatoes), pork, other produce (such as nuts), and beef.
- The credibility intervals for each of the six food categories that account for 75.8% of all illnesses overlap with the intervals of some other categories.
E. coli O157
Figure 3
Estimated percentage of foodborne E. coli O157 illnesses (with 90% credibility intervals), in descending order, attributed to each of 17 food categories, based on 1998–2023 outbreak data, United States
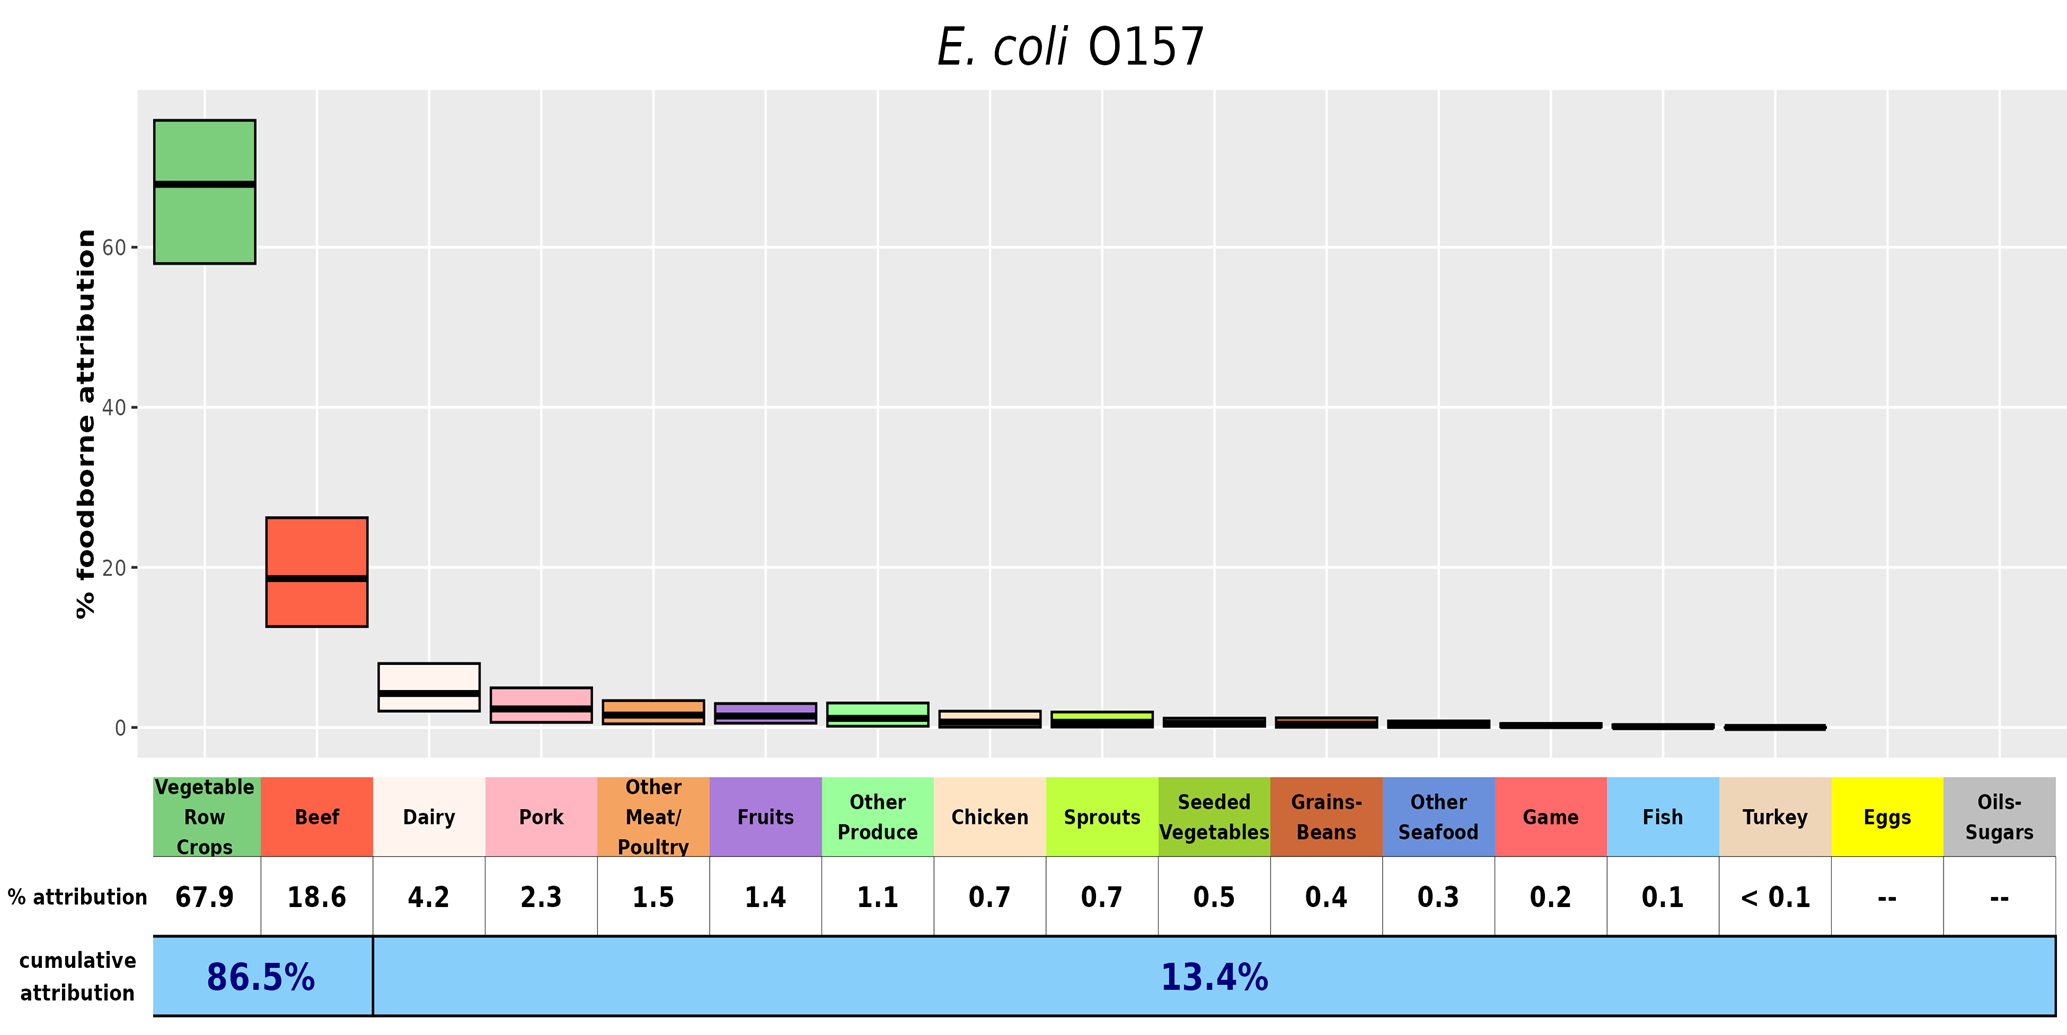
Key results
- Over 85% of E. coli O157 illnesses were attributed to vegetable row crops (such as leafy greens) and beef.
- Vegetable row crops had a significantly higher estimated attribution percentage than all other categories.
- Beef had a significantly higher estimated attribution percentage than all categories other than vegetable row crops.
- No illnesses were attributed to eggs or oils-sugars.
Listeria monocytogenes
Figure 4
Estimated percentage of foodborne Listeria illnesses (with 90% credibility intervals), in descending order, attributed to each of 17 food categories, based on 1998–2023 outbreak data, United States

Key results
- Over 75% of illnesses were attributed to dairy, vegetable row crops, and fruits.
- Credibility intervals for the dairy, fruits, and vegetable row crops categories were wide, partly due to the small total number of outbreaks (68).
- No illnesses were attributed to other meat/poultry, game, other seafood, grains-beans, oils-sugars, and seeded vegetables.
Discussion
This report uses data from 1998 through 2023 to provide outbreak-based attribution estimates of the percentages of illnesses caused by three (Salmonella, E. coli O157, and Listeria) of four priority pathogens, attributing illnesses to each of the 17 food categories.
Data from foodborne disease outbreaks are the foundation of many foodborne illness source attribution analyses, in part because outbreak investigations often link illnesses to a specific food, and the data are captured nationally. These estimates can inform food safety decision-making and provide pathogen-specific direction for reducing foodborne illness.
Similar to the 2021–2022 reports, we have assigned illnesses in multi-year Listeria outbreaks to different years based on the proportion of cases that occurred during each year of the outbreak. Weighting cases across the years of the outbreak proportionally gives an improved representation of the impact of that food category on the estimates.
Key takeaways
Salmonella
The attribution of Salmonella illnesses to multiple food categories suggests that interventions designed to reduce illnesses from these pathogens need to target a variety of food categories.
E. coli
In contrast, most E. coli O157 illnesses were attributed to two food categories: vegetable row crops and beef. These data suggest that interventions for E. coli O157 focusing on these two food categories may be most effective in reducing illnesses.
Similar to prior reports, vegetable row crops had a significantly higher estimated E. coli O157 attribution percentage than all other food categories.
Listeria
Most Listeria illnesses were attributed to three food categories: dairy, vegetable row crops, and fruits.
Although the limited number of outbreaks and wide credibility intervals dictate caution in interpreting the attribution percentage for dairy, the risk to pregnant women and persons with weakened immune systems of consuming soft cheese made from unpasteurized milk or in unsanitary conditions is well-recognized,7 and outbreaks from fruits contaminated by Listeria have been observed in recent years.8910
Limitations
Campylobacter
Attribution estimates for Campylobacter are not presented in this year's report due to continued concerns about the limitations of using outbreak data to attribute Campylobacter illnesses to sources.
As described in the 2021 IFSAC Report, these concerns are largely due to the outsized influence of outbreaks in certain foods that pose a high individual risk for Campylobacter infection but do not represent the risk to the general population. Most of the reported Campylobacter outbreaks related to dairy were associated with unpasteurized milk (164/180, 91%) and most reported Campylobacter outbreaks related to chicken were due to chicken liver products (54/85, 64%), both of which are not widely consumed.11
A lack of representativeness heightens the likelihood that the sources of reported Campylobacter outbreaks differ considerably from the sources of non-outbreak-associated illnesses. In response to these limitations, IFSAC analysts are developing other methods to estimate the sources of Campylobacter infection. For example, IFSAC is exploring methods using data associated with sporadic infections, including genomic information from patient isolates and case exposure data collected by FoodNet sites.
Multi-year outbreaks
This analysis includes two Listeria outbreaks that spanned multiple years and were not included in prior reports because the investigations had not been completed.
Multi-year outbreaks are solved in large part because whole-genome sequencing is used to link human and food isolates across multiple years. In some outbreaks, recent nonclinical isolates (such as food isolates) are subsequently linked to clinical cases from the past.12
Uncertainties
Our analytical approach addresses several issues with outbreak-based foodborne illness source attribution, yet limitations associated with generalizing outbreak data to sporadic illnesses remain and are well-documented.45
Our analysis is also subject to other uncertainties and biases.
- For pathogens with a small number of outbreaks, outbreaks with a very large illness count can have substantial influence on the attribution point estimate.
- The analysis only included 33% (1,390 of 4,156) of reported outbreaks caused by the three priority pathogens because we excluded those outbreaks that occurred solely in a U.S. territory, those in which the implicated food could not be assigned to a single food category, and those that did not meet our pathogen inclusion criteria. The ones we included might not be representative of all outbreaks caused by these pathogens.
- The analysis includes illnesses that occurred among institutionalized populations, such as those in prisons, hospitals, and schools. These populations are easier to identify and collect complete data from, have fewer food options, are more likely to have documentation of what was served, and are not representative of the general population.
Caution in interpretation
- These estimates should not be interpreted as suggesting that all foods in a category are equally likely to transmit pathogens.
- Caution should also be exercised when comparing estimates across years.
- A decrease in a percentage may result, not from a decrease in the number of illnesses attributed to that food category, but from an increase in illnesses attributed to another food category.
- This is especially true for Listeria, as the attribution percentages might vary widely from year to year due to the limited number of outbreaks and the zero-sum nature of the attribution percentages.
- The analyses show relative changes in percentage, not absolute changes in attribution to a specific food. Therefore, we advise using these results with other scientific data for decision-making.
Conclusions
IFSAC's work to provide a harmonized analytic approach for estimating foodborne illness source attribution from outbreak data can provide consistency in the use and interpretation of estimates across public health and regulatory agencies.
As more data become available and methods evolve, attribution estimates may improve. Annual updates to these estimates will enhance IFSAC's efforts to inform and engage stakeholders, and further their ability to assess whether prevention measures are working.
IFSAC continues to enhance attribution efforts through projects that address limitations identified in this report.
Appendix
Not all example foods have been linked to previous outbreaks.
| IFSAC Annual Report Category | Examples (not exhaustive) |
|---|---|
| Land Animals | |
| Beef | ground beef, steaks, roasts |
| Pork | bacon, hams, pork deli meat |
| Chicken | whole chicken, chicken deli meats |
| Turkey | whole turkey, turkey hot dogs |
Other Meat/Other Poultry
|
|
| Game | wild boar, venison |
| Dairy | fluid milk, hard and soft cheese |
| Eggs | whole shell eggs, egg products |
| Aquatic Animals | |
| Fish | catfish, grouper, tuna |
Other Seafood
|
|
| Plants | |
| Grains-Beans | rice, wheat, pinto beans |
| Oils-Sugars | olive oil, canola oil, sugars, honey |
| Fruits | melons, apples, cherries, berries, mangoes, avocados |
| Seeded Vegetables | cucumbers, tomatoes, legumes, sweet corn |
| Sprouts | alfalfa sprouts, mung bean sprouts |
| Vegetable Row Crops | leafy greens (lettuce, spinach), celeries, broccoli |
Other Produce
|
|
Acknowledgments
The methods used for this report were developed by members of the Interagency Food Safety Analytics Collaboration (IFSAC), which includes the Centers for Disease Control and Prevention (CDC), the U.S. Food and Drug Administration (FDA), and the U.S. Department of Agriculture's Food Safety and Inspection Service (USDA-FSIS).
The following persons (listed alphabetically) contributed to or approved this report:
CDC
- Zhaohui Cui, PhD
- Cassie Hartley, MPH
- Robin Pendley Louis, DrPH, MPH
- Reese Tierney, MPH (project lead)
- Daniel Weller, PhD
FDA
- Michael Bazaco, PhD, MS
- Spencer Carran, PhD
- Christina K. Carstens, PhD, MS
- Cary Chen Parker, MPH
- Christopher Waldrop, MPH
USDA-FSIS
- Andrea Cote, DVM, MPH, DACVPM
- Lesley Good, MS, MPH
- Bailey McWilliams, MS
CDC
- Jennifer Cope, MD, MPH
- Megin Nichols, DVM, MPH, DACVPM
- Hilary Whitham, PhD, MPH
FDA
- Michael Batz, MS
- Stic Harris, DVM, MPH
USDA-FSIS
- Joanna Zablotsky Kufel, PhD, MPH
- Damon Ranftle, DVM
Suggested citation
Interagency Food Safety Analytics Collaboration. IFSAC 2023 annual report: Foodborne illness source attribution estimates for Salmonella, Escherichia coli O157, and Listeria monocytogenes, United States, a weighted approach using 1998–2023 outbreak data. GA and D.C.: U.S. Department of Health and Human Services, Centers for Disease Control and Prevention, Food and Drug Administration, U.S. Department of Agriculture's Food Safety and Inspection Service. March 27, 2026.
- While the IFSAC Annual Attribution Report currently focuses only on the O157 serotype of E. coli, IFSAC is currently evaluating ways to incorporate non-O157 E. coli into these estimates.
- Foodborne illness acquired in the United States – Major Pathogens, 2019 (2025). Scallan Walter EJ, Cui Z, Tierney R, et al. Emerging Infectious Diseases, 31(4): 669–77.
- An updated scheme for categorizing foods implicated in foodborne disease outbreaks: A tri-agency collaboration (2017). Richardson LC, Bazaco MC, Parker CC, et al. Foodborne Pathogens and Disease, 14(12): 701–710.
- Recency-weighted statistical modeling approach to attribute illnesses caused by 4 pathogens to food sources using outbreak data, United States (2021). Batz MB, Richardson LC, Bazaco MC, et al. Emerging Infectious Diseases, 27(1): 214–22.
- Surveillance for foodborne disease outbreaks — United States, 1998–2008 (2013). Gould LH, Walsh KA, Vieira AR, et al. Morbidity and Mortality Weekly Report. Surveillance summaries, 62(2), 1–34.
- Surveillance for Foodborne Disease Outbreaks, United States, 2015, Annual Report (2017). US Department of Health and Human Services, Centers for Disease Control and Prevention. Atlanta, Georgia.
- National Outbreak Reporting System (NORS) Guidance (2017). US Department of Health and Human Services, Centers for Disease Control and Prevention. [accessed on August 4, 2025].
- The epidemiology of human listeriosis (2007). Swaminathan B & Gerner-Smidt P. Microbes and Infection, 9(10): 1236–43.
- Multistate outbreak of listeriosis associated with cantaloupe (2013). McCollum JT, Cronquist AB, Silk BJ, et al. New England Journal of Medicine, 369(10): 944–53.
- Notes from the field: listeriosis associated with stone fruit – United States, 2014 (2015). Jackson BR, Salter M, Tarr C, et al. Morbidity and Mortality Weekly Report, 64(10): 282–3.
- Evaluation of avocados as a possible source of Listeria infections – United States, 2016–2019 (2021). Pomeroy M, Conrad A, Pettengill JB, et al. Journal of Food Protection, 84(7): 1122–26.
- National Outbreak Reporting System. [accessed on August 4, 2025]
- An overview of foodborne sample-initiated retrospective outbreak investigations and interagency collaboration in the United States (2023). Wellman A, Bazaco MC, Blessington T, et al. Journal of Food Protection, 86(6): 100089.