Data file for the Extended CDC BMI-for-age Growth Charts for Children and Adolescents
The Extended CDC BMI-for-age growth charts use a new method for calculating BMI percentiles and z-scores above the 95th percentile. BMI percentiles and z-scores up to the 95th percentile (z-score 1.645) are the same as those in the 2000 CDC BMI-for-age growth charts and the L,M,S parameters, selected percentiles (3rd, 5th, 10th, 25th, 50th, 75th, 85th, 90th, 95th), and z-scores (-2, -1.5, -.5, 0, .5, 1, 1.5) are identical to those in the data files for the CDC 2000 BMI-for-age growth charts. Newly developed percentiles above the 95th percentile up to the 99.99th percentile (z-scores up to 5), and LMS and sigma parameters for the Extended CDC BMI-for-age growth charts are contained in the following data files.
Selected percentiles and z-scores with LMS and sigma parameters [CSV – 122 KB]
This file contains the L, M, S, and sigma parameters needed to generate exact percentiles and z-scores from the 3rd to 95th percentiles by sex (1=male; 2=female) and single month of age. The LMS parameters are the median (M), the generalized coefficient of variation (S), and the power in the Box-Cox transformation (L). Sigma is the dispersion parameter used in the calculation of BMI percentiles and z-scores above the 95th percentile (z-score 1.645).
Age is listed at the half month point for the entire month; for example, 48.5 months represents 48.0 months up to but not including 49.0 months of age.
Calculate the z-score and corresponding percentile for a given BMI
To obtain a z-score or percentile, first determine if the BMI is above or below the 95th percentile by comparing it to the sex- and age-specific value of the “P95” column in the data table.
If the BMI is less than or equal to the 95th percentile:
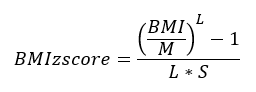

L, M, and S are the values from the data table corresponding to the sex of the child and the age in months. Φ and Φ-1 are the cumulative distribution function (CDF) of the standard normal distribution and its inverse function. Standard normal distribution tables can be found in statistics textbooks, online sources, and statistical computer programs.
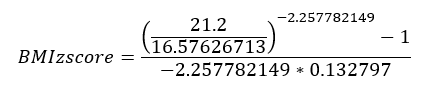
Example:
A girl aged 9 years and 6 months (114.5 months) with BMI = 21.2. For this girl, P95 (95th percentile) is 22.3979 so her BMI is below the 95th percentile and L = -2.257782149, M = 16.57626713, and S = 0.132796819.


If the BMI is greater than the 95th percentile:


Sigma is the value from the data table corresponding to the sex of the child and the age in months. Φ and Φ-1 are the cumulative distribution function (CDF) of the standard normal distribution and its inverse function. Standard normal distribution tables can be found in statistics textbooks, online sources, and statistical computer programs.
Example:
A boy aged 4 years and 2 months (50.5 months) with BMI = 22.6. For this boy, P95 (95th percentile) is 17.8219 so his BMI is above the 95th percentile and sigma = 2.3983.


Calculate the BMI for a given z-score or percentile
The calculation of BMI for a given z-score or percentiles up to the 95th percentile (z = 1.645) is different from its calculation above the 95th percentile.
If the percentile is less than or equal to 95 or the z-score is less than or equal to 1.645:

Example:
A girl aged 15 years and 4 months (184.5 months) at a z-score of 1.5 (93.3rd percentile), which is below the 95th percentile. L = -2.060616513, M = 20.11172291, and S = 0.150079322.


If the percentile is greater than 95 or the z-score is greater than 1.645:

Example:
A boy aged 7 years and 8 months (92.5 months) at the 98.7th percentile (z-score =2.226), which is above the 95th percentile. Sigma = 3.8373 and P95 = 19.7477.


Note on rounding: It is recommended to use all significant digits for intermediate calculations and then round the final result, as appropriate.
To perform the above calculations at age intervals finer than 1 month:
- Interpolate L, M, and S values given in the data table
- Use the following regression equations to calculate sigma:
Girls:

Boys:

References:
- Flegal KM, Cole TJ. Construction of LMS parameters for the Centers for Disease Control and Prevention 2000 growth chart. National health statistics reports; no 63. Hyattsville, MD: National Center for Health Statistics. 2013.
- Wei R, Ogden CL, Parsons VL, Freedman DS, Hales CM. A method for calculating BMI z-scores and percentiles above the 95th percentile of the CDC growth charts. Ann Hum Biol. 2020 Sep;47(6):514-521.