


At a glance
Overview
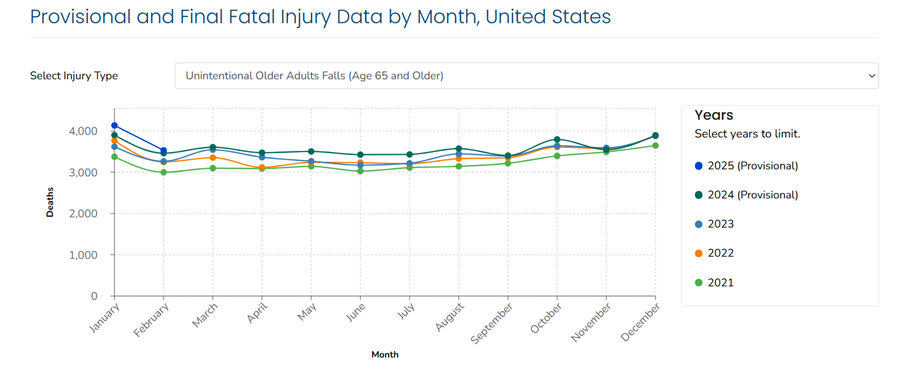
Falls are the leading cause of injury for adults ages 65 years and older.1 Over 14 million, or 1 in 4 older adults report falling every year.2 This chart shows the number of older adult fall-related deaths by month and year, including the most recent provisional data available. You can access the full interactive chart by clicking on the link below.
Falls among adults aged 65 and older are common, costly, and preventable. Falls are the leading cause of fatal and nonfatal injuries among older adults.1
Keep reading to learn more about the falls and fall death rates in your state.
Deaths from older adult falls
Falls are the leading cause of injury-related death among adults ages 65 and older, and the fall death rate is increasing.3 The age-adjusted fall death rate increased by 21% from 64.7 per 100,000 older adults in 2018 to 78.4 per 100,000 older adults in 2024.4
The rising number of deaths from falls among older adults can be addressed by screening for fall risk and intervening to address risk factors such as use of medicines that may increase fall risk, or poor strength and balance.
For more information on how to screen, assess, and intervene to reduce fall risk, visit www.cdc.gov/STEADI.
Select a year from the drop down to change the map information.
Data source: Centers for Disease Control and Prevention, National Center for Health Statistics. National Vital Statistics System, Mortality 2018-2024 on CDC WONDER Online Database, released in 2026. Data are from the Multiple Cause of Death Files, 2018-2024, as compiled from data provided by the 57 vital statistics jurisdictions through the Vital Statistics Cooperative Program. Accessed at http://wonder.cdc.gov/ucd-icd10-expanded.html on Feb 24, 2026.
*Age-adjusted death rates standardized to the 2000 U.S. population with age groups 65–74, 75–84, and ≥85 years using the direct method.
**Rates are marked as "unreliable" when the death count is less than 20.
This page was last updated on this date. Updates may include minor edits, image changes, or other modifications to page content.
The information on this page was last reviewed by subject matter experts to ensure accuracy.
- Centers for Disease Control and Prevention, National Center for Injury Prevention and Control. Web–based Injury Statistics Query and Reporting System (WISQARS) [online].
- Kakara R, Bergen G, Burns E, Stevens M. Nonfatal and Fatal Falls Among Adults Aged ≥65 Years—United States, 2020–2021. MMWR Morbidity and Mortality Weekly Report. 2023;72:938–943. DOI: 10.15585/mmwr.mm7235a1.
- Kakara RS, Lee R, Eckstrom EN. Cause-Specific Mortality Among Adults Aged ≥65 Years in the United States, 1999 Through 2020. Public Health Reports. 2023 March;139(1):54–58. DOI: 10.1177/00333549231155869.
- Centers for Disease Control and Prevention, National Center for Health Statistics. National Vital Statistics System, Mortality 2018-2024 on CDC WONDER Online Database, released in 2026. Data are from the Multiple Cause of Death Files, 2018-2024, as compiled from data provided by the 57 vital statistics jurisdictions through the Vital Statistics Cooperative Program. Accessed at http://wonder.cdc.gov/ucd-icd10-expanded.html on Feb 24, 2026.
- Moreland B, Kakara R, Henry A. Trends in Nonfatal Falls and Fall-Related Injuries Among Adults Aged ≥65 Years—United States, 2012–2018. MMWR Morbidity and Mortality Weekly Report. 2020 July 10;69(27):875–881. DOI: 10.15585/mmwr.mm6927a5.