


Key points
- Babesiosis is a nationally notifiable condition.
- Currently, 41 states and the District of Columbia notify CDC of cases.
- Between 2012 and 2023, annual case counts of babesiosis in the United States have been as low as 900 and as high as 3,500.
Babesiosis maps
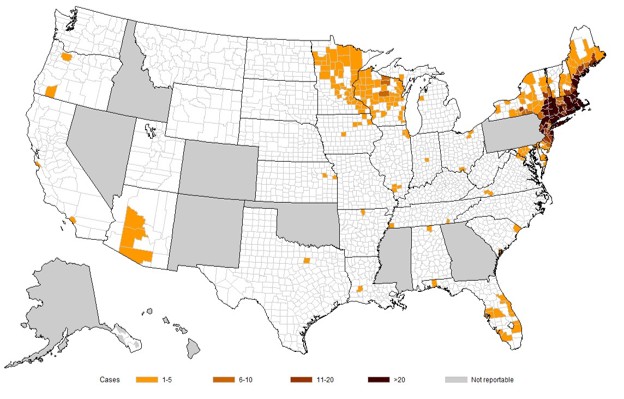
2021
Number* of reported cases of babesiosis, by county of residence — 40 states, 2021†
* N = 2,663; county of residence was known for all but 1 (0.04%) of the 2,664 total cases.
† Year as reported by the health department.
2020
Number* of reported cases of babesiosis, by county of residence — 40 states, 2020†, ‡
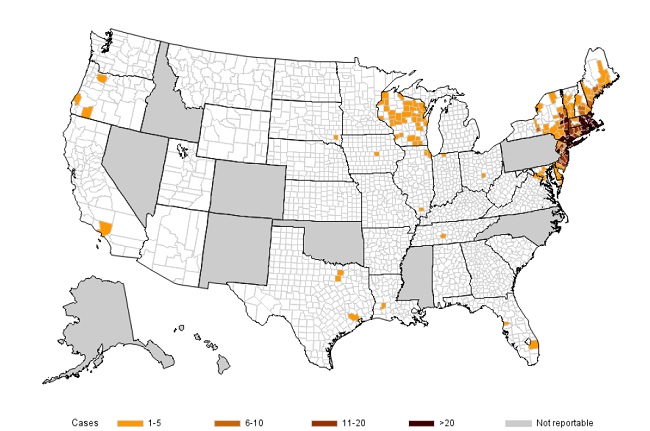
* N = 1,826; county of residence was known for all but 1 (<1%) of the 1,827 total case-patients. See the Appendix for the maps for surveillance years 2011–2019.
† Year as reported by the health department.
‡ 2020 data may be lower or higher than previous years. COVID-19 likely had an impact on public health activities including case identification, case investigations (limited case investigations or none), as well as possibly impacting transmission rates. This may reflect the impact of isolation and prevention measures, whether people sought health care when they were ill, and other changes in behavior during the COVID-19 pandemic period.
2019
Number* of reported cases of babesiosis, by county of residence — 40 states, 2019
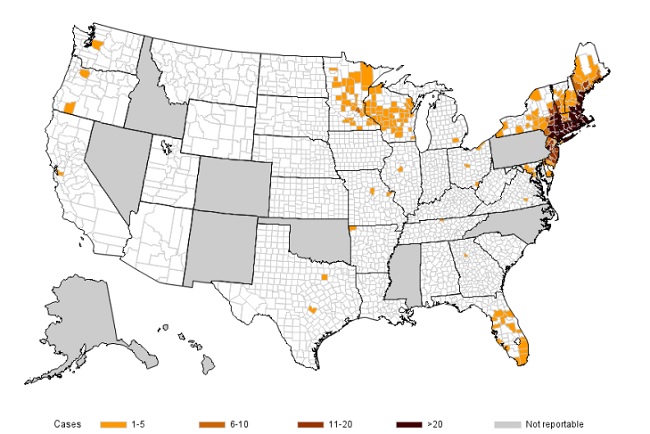
* N = 2,417; county of residence was known for all but 1 (<1%) of the 2,418 total case-patients. See the Appendix for the maps for surveillance years 2011–2018.
† Year as reported by the health department.
2018
Number* of reported cases of babesiosis, by county of residence — 40 states, 2018†
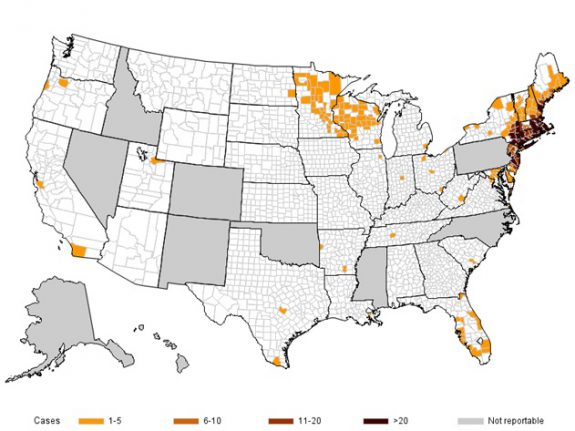
* N = 2,144; county of residence was known for all but 17 (1%) of the 2,161 total case-patients. See the Appendix for the maps for surveillance years 2011–2017.
† Year as reported by the health department.
Babesiosis graphs
Number* of reported cases of babesiosis, by year, 2011–2021† ‡
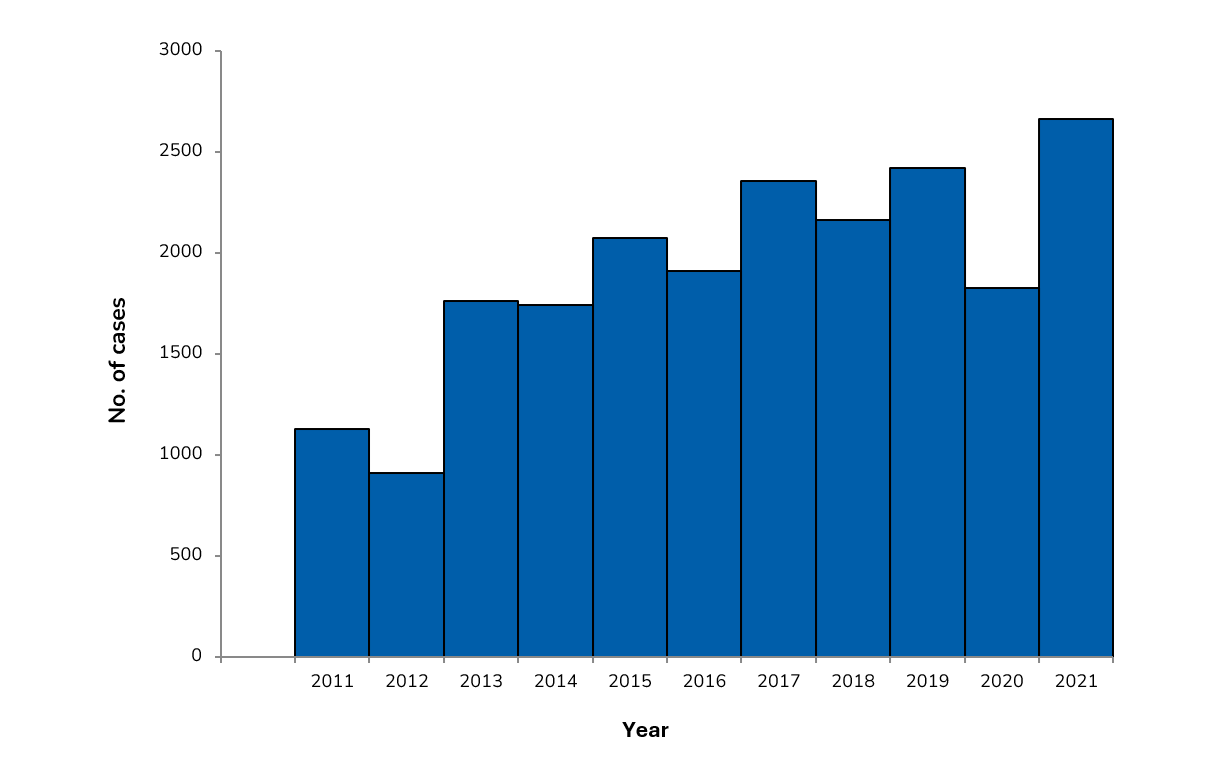
* A total of 20,953 cases of babesiosis were reported (2011, n=1,126; 2012, n=911; 2013, n=1,761; 2014, n=1,744; 2015, n=2,074; 2016, n=1,909; 2017, n=2,358; 2018, n=2,161; 2019, n=2,418; 2020, n=1,834; 2021, n=2664).
† Year as reported by the health department.
‡ 2020 and 2021 data may have been impacted by the COVID-19 pandemic.
Number of reported cases of babesiosis, by age group* in years, 2021†
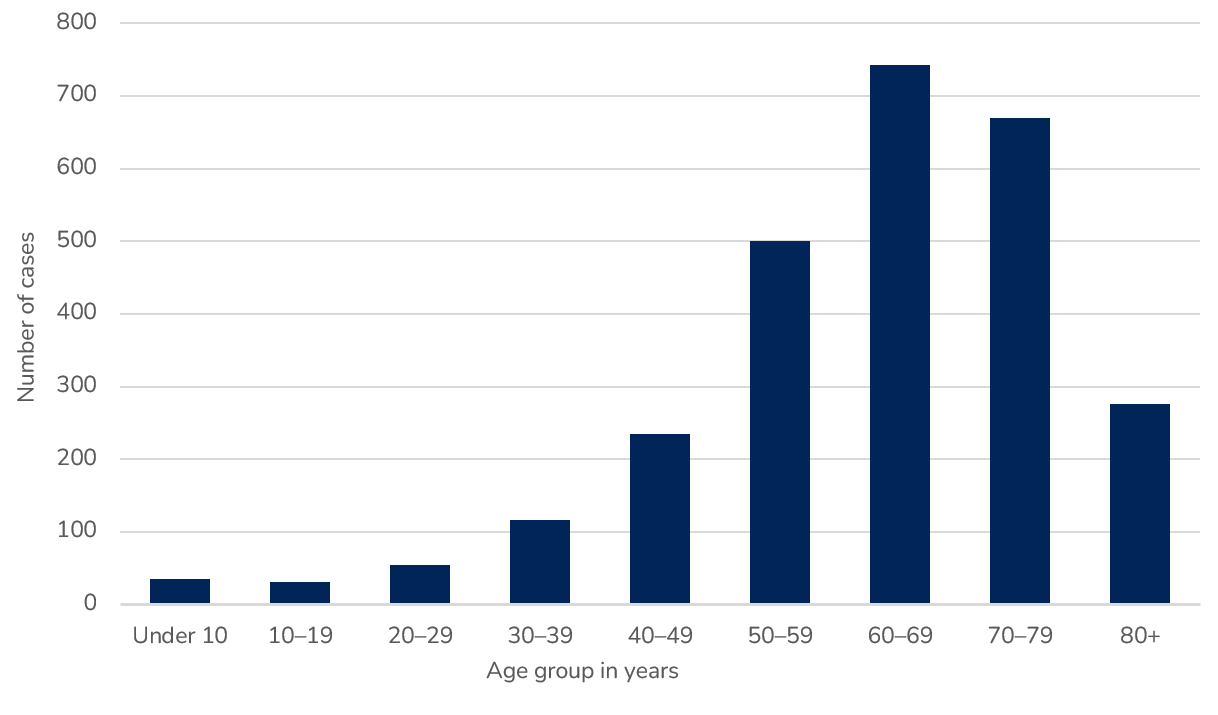
* Data on age were available for all cases (2021, n=2,664)
† Year as reported by the health department.
This page was last updated on this date. Updates may include minor edits, image changes, or other modifications to page content.
The information on this page was last reviewed by subject matter experts to ensure accuracy.