College Sports–Related Injuries — United States, 2009–10 Through 2013–14 Academic Years
, PhD1; , PhD2; , PhD1; , MS3; , PhD4; , MD5
Sports-related injuries can have a substantial impact on the long-term health of student-athletes. The National Collegiate Athletic Association (NCAA) monitors injuries among college student-athletes at member schools. In academic year 2013–14, a total of 1,113 member schools fielded 19,334 teams with 478,869 participating student-athletes in NCAA championship sports (i.e., sports with NCAA championship competition) (1). External researchers and CDC used information reported to the NCAA Injury Surveillance Program (NCAA-ISP) by a sample of championship sports programs to summarize the estimated national cumulative and annual average numbers of injuries during the 5 academic years from 2009–10 through 2013–14. Analyses were restricted to injuries reported among student-athletes in 25 NCAA championship sports. During this period, 1,053,370 injuries were estimated to have occurred during an estimated 176.7 million athlete-exposures to potential injury (i.e., one athlete's participation in one competition or one practice). Injury incidence varied widely by sport. Among all sports, men's football accounted for the largest average annual estimated number of injuries (47,199) and the highest competition injury rate (39.9 per 1,000 athlete-exposures). Men's wrestling experienced the highest overall injury rate (13.1 per 1,000) and practice injury rate (10.2 per 1,000). Among women's sports, gymnastics had the highest overall injury rate (10.4 per 1,000) and practice injury rate (10.0 per 1,000), although soccer had the highest competition injury rate (17.2 per 1,000). More injuries were estimated to have occurred from practice than from competition for all sports, with the exception of men's ice hockey and baseball. However, injuries incurred during competition were somewhat more severe (e.g., requiring ≥7 days to return to full participation) than those acquired during practice. Multiple strategies are employed by NCAA and others to reduce the number of injuries in organized sports. These strategies include committees that recommend rule and policy changes based on surveillance data and education and awareness campaigns that target both athletes and coaches. Continued analysis of surveillance data will help to understand whether these strategies result in changes in the incidence and severity of college sports injuries.
During the 5 academic years from 2009–10 through 2013–14, injuries and athlete-exposures were voluntarily reported to NCAA-ISP by participating team athletic trainers, using a web-based platform. The number of teams participating in NCAA-ISP varied by sport and year (2). Overall, participation among teams for the study period ranged from a low of 0.7% in men's tennis to a high of 13.2% in men's ice hockey. Data were aggregated across all schools and across all available years for 12 men's championship sports and 13 women's championship sports. Variables examined included the sport, whether the injury occurred during practice or competition, and whether the player required emergency transport, surgery, or ≥7 days before return to full participation. Injuries were defined as those that occurred in an organized NCAA-approved practice or competition and required medical attention by a physician or athletic trainer (2). An athlete-exposure was defined as one student-athlete's participation in one practice or one competition. Injury rates were calculated by dividing the number of injuries by the number of athlete-exposures. Competition-to-practice injury rate ratios were calculated by dividing the competition injury rate by the practice injury rate. To create national estimates, each injury and exposure was assigned a sample weight on the basis of the inverse of the school selection probability, using stratifications based on sport, division, and academic year (3). The national estimates were then adjusted for potential underreporting (3). For example, over the 5-year study period, among the 123 team seasons of men's football from which data were acquired, 8,680 injuries from 899,321 athlete-exposures were reported by participating team athletic trainers. These data, when weighted and adjusted, produced national estimates of 235,993 injuries and 25,770,273 athlete-exposures (or estimated annual averages of 47,199 injuries and 5,154,055 athlete-exposures).
Among all 25 sports, an estimated 28,860,299 practice athlete-exposures and 6,472,952 competition athlete-exposures occurred each year. The 1,053,370 injuries estimated during the 5 academic years studied represented an average of 210,674 total injuries per year (Table 1), among which, 134,498 (63.8%) occurred during practices. Overall, 21.9% of all injuries required ≥7 days before return to full participation (competition: 24.6%; practice: 20.5%) (Figure 1). Among all injuries, those incurred during competition were somewhat more severe than those acquired during practice; overall, 4.0% of injuries required surgery (competition: 5.4%; practice: 3.1%), and 0.9% required emergency transport (competition: 1.4%; practice: 0.6%) (Table 2). These data equated to estimated annual averages of 46,231 injuries that required ≥7 days before the athlete could return to full participation; 8,367 that required surgery; and 1,904 that required emergency transport. Approximately half of all injuries were diagnosed as sprains or strains (competition: 45.9%; practice: 45.0%) (Table 1). Sprains (including anterior cruciate ligament tears) and strains also accounted for the largest proportions of injuries in competition and practice requiring ≥7 days before return to full participation, (52.1% and 47.8%, respectively) and the largest proportion of injuries requiring surgery (57.7% and 52.9%, respectively). In addition, sprains and strains accounted for the largest proportion of practice-related injuries requiring emergency transport (29.4%); however, during competition, the largest proportions of injuries requiring emergency transport were fractures, stress fractures, dislocations, and subluxations (25.8%), and concussions (22.0%).
Among men's sports, football accounted for the largest percentage of athlete-exposures (14.6% of all athlete-exposures and 31.2% of all male athlete-exposures), and football teams were estimated to have the highest number of injuries per year (47,199; 22.4% of all injuries and 36.3% of all male injuries). Football also had the highest competition injury rate (39.9 injuries per 1,000 athlete-exposures) and competition-to-practice rate ratio (6.8) (Figure 2) and the third highest overall injury rate (9.2 per 1,000) (Table 1). Overall, football accounted for the largest proportions of injuries requiring ≥7 days before return to full participation (26.2%), surgery (40.2%), and emergency transport (31.9%). Men's wrestling had the highest overall injury rate (13.1 per 1,000 athlete-exposures) and the highest practice injury rate (10.2 per 1,000). Swimming and diving had the lowest overall injury rate (1.7 per 1,000). The rates of injury during competition were higher than during practice for all men's sports. However, more injuries occurred in practices than in competitions for all men's sports except ice hockey and baseball.
Among women's sports, soccer accounted for the highest estimated number of injuries per year (15,113), and the highest competition injury rate (17.2 per 1,000); the competition-to-practice rate ratio was 3.1 (Figure 2). Gymnastics had the highest overall injury rate (10.4 per 1,000 athlete-exposures) and practice injury rate (10.0 per 1,000). The lowest overall estimated injury rate (1.8 per 1000) was for swimming and diving. Injury rates were significantly higher during competitions than practices for all women's sports except volleyball, indoor track, and swimming and diving. Compared with practice injuries, a larger proportion of competition injuries required ≥7 days before return to full participation for eight of the 13 women's sports (Figure 1). However, more injuries occurred in practices than in competitions for all women's sports because more than twice as many athlete-exposures each year occurred in practices compared with competition (55,670 versus 25,004).
Among men and women, overall injury rates were similar for soccer, swimming and diving, tennis, and both indoor and outdoor track and field. However, overall injury rates were significantly higher among men than women in basketball, ice hockey, and lacrosse. Overall injury rates were significantly higher among women than men in cross country.
Discussion
Men's football accounts for the most college sport injuries each year, as well as the largest proportions of injuries requiring ≥7 days before return to full participation, or requiring surgery or emergency transport. Thus, prevention efforts that focus on football will target the largest number of severe injuries. The large overall number of football-related injuries is attributable to football having the largest number of student-athletes (71,291 during the 2013–14 academic year) among all 25 reported NCAA sports (16.1%) (2). Although wrestling had the highest overall injury rate among all 25 reported NCAA sports, the number of student-athlete wrestlers was much smaller (6,982). At the same time, the competition injury rates in wrestling and football were nearly equivalent, although the practice injury rate in wrestling was higher than that in football. Among women's sports, gymnastics had the highest rate of injury each year, whereas soccer contributed the largest number of injuries. Many of these data are consistent with earlier reports and can be used to guide resource allocation decisions and research to identify specific risk factors or to evaluate prevention measures (4). It is also important to note that the injury rates reported from these data are higher than those reported from NCAA-ISP before 2004–05 (4) because, unlike previous estimates, rates since the 2009–10 academic year have included injuries requiring <1 day before return to full participation.
The relationship between injury numbers and rates in practice and competition is similar to previous findings (4). Competition injury rates were higher than practice injury rates, and more than five-fold higher for men's football and ice hockey. This difference might be attributable to a higher intensity of activity during competitions compared with practices; in most sports, the proportion of injuries requiring ≥7 days before return to full participation was higher in competitions than in practices. However, a larger number of injuries occurred during practices than competition, because there were nearly 4.5 times as many practice athlete-exposures as competition athlete-exposures. Approximately one in five practice injuries required ≥7 days before return to full participation. Major injuries, such as concussion or those resulting in surgery or emergency transport, occurred commonly in both competition and practice. Injury prevention strategies that target not only competition, but also the more controlled practice environment, might provide additional opportunities to reduce injury incidence.
The findings in this report are subject to at least four limitations. First, not all sports have athletic trainers present at every practice; therefore, practice and overall injury rates might be underreported and thus underestimated in certain sports. Second, these data are descriptive and cannot be used to ascertain reasons for the various injury rates. Third, multiple years of data were required to be combined to provide stable annual estimates. For methodologic reasons, it cannot be ascertained whether rates have changed over time. Additional years of injury surveillance will aid detection of changes in injury incidence and severity. Finally, although weights were used to calculate national rate estimates, these data are drawn from reports from participating teams, which amounts to a convenience sample and not a random sample. Thus, these data might not be generalizable to all teams in all NCAA member schools.
Sports injury data, such as those collected by NCAA-ISP, have been used to describe the incidence of injury, develop and evaluate various rule and policy changes (e.g., changing football kickoff and touchback yard lines to reduce injuries*), guide resource allocation, and focus injury prevention efforts (2,4–10). NCAA-ISP data are now available online to researchers to aid in their analyses of sports injuries and in their development of strategies for injury prevention.†
1Datalys Center for Sports Injury Research and Prevention, Indianapolis, Indiana; 2University of North Carolina Injury Prevention Research Center, Chapel Hill; 3State Health Registry of Iowa, Iowa City; 4University of Maryland, College Park, Maryland; 5Division of Unintentional Injury Prevention, National Center for Injury Prevention and Control, CDC.
Corresponding author: Thomas P. Dompier, tdompier@datalyscenter.org, 317-275-3664.
References
- National Collegiate Athletic Association. Sports sponsorship and participation rates. Indianapolis, IN: National Collegiate Athletic Association; 2014. Available at http://www.ncaa.org/about/resources/research/sports-sponsorship-and-participation-research.
- Kerr ZY, Dompier TP, Snook EM, et al. National collegiate athletic association injury surveillance system: review of methods for 2004–2005 through 2013–2014 data collection. J Athl Train 2014;49:552–60.
- Kucera KL, Marshall SW, Bell DR, DiStefano MJ, Goerger CP, Oyama S. Validity of soccer injury data from the National Collegiate Athletic Association's Injury Surveillance System. J Athl Train 2011;46:489–99.
- Hootman JM, Dick R, Agel J. Epidemiology of collegiate injuries for 15 sports: summary and recommendations for injury prevention initiatives. J Athl Train 2007;42:311–9.
- Gilchrist J, Mandelbaum B, Melancon H, et al. A randomized controlled trial to prevent non-contact ACL injury in female collegiate soccer players. Am J Sports Med 2008;36:1476–83.
- Reider B. An ounce of prevention. Am J Sports Med 2004;32:1383–4.
- Dick R, Putukian M, Agel J, Evans TA, Marshall SW. Descriptive epidemiology of collegiate women's soccer injuries: National Collegiate Athletic Association Injury Surveillance System, 1988–1989 through 2002–2003. J Athl Train 2007;42:278–85.
- Marshall SW, Covassin T, Dick R, Nassar LG, Agel J. Descriptive epidemiology of collegiate women's gymnastics injuries: National Collegiate Athletic Association Injury Surveillance System, 1988–1989 through 2003–2004. J Athl Train 2007;42:234–40.
- Yard EE, Comstock RD. Compliance with return to play guidelines following concussion in US high school athletes, 2005–2008. Brain Inj 2009;23:888–98.
- Parker EM, Gilchrist J, Schuster D, Lee R, Sarmiento K. Reach and knowledge change among coaches and other participants of the online course: "concussion in sports: what you need to know." J Head Trauma Rehabil 2015;30:198–206.
* Additional information available at http://www.ncaa.org/about/resources/media-center/news/playing-rules-oversight-panel-approves-rules-changes-football.
† Additional information available at http://www.datalyscenter.org/index.php.
Summary
What is already known on this topic?
The risk for injury to college athletes varies by the sport played, the sex of the athlete, and whether the athlete is engaged in practice or competition.
What is added by this report?
Data from the National Collegiate Athletic Association Injury Surveillance Program indicate that, among men's sports, the highest injury rates are in football and wrestling. For women, the highest injury rates are in soccer and gymnastics. Estimated injury rates are higher during competition than during practice. However, the majority of injuries overall and within most sports occur during practices because they are conducted more frequently than competitions.
What are the implications for public health practice?
Injury prevention strategies that target practices as well as competitions might provide additional opportunities for reduction in injury incidence. Injury surveillance data can be used to compare injury incidence across sports, develop and evaluate rule and policy changes, and focus injury prevention research and programs. Continual analysis of surveillance data will help to understand changes in the incidence and severity of college sports injuries.
|
TABLE 1. (Continued) Average annual national estimates of the number of injuries and athlete-exposures, and estimated injury rates, by 25 championship sports — National Collegiate Athletic Association Injury Surveillance Program, United States, 5 academic years, 2009–10 through 2013–14 |
||||
|---|---|---|---|---|
|
Season/Sport |
Event |
Average annual national |
Average annual national estimate of no. of athlete-exposures |
Estimated injury rate per 1,000 athlete-exposures (95% CI) |
|
Men's ice hockey |
Competition |
2,450 |
93,058 |
9.5 (9.2–9.9) |
|
Practice |
1,233 |
293,110 |
||
|
Overall |
3,684 |
386,168 |
||
|
Women's ice hockey |
Competition |
603 |
53,935 |
6.1 (5.6–6.6) |
|
Practice |
637 |
149,463 |
||
|
Overall |
1,240 |
203,398 |
||
|
Men's indoor track |
Competition |
1,373 |
211,773 |
4.0 (3.6–4.4) |
|
Practice |
6,955 |
1,876,621 |
||
|
Overall |
8,328 |
2,088,394 |
||
|
Women's indoor track |
Competition |
994 |
227,565 |
4.7 (4.3–5.1) |
|
Practice |
10,524 |
2,205,757 |
||
|
Overall |
11,519 |
2,433,322 |
||
|
Men's swimming and diving |
Competition |
223 |
112,986 |
1.7 (1.5–2.0) |
|
Practice |
1,954 |
1,133,451 |
||
|
Overall |
2,177 |
1,246,437 |
||
|
Women's swimming and diving |
Competition |
284 |
183,840 |
1.8 (1.6–2.1) |
|
Practice |
3,028 |
1,619,767 |
||
|
Overall |
3,312 |
1,803,607 |
||
|
Spring |
||||
|
Men's lacrosse |
Competition |
2,178 |
158,541 |
6.5 (6.1–6.9) |
|
Practice |
3,367 |
692,681 |
||
|
Overall |
5,545 |
851,222 |
||
|
Women's lacrosse |
Competition |
1,123 |
116,314 |
5.8 (5.3–6.2) |
|
Practice |
2,188 |
457,330 |
||
|
Overall |
3,311 |
573,644 |
||
|
Men's baseball |
Competition |
6,916 |
1,017,899 |
4.7 (4.3–5.0) |
|
Practice |
6,375 |
1,833,358 |
||
|
Overall |
13,292 |
2,851,256 |
||
|
Women's softball |
Competition |
3,797 |
639,974 |
4.6 (4.3–5.0) |
|
Practice |
3,832 |
1,009,896 |
||
|
Overall |
7,629 |
1,649,870 |
||
|
Men's outdoor track |
Competition |
1,304 |
239,387 |
2.7 (2.4–3.1) |
|
Practice |
2,980 |
1,323,022 |
||
|
Overall |
4,284 |
1,562,408 |
||
|
Women's outdoor track |
Competition |
1,541 |
304,598 |
3.5 (3.0–3.9) |
|
Practice |
4,626 |
1,473,276 |
||
|
Overall |
6,167 |
1,777,874 |
||
|
Men's tennis |
Competition |
1,304 |
130,025 |
5.7 (4.7–6.6) |
|
Practice |
2,218 |
493,238 |
||
|
Overall |
3,522 |
623,264 |
||
|
Women's tennis |
Competition |
1,220 |
160,631 |
5.9 (5.1–6.8) |
|
Practice |
2,720 |
503,000 |
||
|
Overall |
3,941 |
663,630 |
||
|
Abbreviation: CI = confidence interval. * Sums of competition and practice values do not equal overall values because of rounding. |
||||
FIGURE 1. Percentages of competition and practice injuries requiring ≥7 days before return to full participation, by 25 championship sports — National Collegiate Athletic Association Injury Surveillance Program, United States, 5 academic years, 2009–10 through 2013–14
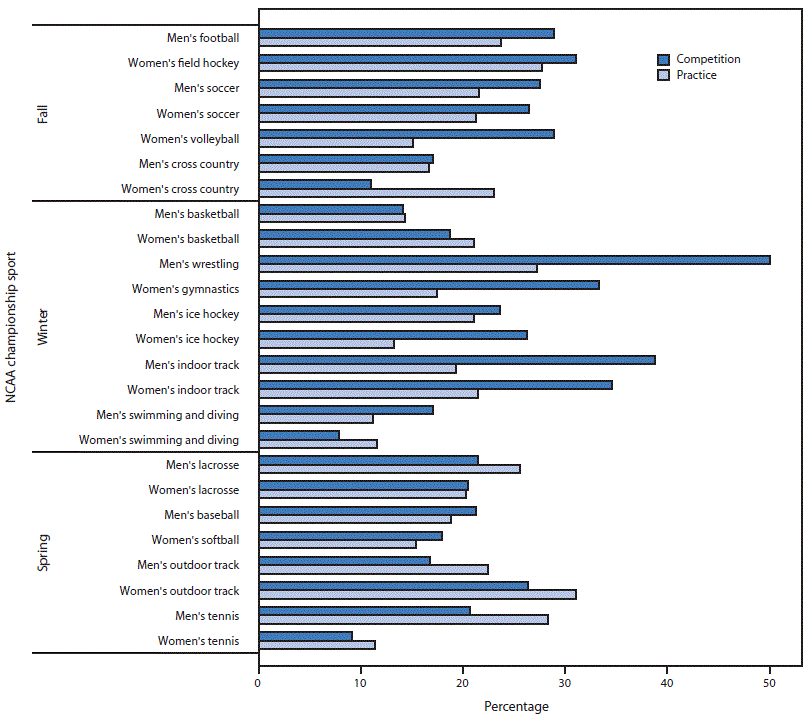
Alternate Text: The figure above is a bar chart showing percentages of competition and practice injuries requiring ≥7 days before return to full participation, by 25 championship sports in the United States for 5 academic years, 2009-10 through 2013-14.
FIGURE 2. Competition and practice injury rates per 1,000 athlete-exposures and competition/practice rate ratios, by 25 championship sports — National Collegiate Athletic Association Injury Surveillance Program, United States, 5 academic years, 2009–10 through 2013–14
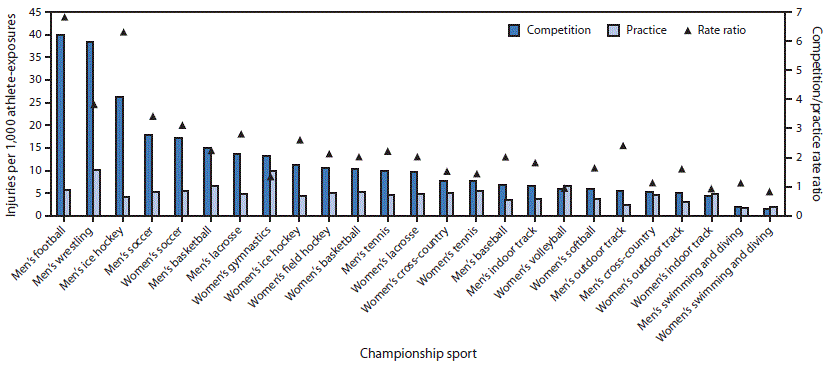
Alternate Text: The figure above is a bar chart showing competition and practice injury rates per 1,000 athlete-exposures and competition/practice rate ratios, by 25 championship sports in the United States for 5 academic years, 2009-10 through 2013-14.
Use of trade names and commercial sources is for identification only and does not imply endorsement by the U.S. Department of
Health and Human Services.
References to non-CDC sites on the Internet are
provided as a service to MMWR readers and do not constitute or imply
endorsement of these organizations or their programs by CDC or the U.S.
Department of Health and Human Services. CDC is not responsible for the content
of pages found at these sites. URL addresses listed in MMWR were current as of
the date of publication.
All MMWR HTML versions of articles are electronic conversions from typeset documents.
This conversion might result in character translation or format errors in the HTML version.
Users are referred to the electronic PDF version (http://www.cdc.gov/mmwr)
and/or the original MMWR paper copy for printable versions of official text, figures, and tables.
An original paper copy of this issue can be obtained from the Superintendent of Documents, U.S.
Government Printing Office (GPO), Washington, DC 20402-9371;
telephone: (202) 512-1800. Contact GPO for current prices.
**Questions or messages regarding errors in formatting should be addressed to
mmwrq@cdc.gov.
