Persons using assistive technology might not be able to fully access information in this file. For assistance, please send e-mail to: mmwrq@cdc.gov. Type 508 Accommodation and the title of the report in the subject line of e-mail.
State Tobacco Revenues Compared with Tobacco Control Appropriations — United States, 1998–2010
In 1999, CDC published Best Practices for Comprehensive Tobacco Control (1), which outlined the elements of an evidence-based state tobacco control program and provided a recommended state funding range to substantially reduce tobacco-related disease, disability, and death. Best Practices recommended that states invest a combined $1.6–$4.2 billion annually in such programs and subsequently updated that recommendation to $3.7 billion annually in 2007 (2). To analyze states' historical investments in tobacco control and calculate the amount of funding necessary to achieve Best Practices recommendations, CDC tracked data from 1998 to 2010. During this period, states collected $243.8 billion in total tobacco revenues from tobacco industry settlement payments and cigarette excise taxes. State and federal appropriations for tobacco control totaled $8.1 billion, whereas CDC's Best Practices recommended funding of at least $29.2 billion ($1.6 billion for 9 years plus $3.7 billion for 4 years). For the entire study period, the ratio of state tobacco revenues to state and federal tobacco control appropriations was approximately 30 to 1 ($243.8 billion to $8.1 billion); in 2010, the ratio was approximately 37 to 1 ($23.96 billion to $0.64 billion). If states allocated funding for tobacco control at Best Practices levels, they could achieve larger and more rapid reductions in smoking and associated morbidity and mortality (2,3).
All 50 states and the District of Columbia (DC)* have state tobacco control programs that are funded through various revenue streams, including tobacco industry settlement payments, cigarette excise tax revenues, state general funds, the federal government, and nonprofit organizations (2,3). These programs reflect a coordinated effort to use evidence-based policies and practices that build state and local capacity and infrastructure to fully implement, support, and monitor population-based interventions that reduce tobacco use, prevent youth initiation, and eliminate secondhand smoke exposure (1,3). Evidence-based interventions include increasing the price of cigarettes, enacting comprehensive smoke-free policies, funding mass media campaigns, and making cessation services fully accessible to tobacco users (1–3).
In 1998, 46 states and DC reached an agreement, known as the Master Settlement Agreement (MSA), which resulted in the tobacco industry providing approximately $206 billion in revenue over a 25-year period (2). The four states that did not participate in the MSA (Florida, Minnesota, Mississippi, and Texas) had settled previously for approximately $40 billion to be paid over the same period (2). The MSA stipulated that overall state payments would be adjusted based on changes in inflation, cigarette consumption, and market share. However, although the intent of the lawsuit was to reimburse states for Medicaid costs related to tobacco use and to prevent youth initiation of smoking, the agreement did not stipulate that MSA revenues be dedicated to tobacco prevention and cessation efforts (2,4).
For this analysis, net state cigarette excise tax revenues were obtained from The Tax Burden on Tobacco (5), and annual settlement revenues data† were obtained from the National Association of Attorneys General§ and the Campaign for Tobacco Free Kids (6). Annual state tobacco control investments for the period 1998–2010 were obtained from the ImpacTeen Project,¶ and include state and federal appropriations to each state for tobacco control program efforts. To compare revenues with investments, all state and federal appropriations were adjusted to a fiscal year ending June 30 and are presented as annual dollar amounts. To compare with 2007 Best Practices recommendations, the 2010 appropriations also are presented as percentages of those recommendations.
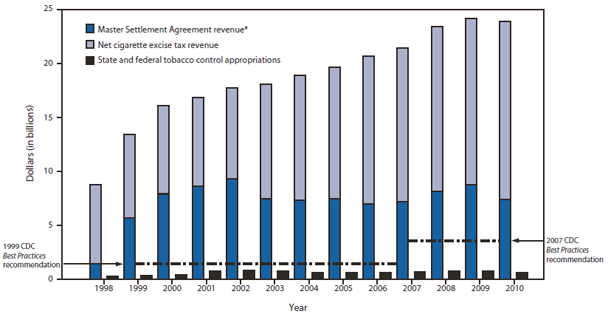
From 1998 to 2010, the average state cigarette excise tax among all states increased from $0.39 to $1.44 per pack, resulting in a doubling of annual state excise tax revenues from $7.4 billion to $16.5 billion. In 2010, the excise tax ranged from $0.17 per pack in Missouri to $4.35 per pack in New York. During 1998–2010, annual settlement revenues increased from $1.4 billion in 1998, peaked at $9.3 billion in 2002, declined to $7.5 billion in 2003, and remained level at $7.4 billion in 2010 (Figure). Total annual state tobacco-related revenue (i.e., from excise taxes plus settlement payments) increased from $8.8 billion in 1998 to $24.0 billion in 2010 (Table 1).
Whereas tobacco-related revenue during the study period increased steadily, total state and federal appropriations for tobacco control increased from $262.3 million in 1998 to $820.9 million in 2002, but then decreased to $735.3 million in 2009 and to $641.1 million in 2010 (Table 2). Although 2002 marked the largest annual investment in tobacco control in U.S. history, state and federal appropriations that year amounted to only 51% of the 1999 minimum Best Practices recommendations (Figure). In 2010, the $641.1 million in appropriations was only 17.3% of the 2007 Best Practices recommendation (Table 2).
Reported by
Rachel Kaufmann, PhD, Epidemiology and Analysis Program Office, Office of Surveillance, Epidemiology, and Laboratory Svcs; John Francis, MPH, Div of Community Health, Michael A. Tynan, Terry Pechacek, PhD, Office on Smoking and Health, National Center for Chronic Disease Prevention and Health Promotion, CDC. Corresponding contributor: John Francis, jfrancis@cdc.gov, 770-488-6384.
Editorial Note
The results of this analysis show an increasing gap between state investments in tobacco control and Best Practices recommendations. Although all states derive revenues from cigarette excise taxes, few states have a statutory requirement requiring that a portion of these revenues be dedicated to tobacco control and prevention (2). Instead, most cigarette tax revenues are being used for general purposes. In addition, although state cigarette excise taxes have increased nationally, the Institute of Medicine has noted that recent tax increases largely have come in response to shortfalls in state budgets rather than as initiatives to increase spending on tobacco control (2).
Similarly, although the MSA ended state lawsuits to recover tobacco-related costs to Medicaid, and many state officials promised to dedicate funds to public health and tobacco control (particularly to youth smoking prevention),** states ultimately were not bound by the MSA or by Congress to allocate settlement revenues for tobacco control (3). Consequently, a very small percentage of settlement revenue has been dedicated by states for tobacco control programs and public health activities (4,7), and states increasingly have used this revenue for general purposes and to cover budget shortfalls (2,6). Additionally, approximately half of the states have securitized their settlement interests (i.e., sold the rights to future payments in exchange for an immediate smaller payment on some or all of their current and future settlement revenues); thus, future revenues are not available to be allocated to tobacco control programs in these states (7).
Today, many state programs have experienced, and are facing, substantial state government cuts to tobacco control funding, resulting in the near elimination of tobacco control programs in those states (6). By 2010, states were appropriating only 2.4% of their state tobacco revenues for tobacco control. Reaching the Best Practices 2007 funding goal would have required an additional 13.0% of tobacco revenues, or $3.1 billion of the $24 billion collected, in 2010.
The findings in this report are subject to at least four limitations. First, the state settlement and tax revenues included in this report do not include other revenues such as excise taxes collected on smokeless tobacco products, local excise taxes, and state or local sales taxes. For state sales taxes alone, an estimated $4.2 billion was collected in fiscal year 2010 from the sale of cigarettes (5). Therefore, the ratios between tobacco revenues and appropriations in this report are underestimated. Second, annual state investments in tobacco control include only state and federal appropriations and not necessarily the total dollar amount spent by tobacco control programs in a given year because of program practice and multiyear appropriations. Third, appropriations reflect initial state commitments to tobacco funding, but do not ensure that expenditures are used for Best Practices purposes. Finally, these data do not reflect substantial funding cuts in state programs in fiscal years 2011 and 2012.
Although reductions in adult cigarette smoking rates have been observed in recent years, the amount and direction of change in adult smoking rates have not been consistent from year to year (8). States that have made larger sustained investments in comprehensive tobacco control programs have seen cigarette sales drop approximately twice as much as in the United States overall, and smoking prevalence among adults and youths has declined faster as spending for tobacco control programs has increased in Arizona, California, Massachusetts, Minnesota, Maine, New York, Oregon, and Washington (2,3,9).
Evidence indicates that tobacco control programs are potentially cost-saving (2,3,9,10). For example, when California increased its state excise tax by $0.25 per pack in 1988, approximately $0.05 per pack was dedicated to tobacco prevention programs (2). In the initial years, California came close to meeting 1999 Best Practices recommendations and has maintained relatively stable funding since then. Adult smoking rates in California declined from 22.7% in 1988 to 13.1% in 2009, and the tobacco control program has been associated with substantial reductions in personal health-care expenditures (10).
Thirteen years after the MSA, approximately 3,800 U.S. children try their first cigarette each day. Of that number, an estimated 1,000 will become daily smokers, and nearly 300 eventually will die from tobacco-related illness. The more that states invest in comprehensive tobacco control programs and implement high-impact policies (e.g., cigarette excise tax increases, comprehensive smoke-free policies, and counter-marketing campaigns), the greater the reduction in youth initiation, tobacco-related disease and death, and tobacco-related health care costs and lost productivity (3,9,10).
Acknowledgments
Kimp Walton, MS, Office on Smoking and Health, National Center for Chronic Disease Prevention and Health Promotion, CDC. Jidong Huang, PhD, Institute for Health Research and Policy, Univ of Illinois at Chicago.
References
- CDC. Best practices for comprehensive tobacco control—1999. Atlanta, GA: US Department of Health and Human Services, CDC; 1999.
- CDC. Best practices for comprehensive tobacco control programs—2007. Atlanta, GA: US Department of Health and Human Services, CDC; 2007. Available at http://www.cdc.gov/tobacco/stateandcommunity/best_practices/index.htm. Accessed May 17, 2012.
- Institute of Medicine. Ending the tobacco problem: a blueprint for the nation. Washington, DC: The National Academies Press; 2007. Available at http://books.nap.edu/openbook.php?record_id=11795. Accessed May 21, 2012.
- Jones WJ, Silvestri GA. The Master Settlement Agreement and its impact on tobacco use 10 years later: lessons for physicians about health policy making. Chest 2010;137:692–700.
- Orzechowski W, Walker RC. The tax burden on tobacco. Vol. 45. Arlington, VA: Orzechowski and Walker; 2010.
- Campaign for Tobacco Free Kids. A broken promise to our children: the 1998 state tobacco settlement 13 years later. Washington, DC: Campaign for Tobacco Free Kids; 2011. Available at http://www.tobaccofreekids.org/what_we_do/state_local/tobacco_settlement. Accessed December 9, 2011.
- Niemeyer D, Miner KR, Carlson LM, Baer K, Shorty L. The 1998 Master Settlement Agreement: a public health opportunity realized—or lost? Health Promot Pract 2004;5(3 Suppl):21S–32S.
- CDC. Vital Signs: current cigarette smoking among adults aged ≥18 years—United States, 2005–2010. MMWR 2011;60:1207–12.
- Farrelly MC, Pechacek TF, Chaloupka FJ. The impact of tobacco control program expenditures on aggregate cigarette sales: 1981–2000. J Health Econ 2003;22:843–59.
- Lightwood JM, Dinno A, Glantz SA. Effect of the California tobacco control program on personal health care expenditures. PLoS Med 2008;5:e178.
* For this report, DC is included among the states.
† Settlement revenues include MSA payments and the settlement payments made to Florida, Mississippi, Minnesota, and Texas.
§ Additional information available at http://www.naag.org/backpages/naag/tobacco/msa-payment-info.
¶ Additional information available at http://www.impacteen.org.
** Additional information available at http://www.healthystates.csg.org/nr/rdonlyres/166be14e-eb47-4d36-a78f-2c2d390275d6/0/discouragingsmokinglpb.pdf.
What is already known on this topic?
CDC's Best Practices for Comprehensive Tobacco Control recommends that all states invest a combined $3.7 billion annually in evidence-based, statewide tobacco control programs.
What is added by this report?
During 1998–2010, states collected $243.8 billion in total tobacco revenues from the Master Settlement Agreement and cigarette excise taxes. State and federal appropriations for tobacco control totaled $8.1 billion, whereas CDC's Best Practices recommended funding of $29.2 billion.
What are the implications for public health practice?
If all states were to use a greater portion of future tobacco revenues to fund tobacco control and prevention programs at the levels recommended by CDC they could achieve larger and more rapid reductions in smoking and associated morbidity, mortality, and health-care costs.
FIGURE. Total state tobacco-related revenues and state and federal tobacco control appropriations compared with CDC Best Practices for Comprehensive Tobacco Controlrecommendations for tobacco control funding — United States, 1998–2010
* Additional information available at http://www.naag.org/backpages/naag/tobacco/msa-payment-info.
Alternate Text: The figure above shows total state tobacco-related revenues and state and federal tobacco control appropriations compared with CDC Best Practices for Comprehensive Tobacco Control recommendations for tobacco control funding in the United States, during 1998-2010. From 1998 to 2010, the average state cigarette excise tax among all states and the District of Columbia increased from $0.39 to $1.44 per pack, resulting in a doubling of annual state excise tax revenues from $7.4 billion to $16.5 billion. In 2010, the excise tax ranged from $0.17 per pack in Missouri to $4.35 per pack in New York. During 1998-2010, annual settlement revenues increased from $1.4 billion in 1998, peaked at $9.3 billion in 2002, declined to $7.5 billion in 2003, and remained level to $7.4 billion in 2010.
|
TABLE 2. Total state and federal tobacco control appropriations (in millions of dollars) — United States, 1998–2010* |
|||||||||||||||||
|---|---|---|---|---|---|---|---|---|---|---|---|---|---|---|---|---|---|
|
State† |
1999 Best Practices funding recommendation (range) |
2007 Best Practices§ funding recommendation |
1998 |
1999 |
2000 |
2001 |
2002 |
2003 |
2004 |
2005 |
2006 |
2007 |
2008 |
2009 |
2010¶ |
(2010 as % of 2007 Best Practices) |
Total 1998–2010 |
|
Alabama |
26.74–71.24 |
56.7 |
0.5 |
1.1 |
1.6 |
5.9 |
2.8 |
1.6 |
1.7 |
1.5 |
1.8 |
2.1 |
2.2 |
2.6 |
2.2 |
(3.9) |
27.7 |
|
Alaska |
8.09–16.51 |
10.7 |
0.4 |
1.0 |
2.5 |
2.5 |
4.1 |
6.1 |
4.9 |
5.2 |
7.1 |
7.5 |
8.8 |
9.4 |
8.6 |
(80.4) |
68.1 |
|
Arizona |
27.79–71.10 |
68.1 |
28.4 |
32.7 |
35.3 |
34.8 |
36.8 |
18.6 |
25.8 |
23.3 |
20.5 |
26.0 |
24.0 |
21.7 |
23.4 |
(34.4) |
351.1 |
|
Arkansas |
17.91–46.45 |
36.4 |
0.4 |
0.9 |
1.2 |
17.3 |
8.1 |
17.7 |
18.7 |
18.7 |
18.8 |
16.7 |
17.0 |
17.2 |
19.8 |
(54.4) |
172.3 |
|
California |
165.10–442.40 |
441.9 |
160.6 |
106.0 |
88.5 |
114.9 |
134.9 |
88.7 |
90.3 |
90.1 |
80.3 |
84.2 |
77.9 |
78.9 |
79.0 |
(17.9) |
1,274.4 |
|
Colorado |
24.55–63.26 |
54.4 |
1.3 |
0.9 |
1.3 |
14.1 |
14.1 |
8.9 |
5.2 |
5.6 |
28.6 |
26.4 |
27.5 |
27.8 |
12.4 |
(22.8) |
174.2 |
|
Connecticut |
21.24–53.90 |
43.9 |
0.3 |
1.0 |
5.0 |
2.0 |
1.6 |
1.6 |
1.5 |
1.0 |
1.2 |
3.2 |
1.2 |
8.6 |
7.2 |
(16.4) |
35.4 |
|
Delaware |
8.63–18.46 |
13.9 |
0.3 |
0.7 |
0.8 |
3.6 |
5.8 |
5.8 |
10.8 |
10.0 |
9.9 |
11.0 |
11.4 |
11.4 |
10.8 |
(77.7) |
92.5 |
|
District of Columbia |
7.48–14.57 |
10.5 |
0.3 |
0.5 |
0.4 |
0.4 |
0.4 |
0.4 |
0.4 |
0.4 |
0.8 |
1.0 |
3.4 |
4.2 |
2.1 |
(20.0) |
14.9 |
|
Florida |
78.38–221.26 |
210.9 |
0.4 |
70.6 |
44.8 |
44.9 |
30.6 |
38.3 |
1.8 |
1.7 |
2.0 |
6.7 |
58.9 |
60.8 |
67.7 |
(32.1) |
428.9 |
|
Georgia |
42.59–114.34 |
116.5 |
0.5 |
1.8 |
1.6 |
17.4 |
22.3 |
20.7 |
14.2 |
12.9 |
3.8 |
3.5 |
3.4 |
3.5 |
3.2 |
(2.7) |
108.9 |
|
Hawaii |
10.78–23.45 |
15.2 |
0.4 |
0.8 |
4.5 |
10.5 |
1.9 |
11.2 |
9.7 |
9.7 |
6.8 |
10.4 |
11.4 |
11.5 |
8.8 |
(57.9) |
97.6 |
|
Idaho |
11.04–24.09 |
16.9 |
0.3 |
0.8 |
1.1 |
2.3 |
2.1 |
2.4 |
2.7 |
2.9 |
2.0 |
2.3 |
2.7 |
2.9 |
2.3 |
(13.6) |
26.8 |
|
Illinois |
64.91–179.05 |
157.0 |
0.7 |
1.6 |
1.7 |
30.2 |
48.4 |
13.7 |
13.7 |
12.7 |
12.4 |
9.8 |
9.8 |
9.9 |
9.7 |
(6.2) |
174.1 |
|
Indiana |
34.78–95.80 |
78.8 |
1.2 |
0.9 |
1.4 |
36.4 |
33.9 |
34.0 |
12.2 |
12.6 |
12.2 |
12.0 |
17.3 |
16.2 |
11.8 |
(15.0) |
202.2 |
|
Iowa |
19.35–48.71 |
36.7 |
0.3 |
0.8 |
0.9 |
10.3 |
10.4 |
6.1 |
6.0 |
5.9 |
6.7 |
7.6 |
13.4 |
11.5 |
11.1 |
(30.2) |
91.2 |
|
Kansas |
18.05–44.69 |
32.1 |
0.4 |
0.9 |
1.2 |
1.7 |
1.7 |
1.7 |
1.7 |
1.9 |
3.6 |
3.6 |
2.8 |
2.4 |
2.2 |
(6.9) |
25.8 |
|
Kentucky |
25.09–69.90 |
57.2 |
0.5 |
1.1 |
1.1 |
6.1 |
6.6 |
4.1 |
3.8 |
3.7 |
4.0 |
4.0 |
3.7 |
4.0 |
3.9 |
(6.8) |
46.7 |
|
Louisiana |
27.13–71.43 |
53.5 |
0.3 |
1.2 |
5.1 |
1.6 |
1.6 |
9.1 |
11.8 |
12.3 |
9.3 |
9.2 |
9.6 |
8.8 |
8.9 |
(16.6) |
89.0 |
|
Maine |
11.19–25.35 |
18.5 |
0.9 |
0.6 |
4.4 |
19.7 |
14.7 |
16.2 |
15.4 |
15.0 |
15.3 |
15.8 |
18.0 |
11.9 |
11.8 |
(63.8) |
159.5 |
|
Maryland |
30.30–78.60 |
63.3 |
0.4 |
1.1 |
1.4 |
31.4 |
22.4 |
31.4 |
16.6 |
10.7 |
10.7 |
20.1 |
19.9 |
20.9 |
6.7 |
(10.6) |
193.8 |
|
Massachusetts |
35.24–92.76 |
90.0 |
39.3 |
57.3 |
53.6 |
44.7 |
49.6 |
6.4 |
4.1 |
5.2 |
6.1 |
10.0 |
14.6 |
14.0 |
6.1 |
(6.8) |
310.9 |
|
Michigan |
54.80–154.56 |
121.2 |
1.6 |
1.2 |
1.7 |
1.7 |
1.7 |
1.8 |
6.6 |
6.7 |
5.8 |
5.5 |
5.4 |
5.5 |
4.5 |
(3.7) |
49.7 |
|
Minnesota |
28.62–74.01 |
58.4 |
3.6 |
0.8 |
16.2 |
35.4 |
30.1 |
33.7 |
21.6 |
19.8 |
23.5 |
23.0 |
23.4 |
21.8 |
21.5 |
(36.8) |
274.2 |
|
Mississippi |
18.79–46.80 |
39.2 |
0.3 |
19.7 |
31.4 |
20.4 |
20.5 |
20.4 |
20.4 |
20.3 |
20.6 |
0.7 |
8.6 |
11.1 |
11.7 |
(29.8) |
206.1 |
|
Missouri |
32.77–91.36 |
73.2 |
1.1 |
0.8 |
1.2 |
1.2 |
19.9 |
1.2 |
1.2 |
1.4 |
1.9 |
1.3 |
1.5 |
3.0 |
2.4 |
(3.3) |
37.9 |
|
Montana |
9.36–19.68 |
13.9 |
0.4 |
0.7 |
4.4 |
4.4 |
1.4 |
1.3 |
4.1 |
3.3 |
7.9 |
8.0 |
9.6 |
9.5 |
9.4 |
(67.6) |
64.3 |
|
Nebraska |
13.31–31.04 |
21.5 |
0.4 |
1.0 |
8.2 |
8.2 |
8.3 |
8.3 |
1.6 |
4.1 |
4.5 |
4.4 |
3.9 |
4.3 |
4.2 |
(19.5) |
61.4 |
|
Nevada |
13.48–32.99 |
32.5 |
0.3 |
0.8 |
4.6 |
3.8 |
5.0 |
5.0 |
5.0 |
5.1 |
5.4 |
4.8 |
2.9 |
4.5 |
3.8 |
(11.7) |
51.1 |
|
New Hampshire |
10.89–24.77 |
19.2 |
0.4 |
0.8 |
1.0 |
4.0 |
4.0 |
4.0 |
0.9 |
0.9 |
1.2 |
1.2 |
2.4 |
1.3 |
1.0 |
(5.2) |
23.1 |
|
New Jersey |
45.07–121.33 |
119.8 |
0.3 |
0.9 |
19.9 |
31.3 |
31.3 |
31.3 |
11.2 |
12.1 |
12.5 |
12.5 |
12.4 |
10.5 |
8.9 |
(7.4) |
194.9 |
|
New Mexico |
13.71–31.95 |
23.4 |
0.9 |
0.7 |
1.1 |
3.4 |
6.2 |
6.2 |
7.1 |
6.0 |
7.3 |
9.1 |
10.9 |
10.8 |
10.6 |
(45.3) |
80.3 |
|
New York |
95.83–269.30 |
254.3 |
1.9 |
8.8 |
31.3 |
34.5 |
42.0 |
42.0 |
41.8 |
42.3 |
56.0 |
87.6 |
86.3 |
79.5 |
67.5 |
(26.5) |
621.5 |
|
North Carolina |
42.59–118.63 |
106.8 |
1.7 |
1.2 |
1.7 |
1.7 |
6.8 |
8.0 |
7.9 |
27.7 |
23.9 |
19.0 |
18.9 |
18.9 |
20.0 |
(18.7) |
157.4 |
|
North Dakota |
8.16–16.55 |
9.3 |
0.4 |
0.8 |
1.1 |
1.1 |
3.4 |
3.6 |
4.5 |
4.1 |
4.4 |
4.4 |
4.4 |
4.4 |
9.4 |
(101.1) |
45.9 |
|
Ohio |
61.74–173.68 |
145.0 |
0.7 |
1.5 |
1.5 |
61.5 |
23.2 |
35.5 |
39.7 |
54.6 |
48.9 |
46.5 |
46.3 |
9.6 |
7.4 |
(5.1) |
376.9 |
|
Oklahoma |
21.83–56.31 |
45.0 |
0.5 |
1.2 |
1.3 |
3.1 |
2.8 |
6.7 |
7.9 |
6.0 |
10.0 |
11.5 |
15.7 |
19.5 |
21.1 |
(46.9) |
107.3 |
|
Oregon |
21.13–52.84 |
43.0 |
0.4 |
9.4 |
9.5 |
9.5 |
12.3 |
12.2 |
3.9 |
4.4 |
4.7 |
4.7 |
9.4 |
9.4 |
7.7 |
(17.9) |
97.5 |
|
Pennsylvania |
65.57–184.76 |
155.5 |
0.6 |
1.2 |
1.3 |
1.3 |
42.7 |
53.3 |
52.9 |
47.2 |
34.4 |
31.7 |
33.1 |
33.6 |
19.0 |
(12.2) |
352.2 |
|
Rhode Island |
9.89–21.91 |
15.2 |
1.0 |
0.7 |
1.7 |
3.4 |
5.4 |
4.4 |
4.1 |
3.5 |
3.5 |
2.4 |
2.3 |
2.2 |
1.9 |
(12.5) |
36.6 |
|
South Carolina |
23.91–62.01 |
62.2 |
1.0 |
0.7 |
1.2 |
3.0 |
2.8 |
3.2 |
1.2 |
1.1 |
1.3 |
3.3 |
3.3 |
1.4 |
3.2 |
(5.1) |
26.6 |
|
South Dakota |
8.69–18.21 |
11.3 |
0.3 |
0.6 |
0.9 |
2.6 |
3.6 |
1.7 |
1.6 |
2.3 |
1.8 |
1.8 |
6.1 |
6.0 |
6.0 |
(53.1) |
35.2 |
|
Tennessee |
32.23–89.08 |
71.7 |
0.4 |
1.2 |
1.4 |
1.4 |
1.4 |
1.4 |
1.3 |
1.4 |
1.7 |
1.7 |
11.4 |
6.4 |
1.5 |
(2.1) |
32.7 |
|
Texas |
103.29–284.74 |
266.3 |
0.6 |
0.7 |
8.5 |
10.8 |
13.1 |
13.5 |
9.3 |
9.5 |
10.1 |
8.6 |
12.1 |
13.2 |
13.3 |
(5.0) |
123.2 |
|
Utah |
15.23–33.38 |
23.6 |
0.3 |
0.9 |
1.2 |
5.2 |
7.2 |
8.3 |
8.2 |
8.3 |
8.6 |
8.6 |
8.6 |
8.5 |
8.3 |
(35.2) |
82.1 |
|
Vermont |
7.91–15.94 |
10.4 |
0.4 |
0.9 |
1.2 |
7.8 |
7.0 |
6.3 |
5.6 |
5.7 |
6.2 |
6.4 |
6.5 |
6.4 |
5.9 |
(56.7) |
66.3 |
|
Virginia |
38.87–106.85 |
103.2 |
0.9 |
0.8 |
14.2 |
18.1 |
20.4 |
23.3 |
18.5 |
13.6 |
13.9 |
14.7 |
15.7 |
13.9 |
13.4 |
(13.0) |
181.5 |
|
Washington |
33.34–89.38 |
67.3 |
1.3 |
0.9 |
3.8 |
16.9 |
18.9 |
27.7 |
27.6 |
28.4 |
28.8 |
28.8 |
28.7 |
28.8 |
17.2 |
(25.6) |
258.0 |
|
West Virginia |
14.16–35.37 |
27.8 |
0.8 |
0.6 |
1.1 |
7.0 |
6.8 |
7.0 |
7.0 |
6.9 |
7.1 |
6.7 |
7.0 |
7.0 |
6.9 |
(24.8) |
71.8 |
|
Wisconsin |
31.16–82.38 |
64.3 |
1.3 |
0.8 |
3.7 |
24.6 |
16.2 |
16.8 |
11.1 |
11.0 |
11.4 |
11.4 |
16.3 |
16.6 |
8.1 |
(12.6) |
149.4 |
|
Wyoming |
7.38–14.40 |
9.0 |
0.3 |
0.7 |
1.0 |
2.8 |
1.9 |
4.0 |
4.0 |
4.7 |
7.1 |
7.0 |
7.0 |
7.1 |
5.8 |
(64.4) |
53.3 |
|
Total |
1,600.04–4,241.50 |
3,696.6 |
262.3 |
345.4 |
436.6 |
782.3 |
820.9 |
736.7 |
610.8 |
625.5 |
638.1 |
670.5 |
778.9 |
735.3 |
641.1 |
(17.3) |
8,084.2 |
|
* Adjusted to fiscal year ending June 30. † Includes the District of Columbia. § Available at http://www.cdc.gov/tobacco/stateandcommunity/best_practices/index.htm. ¶ Does not include time-limited funding (e.g., Communities Putting Prevention to Work). |
|||||||||||||||||
Use of trade names and commercial sources is for identification only and does not imply endorsement by the U.S. Department of
Health and Human Services.
References to non-CDC sites on the Internet are
provided as a service to MMWR readers and do not constitute or imply
endorsement of these organizations or their programs by CDC or the U.S.
Department of Health and Human Services. CDC is not responsible for the content
of pages found at these sites. URL addresses listed in MMWR were current as of
the date of publication.
All MMWR HTML versions of articles are electronic conversions from typeset documents.
This conversion might result in character translation or format errors in the HTML version.
Users are referred to the electronic PDF version (http://www.cdc.gov/mmwr)
and/or the original MMWR paper copy for printable versions of official text, figures, and tables.
An original paper copy of this issue can be obtained from the Superintendent of Documents, U.S.
Government Printing Office (GPO), Washington, DC 20402-9371;
telephone: (202) 512-1800. Contact GPO for current prices.
**Questions or messages regarding errors in formatting should be addressed to
mmwrq@cdc.gov.
