Key points
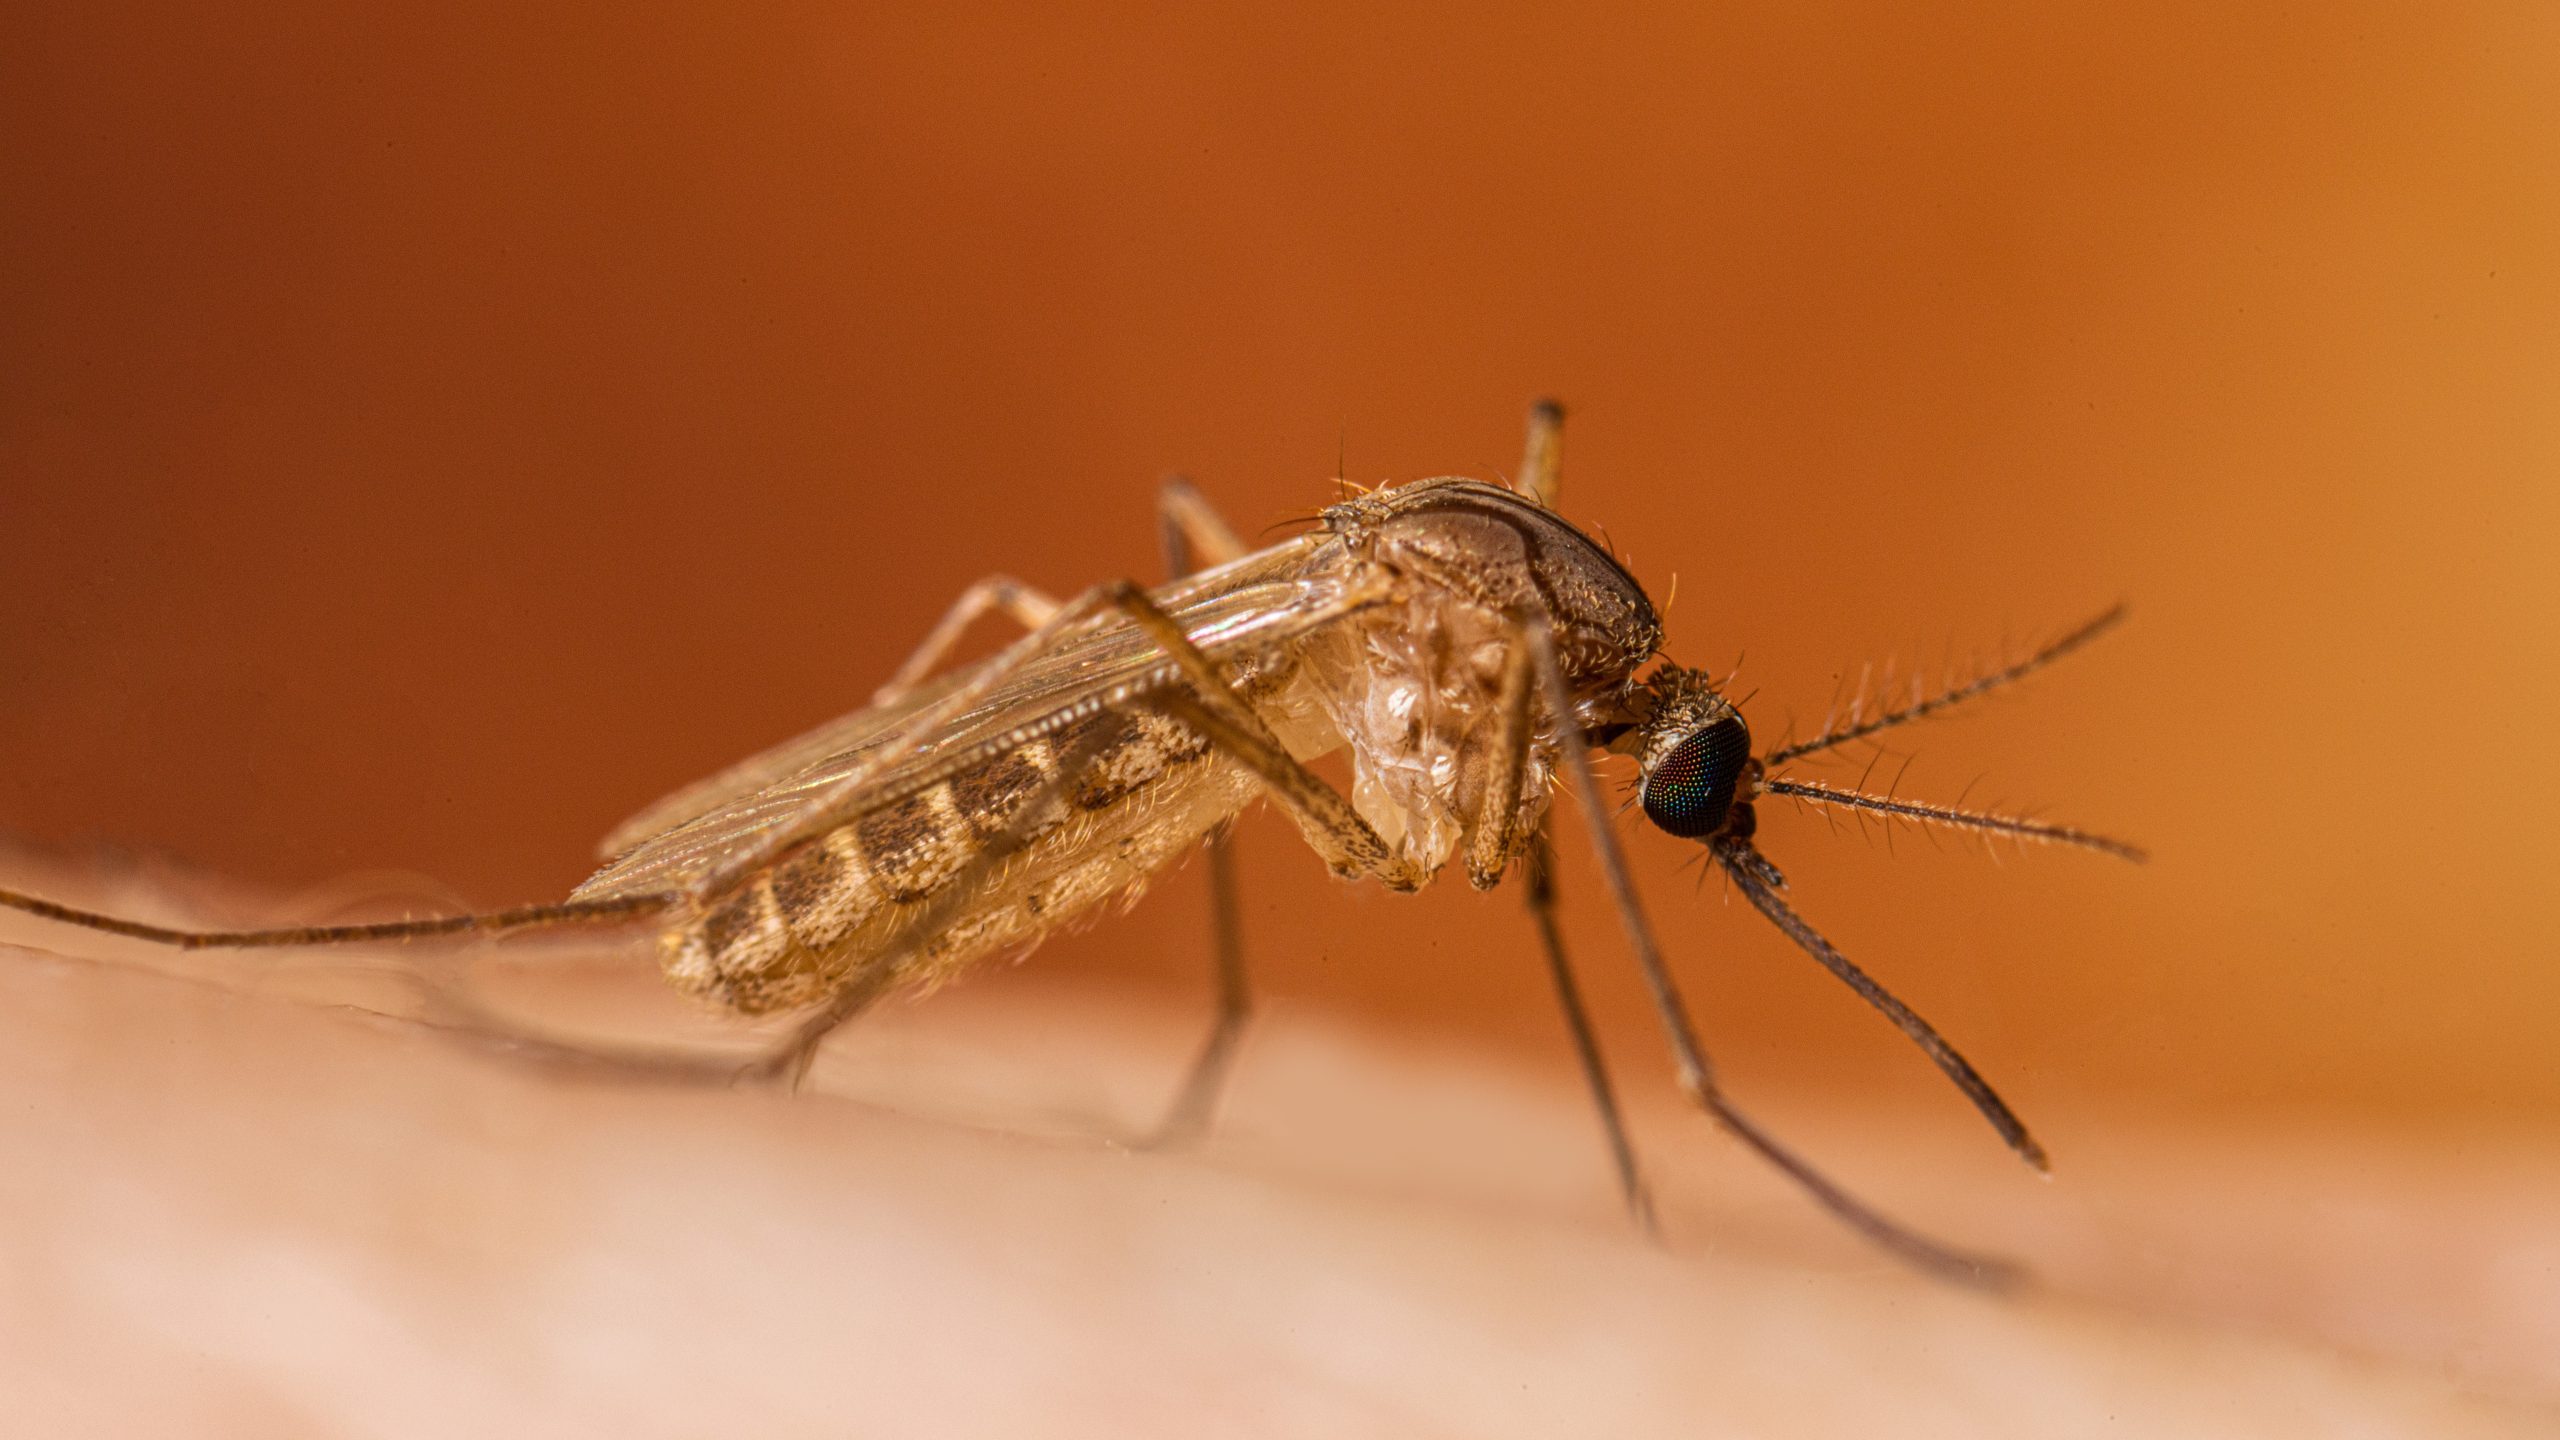
- West Nile virus is most commonly spread through the bite of an infected mosquito.
- Symptoms include fever, headache, body aches, vomiting, diarrhea, or rash. Severe illness can affect the central nervous symptom and result in hospitalization or death.
- No licensed vaccines or medicines are available to prevent or treat West Nile virus disease (West Nile) in people.
Overview
West Nile virus is most commonly spread to people through the bite of an infected mosquito. People get infected with the virus during mosquito season, which starts in the summer and continues through fall (typically June through October). The number of people diagnosed with West Nile typically peaks in late August to early September.
Each year, about 2,000 people in the United States are diagnosed with West Nile, but this number is an underestimate as most people do not develop symptoms or attribute mild symptoms to other causes.
Symptoms
Most people infected with West Nile virus do not develop any symptoms. Symptoms usually start 2–6 days after being bitten by an infected mosquito. It may take longer for symptoms to start, especially for people with a weakened immune system.
Mild illness
Some people develop mild illness with flu-like symptoms, such as fever with headache or body aches, joint pain, vomiting, diarrhea, or rash. Most people with mild illness recover completely, but fatigue and weakness can last for weeks or months.
Severe illness
Some people develop severe illness, which can affect the central nervous system or illness that results in hospitalization or death. Symptoms can include high fever, headache, neck stiffness, stupor, disorientation, muscle weakness, and more. Recovery from severe illness can take several weeks or months. Some effects may be permanent.
Risk factors
Risk of infection
Anyone who lives in or travels to an area where West Nile virus circulates is at risk of infection. All states in the contiguous United States have reported cases of West Nile.
Risk of severe illness
Anyone can develop mild or severe illness if infected with West Nile virus. Some people are at higher risk of severe illness. Risk increases with age, certain chronic medical conditions, and a weakened immune system.
How it spreads
West Nile virus most commonly spreads to people through the bite of an infected mosquito. Mosquitoes become infected when they feed on infected birds.
West Nile virus can also spread through blood transfusion and organ transplantation. Rarely, the virus has also spread through exposure in a laboratory setting and from mother to baby during pregnancy, delivery, or breastfeeding.
Prevention
The best way to protect yourself and your loved ones from West Nile virus is to prevent mosquito bites. No licensed vaccines or medicines are available to prevent West Nile.
Testing and diagnosis
Talk to a healthcare provider if you think you or a loved one might have West Nile. Healthcare providers diagnose illness based on several factors.
Treatment
No medicines are available to treat West Nile. Antibiotics do not treat viral infections.
Mild illness
People with mild illness can often manage symptoms by:
- Taking over-the-counter medication like acetaminophen for fever, pain, and headaches. Avoid ibuprofen or other non-steroidal anti-inflammatory drugs (NSAIDs) if you live in an area with dengue, which is also spread by mosquitoes.
- Staying hydrated
- Resting
Severe illness
People with severe illness often need to be hospitalized to receive supportive treatment, such as intravenous fluids, pain medication, and nursing care.
Immunity
Most people infected with West Nile virus are believed to have lifelong immunity or protection from getting the disease again. Some people with a weakened immune system from certain conditions or medications may not have a strong immune response to the initial infection or their immunity may wane over time.
Personal stories
A Georgia man talks about his journey from diagnosis to living with long-term complications of severe West Nile virus illness and the importance of preventing mosquito bites.
Find accessibility information for the video.