Persons using assistive technology might not be able to fully access information in this file. For assistance, please send e-mail to: mmwrq@cdc.gov. Type 508 Accommodation and the title of the report in the subject line of e-mail.
Obesity — United States, 1999–2010
Corresponding author: Ashleigh L. May, Division of Nutrition, Physical Activity, and Obesity, National Center for Chronic Disease Prevention and Health Promotion, CDC. Telephone: 770-488-8062. E-mail: amay@cdc.gov.
Introduction
Obesity is a major public health problem affecting adults and children in the United States. Since 1960, the prevalence of adult obesity in the United States has nearly tripled, from 13% in 1960–1962 to 36% during 2009–2010 (1,2). Since 1970, the prevalence of obesity has more than tripled among children, from 5% in 1971–1974 (3) to 17% in 2009–2010 (4,5). Although the prevalence of obesity is high among all U.S. population groups, substantial disparities exist among racial/ethnic minorities and vary on the basis of age, sex, and socioeconomic status.
This report is part of the second CDC Health Disparities and Inequalities Report (CHDIR). The 2011 CHDIR (6) was the first CDC report to assess disparities across a wide range of diseases, behavior risk factors, environmental exposures, social determinants, and health-care access. The topic presented in this report is based on criteria that are described in the 2013 CHDIR Introduction (7). This report provides more current information regarding what was presented in the 2011 CHDIR (8). The purposes of this report are to discuss and raise awareness of differences in the characteristics of persons who are obese and to prompt actions to reduce these disparities.
Methods
To assess disparities and trends over time in obesity prevalence among adults aged ≥18 years and children and adolescents aged 2–17 years, CDC analyzed data from the National Health and Nutrition Examination Survey (NHANES) between 1999 and 2008 that were included in the 2011 CDC Health Disparities and Inequities Report (CHDIR) (8) and data from NHANES for 2009–2010. To assess disparities and trends over time in obesity prevalence among adults aged ≥18 years and children and adolescents aged 2–17 years, CDC analyzed data from the National Health and Nutrition Examination Survey (NHANES) between 1999 and 2008 that were included in the 2011 CDC Health Disparities and Inequities Report (CHDIR) (8) and data from NHANES for 2009–2010. CDC examined obesity prevalence by sex, age, and race/ethnicity and by the following variables that were not included in the previous report: educational attainment, disability status, country of birth, and language spoken at home. Geographic location was not examined because this information was not available in the publicly available datasets, and educational attainment was analyzed rather than family income because a smaller number of participants had missing data for educational attainment than for income. In addition, for many persons, income was categorized into very broad ranges (e.g., <$20,000 and ≥$20,000). The highest income category was ≥$75,000.
NHANES is a complex, multistage probability sample of the noninstitutionalized population of the United States. Information regarding the survey's methodology has been published previously (9). Data for NHANES 2-year samples were collected from 1999–2000 through 2009–2010 (10) using a stratified, multistage cluster design. The sample was representative of the U.S. civilian, noninstitutionalized population. Weight and height were measured using standardized techniques and equipment, and body mass index (BMI) (weight [kg]/height [m]2) was calculated (11). Persons aged ≥20 years were classified as obese if they had a BMI ≥30 kg/m2 (12). Persons aged 2–17 years were considered obese if they had a BMI ≥95th (sex- and age-specific) percentile of the 2000 CDC growth charts (13). Persons aged 18–19 years were classified as obese if they had a BMI ≥30 kg/m2 or ≥95th percentile of the CDC growth charts. This age classification differs from that used in other studies of obesity using NHANES data (2,5), which grouped persons aged 18–19 years with children and adolescents. Information on race/ethnicity was self-reported for persons aged ≥16 years. For persons aged <16 years, race/ethnicity was reported by a family member. Respondents reported race/ethnicity from a list provided to them that included an open-ended response. Analyses that focused on race/ethnicity were restricted to non-Hispanic whites, non-Hispanic blacks, and Mexican-Americans because of insufficient numbers of persons in other racial/ethnic groups. However, all race/ethnicity groups were included in analyses of other characteristics (e.g., educational attainment). Non-Hispanic blacks and Mexican-Americans were oversampled to improve the precision of estimates for these race/ethnicity groups (14).
During each household interview, adult respondents were asked to report the highest level of school completed or the highest degree that they had received. For children and adolescents, this information was collected for the adult head of household. This information was summarized into four categories of education attainment: less than high school, high school graduate or equivalent, some college, and college degree or higher. Because adults aged 18–22 years were unlikely to have completed college, analyses of educational attainment among adults were restricted to subjects who were aged ≥23 years. For approximately 2% of the sample, information on education attainment was missing, and these persons were excluded from the analyses that focused on this characteristic.
Disability status was determined by self-reports among persons aged ≥60 years and was based on responses to 11 questions concerning problems in memory (confusion) and hearing, along with ambulatory difficulties (e.g., difficulties in walking, going up steps, and standing) and self-care difficulties (e.g., dressing, eating, and getting out of bed). A response of "some difficulty" or "much difficulty" was considered to indicate that the activity was difficult. The number of positive responses was then summed, and this variable was categorized into three groups: no difficulties or problems (reported by 50% of adults aged ≥60 years), difficulties in one to three activities (33%), and difficulties in four or more activities (17%). Although this type of classification is based on various assumptions, it allows for the assessment of whether a dose-response relationship is evident. Standard disability classifications also include vision problems (15), but these data were not available for NHANES 2009–2010.
Information also was collected on country of birth and, on the basis of a question in the acculturation data file, the language usually spoken at home. Because few non-Hispanic white or non-Hispanic black subjects were born outside the United States or spoke a language other than English at home, analyses of country of birth and language spoken at home were restricted to Mexican-Americans. Of the Mexican-American adults for whom information was collected, 57% reported that they were born in Mexico, and 56% reported that they usually spoke Spanish at home.
Trends in obesity prevalence over the 2-year study cycles were examined, with year coded as a six-level interval variable. To decrease the variability of the estimates of the prevalence of obesity within categories of the examined characteristics, this report presents estimates for three 4-year periods: 1999–2002, 2003–2006, and 2007–2010. Within these three 4-year periods, the number of children aged 2–17 years ranged from 6,081 to 7,293, and the number of adults ranged from 9,630 to 12,067. All estimates of the prevalence of obesity among adults have been age adjusted to the 2000 Standard U.S. Population. The estimated prevalence is considered to be unstable if the relative SE (SE ÷ prevalence) is ≥30%. Estimates that have a relative SE ≥40% are not presented.
The overall (12-year) prevalence of obesity was examined across categories of the various characteristics (race/ethnicity, educational attainment, number of disabilities, country of birth, and language spoken at home). Separate analyses were performed by age and sex (i.e., for men, women, boys, and girls). Differences in obesity prevalence across these characteristics were examined, using an interaction term in logistic regression models. Educational attainment (four levels), number of disabilities (three levels), and 2-year study cycle (six levels) were coded as ordinal variables in these models. All analyses accounted for the examination sampling weights and for the complex sampling design. All estimate comparisons represent absolute differences. Statistical significance (p<0.05) was assessed in logistic regression models, with various models including age and study period as covariates. All analyses were performed with the survey package in R (16,17).
Results
Between 1999–2002 and 2007–2010, the age-adjusted prevalence of obesity among adults aged ≥18 years increased from 26.5% to 33.0% among men and from 32.4% to 34.9% among women (Table 1). Controlling for age and race/ethnicity in regression models indicated that the increase in the prevalence of obesity over the study period was statistically significant among men but not among women.
The prevalence of obesity differed substantially across categories of various demographic characteristics (Table 1). Among men, there was little difference in the prevalence of obesity by race/ethnicity, but among women, the overall (1999–2010) prevalence among non-Hispanic blacks (51%) was 10 percentage points higher than that among Mexican-Americans and 20 percentage points higher than that among non-Hispanic white women.
Inverse associations were identified between the prevalence of obesity and educational attainment that were statistically significant among both men and women; differences were much greater among women (Table 1). These associations appeared to be nonlinear. For example, among men, the prevalence was lowest (25%) among college graduates but highest (35%) among those who had completed some college. Among women, the overall prevalence of obesity among those who had completed college was 13–16 percentage points lower than in other groups, but there was little difference in obesity prevalence between those who had not finished high school and those who had completed some college. The analysis of disability status of adults aged ≥60 years indicated that the overall prevalence of obesity among those who reported having difficulties with four or more activities was substantially higher than obesity prevalence among those without a disability (men: 16 percentage points higher; women: 27 percentage points higher).
In contrast to these differences, which were larger among women, the association of obesity with country of birth and language spoken at home was stronger among men (Table 1). Mexican-American men who were born in the United States had 13 percentage points higher overall prevalence of obesity than men born in Mexico (39% versus. 26%), but the equivalent difference among Mexican-American women was only 3 percentage points. Similarly, Mexican-American men who spoke mostly English at home had a 12 percentage points higher overall prevalence of obesity compared with those who spoke mostly Spanish at home (38% versus 26%), while there was no significant difference among Mexican-American women. As assessed by an interaction term (each characteristic x study period) in sex-specific regression models, there was no indication that disparities in obesity prevalence varied across the 12-year study period among either men or women.
Between 1999–2002 and 2007–2010, the prevalence of obesity among children and adolescents aged 2–17 years increased from 15.4% to 18.6% among boys and from 13.8% to 15.1% among girls (Table 2). After adjustment for age and race/ethnicity in regression models, the increase over the six 2-year study cycles was statistically significant among boys but not among girls.
Differences in the prevalence of obesity among children and adolescents over the 12-year study period across categories of the various characteristics were somewhat similar to those among adults (Tables 1 and 2). Substantial differences existed in the prevalence of obesity by race/ethnicity; among boys, prevalence was highest among Mexican-Americans (24%), whereas among girls, prevalence was highest among non-Hispanic blacks (22%). Educational attainment of the adult head of household was associated inversely with obesity among both boys and girls. Overall, the prevalence of obesity among children and adolescents whose adult head of household had completed college was approximately half that of prevalence among children whose adult head of household did not complete high school. In contrast to the differences among adults, the prevalence of obesity among Mexican-American children did not differ significantly according to either country of birth or language spoken at home.
As assessed by an interaction term (each characteristic x study period, which was coded as 1–6) in sex-specific regression models, there was little indication that differences in the prevalence of obesity across most of the characteristics analyzed varied over the 12-year study period among children (Table 2). However, the prevalence of obesity among girls whose adult head of household had not finished high school increased (17% for 1999–2002 versus 23% for 2007–2010) while the prevalence decreased among girls whose adult head of household had completed college (11% for 1999–2002 versus 7% for 2007–2010). There was not a comparable interaction among boys. Because education attainment differs substantially across race/ethnicity groups, the associations between education attainment and obesity prevalence were examined.
The relation of educational attainment to obesity varied significantly by sex and race/ethnicity among both adults (Figure 1) and children (Figure 2). Among non-Hispanic white women (Figure 1), in each 4-year period, the prevalence of obesity was approximately 15% lower among those who had completed college than it was among those who had not completed high school. Although the prevalence of obesity among non-Hispanic white men and non-Hispanic black women was also lowest among those who had completed college, the trend over the four educational attainment categories was not consistent in these two groups. Furthermore, there was no evidence that educational attainment was associated with obesity among non-Hispanic black men or among Mexican-Americans. For example, Mexican-American men who did not complete high school had the lowest prevalence of obesity in 1999–2002 and in 2003–2006.
Associations between obesity and adult head of household education attainment among children and adolescents were also less consistent after stratifying for race/ethnicity (Figure 2). (The prevalence of obesity among Mexican-American children and adolescents is not shown because many of the estimates were unstable). Although the lowest prevalence of obesity among non-Hispanic white children and adolescents was observed among those whose adult head of household had completed college, this was not the case among non-Hispanic black children. Furthermore, there was no evidence of any association between obesity and adult head of household educational attainment among non-Hispanic black boys, and the trend in the prevalence of obesity across the lower three categories of adult head of household educational attainment was not consistent in any of the sex-race groups. The observed interaction between study period and educational attainment among girls (Table 2) was largely attributable to the trend among non-Hispanic white girls, and the 2007–2010 prevalence of obesity among non-Hispanic white girls varied from 6% (± 2) to 28% (± 5) across the four groups of educational attainment by the adult head of household more than it did in previous years.
Discussion
Recent trends suggest that although increases in obesity prevalence have slowed or even stopped for some subgroups, the prevalence remains high (2,5). This report highlights the persistence of substantial disparities among certain population groups, all of which further complicate the efforts to understand, control, and prevent obesity. Although the specific causes of these disparities have not been identified, it is likely that they are associated with complex social and cultural factors that affect obesity-related behaviors. One possible contributing factor is that rates of breastfeeding are lower among non-Hispanic black women compared with non-Hispanic white women (18). In addition, greater satisfaction in body size among racial/ethnic minority women (19), preferences for larger body types (20,21), and previous threats of, or experiences with, undernutrition (22) also might promote obesogenic behaviors. Further, racial/ethnic differences in physical activity levels among adults (23) and children (24) and differential preferences for specific types of physical activity (25) also might play a role. These and other behaviors occur within a broader context of obesity-promoting environments that limit opportunities for physical activity, encourage excess television viewing and passive screen time, and provide easy access to high-calorie, low-nutrient foods and beverages, including those high in added sugars and solid fats (26,27).
Limitations
The findings presented in this report are subject to at least two limitations. First, NHANES does not sample an adequate number of persons who are members of racial/ethnic minority communities other than non-Hispanic blacks and Mexican-Americans to permit estimating obesity prevalence in these communities; however, previous research has reported high prevalence levels among American Indians/Alaska Natives (28,29). Second, the data presented, although age adjusted, do not allow for assessment of covarying issues or stratification to further assess independent effects.
Conclusion
The data provided in this report can be used to help identify high-priority groups (e.g., those with low levels of educational attainment, Mexican-American boys, and non-Hispanic black girls and women) for intervention. Because high-priority groups frequently are defined by nonmodifiable characteristics (e.g., race/ethnicity and sex), designers of effective interventions should consider which dietary or physical activity behaviors contribute to the differences as well as how those behaviors are influenced by social and cultural factors and by the settings in which persons spend their time. For example, because studies have found that access to healthy foods is more limited in low-income communities and communities of color than in other communities (30), interventions could focus on neighborhood walkability (e.g., sidewalks), Complete Streets (31), and community design in these communities. Further, opportunities to reduce disparities related to nutrition are also present. For example, many low-income household members, who also tend to have low educational attainment, consume higher amounts of sugary drinks and fewer fruits and vegetables than persons in higher income households (32,33). Effective interventions that focus on increasing access to healthy food outlets, initiatives for local businesses to provide healthier foods and beverages such as fruits and vegetables (e.g., Healthy Food Financing Initiative [34]), and education combined with vouchers for low-income families (e.g., the Special Supplemental Nutrition Program for Women, Infants, and Children [WIC; 35] participants) that can use to purchase healthy foods might help reduce this disparity.
Having a sustainable impact on reducing disparities associated with obesity includes making healthy choices easily assessable and available to all persons. Environmental strategies that support healthy eating and active living opportunities within communities can help provide healthy choices for persons. In addition, such changes can help provide ongoing training and support of public health practitioners with tools to implement effective responses to obesity in populations that are facing health disparities (36,37). CDC provides funding and support to multiple public health programs to improve access to healthy foods and beverages in underserved communities (38,39), including increased access to markets and convenience stores that offer healthier food and beverage choices; expanding programs that promote food affordability such as WIC farmers' markets; assisting persons through green carts and mobile vans in inner-city neighborhoods (Farm-to-Where-You-Are) (40,41); and promotion of food policy councils that include diverse stakeholders that often consider both food security and improvements of the food environment at the state and local levels.
Certain early child care education initiatives promote active play and healthier beverage and food offerings such as drinking water and fruits and vegetables. These initiatives can address disparities by providing age-appropriate health curricula, parental outreach, increased healthier foods and beverages served, and training and technical support for staff on menu planning and food preparation (42) for children of low socioeconomic status and children who hold immigrant and/or refugee status, among other high-priority groups (Adrienne Dorf, Child Care Health Program Public Health Seattle and King County, personal communication, 2012). Strategies such as promoting physical activity early in child care and school, increasing low- or no-cost physical activity opportunities, building and enhancing trails and parks, developing shared-use agreements with public venues such as schools, improving sidewalks, and other initiatives that promote physical activity to prevent and reduce obesity have been implemented to help all persons and communities to become physically active (43).
Although the rate of obesity has plateaued in recent years for some groups, the overall prevalence of the condition remains high for all U.S. residents, and disparities persist in the prevalence of obesity. Continued monitoring of obesity prevalence and further research are needed to identify and understand the factors that influence individual behaviors, especially among high-priority groups, and to augment current population-based approaches with interventions that are tailored to their needs.
References
- Flegal KM, Carroll MD, Kuczmarski RJ, Johnson CL. Overweight and obesity in the United States: prevalence and trends, 1960–1994. Int J Obes Relat Metab Disord 1998;22:39–49.
- Flegal KM, Carroll MD, Kit BK, Ogden CL. Prevalence of obesity and trends in the distribution of body mass index among US adults, 1999-2010. JAMA 2012;307:491–7.
- Ogden C, Carroll M. Prevalence of obesity among children and adolescents: United States, trends 1963–1965 through 2007–2008. Atlanta, GA: US Department of Health and Human Services, CDC, National Center for Health Statistics; 2010.
- Ogden CL, Carroll MD, Curtin LR, Lamb MM, Flegal KM. Prevalence of high body mass index in US children and adolescents, 2007–2008. JAMA 2010;303:242–9.
- Ogden CL, Carroll MD, Kit BK, Flegal KM. Prevalence of obesity and trends in body mass index among US children and adolescents, 1999–2010. JAMA 2012;307:483–90.
- CDC. CDC health disparities and inequalities report—United States, 2011. MMWR 2011;60(Suppl; January 14, 2011).
- CDC. Introduction. In: CDC health disparities and inequalities report—United States, 2013. MMWR 2013;62(Suppl 3).
- CDC. Obesity—United States, 1988–2008. In: CDC health disparities and inequalities report—United States, 2011. MMWR 2011;60(Suppl; January 14, 2011).
- CDC. National Health and Nutrition Examination survey data. Hyattsville, MD: US Department of Health and Human Services, CDC; 2010. Available at http://www.cdc.gov/nchs/nhanes.htm.
- CDC. National Health and Nutrition Examination Survey: questionnaires, datasets, and related documentation. Hyattsville, MD: US Department of Health and Human Services, CDC, National Center for Health Statistics; 2012. Available at http://www.cdc.gov/nchs/nhanes/nhanes_questionnaires.htm.
- CDC. National Health and Nutrition Examination Survey: anthropometry procedures manual. Hyattsville, MD: US Department of Health and Human Services, CDC, National Center for Health Statistics; 2009.
- Expert Panel on the Identification, Evaluation, and Treatment of Overweight in Adults. Clinical guidelines on the identification, evaluation, and treatment of overweight and obesity in adults: executive summary. Am J Clin Nutr 1998;68:899–917.
- Kuczmarski RJ, Ogden CL, Guo SS, et al. 2000 CDC growth charts for the United States: methods and development. Vital Health Stat 11 2002;(246).
- CDC. Analytic note regarding 2007–2010 survey design changes and combining data across other survey cycles. Available at http://www.cdc.gov/nchs/data/nhanes/analyticnote_2007–2010.pdf.
- US Department of Health and Human Services. Implementation guidance on data collection standards for race, ethnicity, sex, primary language, and disability status. Available at http://aspe.hhs.gov/datacncl/standards/ACA/4302/index.shtml.
- Lumley T. Complex surveys: a guide to analysis using R. Hoboken, NJ: Wiley; 2010.
- R Development Core Team. R: a language and environment for statistical computing (version 2.15.0). Vienna, Austria: R Foundation for Statistical Computing; 2012. Available at http://www.r-project.org.
- CDC. Racial and ethnic differences in breastfeeding initiation and duration, by state—National Immunization Survey, United States, 2004–2008. MMWR 2010;59:327–34.
- Millstein RA, Carlson SA, Fulton JE, et al. Relationships between body size satisfaction and weight control practices among US adults. Medscape J Med 2008;10:119.
- Kumanyika SK. Environmental influences on childhood obesity: ethnic and cultural influences in context. Physiol Behav 2008;94:61–70.
- Sherry B, Scanlon K, Barden E, Kallio J. Do race and ethnicity influence parents' feeding strategies, perceptions of and concerns about child weight and intervention techniques? In: Birch L, Dietz W, eds. Eating behaviors of the young child: prenatal and postnatal influences on healthy eating. Elk Grove Village, IL: American Academy of Pediatrics; 2008:157–79.
- Mintz S. Tasting food, tasting freedom: excursions into eating, power, and the past. Boston, MA: Beacon Press; 1997.
- CDC. Adult participation in aerobic and muscle-strengthening physical activities—United States, 2011. MMWR 2013;62:326–330.
- Whitt-Glover MC, Taylor WC, Floyd MF, Yore MM, Yancey AK, Matthews CE. Disparities in physical activity and sedentary behaviors among US children and adolescents: prevalence, correlates and intervention implications. J Public Health Policy 2009;30(Suppl):309–34.
- Saint Onge JM, Krueger PM. Education and racial-ethnic differences in types of exercise in the United States. J Health Soc Behavior, 2011;52:197–211.
- French SA, Story M, Jeffery RW. Environmental influences on eating and physical activity. Annu Rev Public Health 2001;22:309–35.
- Candib LM. Obesity and diabetes in vulnerable populations: reflection on proximal and distal causes. Ann Fam Med 2007;5:547–56.
- Anderson SE, Whitaker RC. Prevalence of obesity among US preschool children in different racial and ethnic groups. Arch Pediatr Adolesc Med 2009;163:344–8.
- Redwood DG, Lanier AP, Johnston JM, Asay ED, Slattery ML. Chronic disease risk factors among Alaska Native and American Indian people, Alaska, 2004–2006. Prev Chronic Dis 2010;7:A85. Available at http://www.cdc.gov/pcd/issues/2011/nov/10_0268.htm.
- PolicyLink and The Food Trust. The grocery gap: who has access to health food and why it matters. Philadelphia, PA: The Food Trust; 2010. Available at http://thefoodtrust.org/uploads/media_items/grocerygap.original.pdf.
- National Complete Streets Coalition. Benefits of Complete Streets: complete streets promote good health 2010. Available at http://www.smartgrowthamerica.org/documents/cs/factsheets/cs-health.pdf.
- Dubowitz T, Heron M, Bird CE, et al. Neighborhood socioeconomic status and fruit and vegetable intake among whites, blacks, and Mexican Americans in the United States. Am J Clin Nutr2008;87:1883–91.
- Han E, Powell LM. Consumption patterns of sugar-sweetened beverages in the United States. J Acad Nutr Diet 2013;113:43–53.
- The Food Trust. Healthy Food Financing Initiative: an innovative approach to improve health and spark economic development. Philadelphia, PA: The Food Trust; 2012. Available at http://thefoodtrust.org/uploads/media_items/hffi-one-pager.original.pdf.
- U.S. Department of Agriculture Food and Nutrition Service. WIC Farmers' Market Nutrition Program. Available at http://www.fns.usda.gov/fmnp.
- Glickman D, Parker L, Sim LJ, Del Valle Cook H, Miller EA, eds. Accelerating progress in obesity prevention: solving the weight of the nation. Washington, D.C.: The National Academies Press; 2012.
- CDC. CDC health equity resource toolkit for state practitioners: addressing obesity disparities toolkit. Atlanta, GA: US Department of Health and Human Services, CDC; 2012. Available at http://www.cdc.gov/obesity/stateprograms/resources.html.
- CDC. CDC's state-based nutrition and physical activity program to prevent obesity and other chronic diseases. Atlanta, GA: US Department of Health and Human Services, CDC; 2010. Available at http://www.cdc.gov/obesity/stateprograms/index.html.
- CDC. Recommended community strategies and measurements to prevent obesity in the United States. MMWR 2009;58(No. RR-7).
- CDC. DNPAO state program highlights: farm-to-where-you-are programs. Atlanta, GA: US Department of Health and Human Services, CDC; 2012. Available at http://www.cdc.gov/obesity/downloads/farmtowhereyouare.pdf.
- CDC. Strategies to prevent obesity and other chronic diseases: the CDC guide to strategies to increase the consumption of fruits and vegetables. Atlanta, GA: US Department of Health and Human Services; 2011. Available at http://www.cdc.gov/obesity/downloads/fandv_2011_web_tag508.pdf.
- CDC. Spectrum of opportunities for obesity prevention in the early care and education setting. Atlanta, GA: US Department of Health and Human Services, CDC; 2012. Available at http://www.cdc.gov/obesity/downloads/Spectrum-of-Opportunities-for-Obesity-Prevention-in-Early-Care-and-Education-Setting_TAbriefing.pdf.
- CDC. State program highlights: urban design and transportation policies and practices. Atlanta, GA; US Department of Health and Human Services, CDC; 2011. Available at http://www.cdc.gov/obesity/stateprograms/highlights.html.
FIGURE 1. Prevalence of obesity among adults aged ≥23 years,* by sex, race/ethnicity, and educational attainment — National Health and Nutrition Examination Survey, United States, 1999–2010
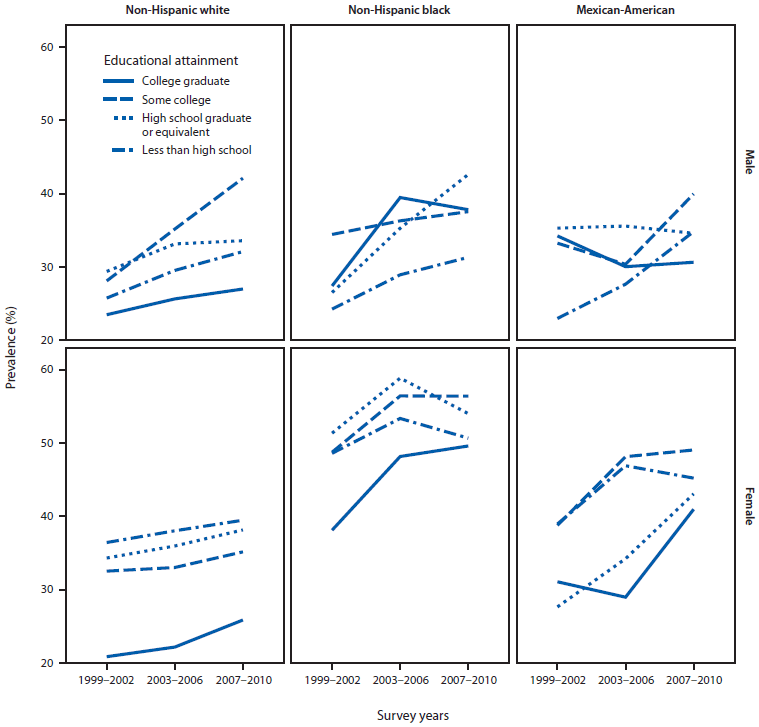
* Adults aged 18–22 years were unlikely to have completed their education and were excluded from this analysis.
Alternate Text: The figure shows the prevalence of obesity among U.S. adults aged ≥23 years, by sex, race/ethnicity, and educational attainment (college graduate, some college, high school graduate or equivalent, and less than high school) for the period 1999-2010.
FIGURE 2. Prevalence of obesity among children and adolescents aged 2–17 years, by sex, race/ethnicity, and educational attainment of adult head of household — National Health and Nutrition Examination Survey, United States 1999–2010*
![The figure shows the prevalence of obesity among U.S. children and adolescents aged 2-17 years, by sex, race/ethnicity, and educational attainment (college graduate, some college, high school graduate or equivalent, and less than high school) of adult heads of household for the period 1999-2010. Prevalences are not shown for Mexican-American children because many of the estimates were unstable (standard error [SE] >30% of the prevalence) with the relative SE reaching a maximum of 49%. An asterisk in the figure indicates that the relative SE is between 30% and 40% of the prevalence; this was seen during 2003-2006 among white non-Hispanic boys and girls from a household in which the adult head did not complete high school.](figures/su6203a20f2.gif)
* Prevalences are not shown for Mexican-American children because many of the estimates were unstable (standard error [SE] >30% of the prevalence) with the relative SE reaching a maximum of 49%. An asterisk in the figure indicates that the relative SE is between 30% and 40% of the prevalence; this was seen during 2003–2006 among white non-Hispanic boys and girls from a household in which the adult head did not complete high school.
Alternate Text: The figure shows the prevalence of obesity among U.S. children and adolescents aged 2-17 years, by sex, race/ethnicity, and educational attainment (college graduate, some college, high school graduate or equivalent, and less than high school) of adult heads of household for the period 1999-2010. Prevalences are not shown for Mexican-American children because many of the estimates were unstable (standard error [SE] >30% of the prevalence) with the relative SE reaching a maximum of 49%. An asterisk in the figure indicates that the relative SE is between 30% and 40% of the prevalence; this was seen during 2003-2006 among white non-Hispanic boys and girls from a household in which the adult head did not complete high school.
Use of trade names and commercial sources is for identification only and does not imply endorsement by the U.S. Department of
Health and Human Services.
References to non-CDC sites on the Internet are
provided as a service to MMWR readers and do not constitute or imply
endorsement of these organizations or their programs by CDC or the U.S.
Department of Health and Human Services. CDC is not responsible for the content
of pages found at these sites. URL addresses listed in MMWR were current as of
the date of publication.
All MMWR HTML versions of articles are electronic conversions from typeset documents.
This conversion might result in character translation or format errors in the HTML version.
Users are referred to the electronic PDF version (http://www.cdc.gov/mmwr)
and/or the original MMWR paper copy for printable versions of official text, figures, and tables.
An original paper copy of this issue can be obtained from the Superintendent of Documents, U.S.
Government Printing Office (GPO), Washington, DC 20402-9371;
telephone: (202) 512-1800. Contact GPO for current prices.
**Questions or messages regarding errors in formatting should be addressed to
mmwrq@cdc.gov.
