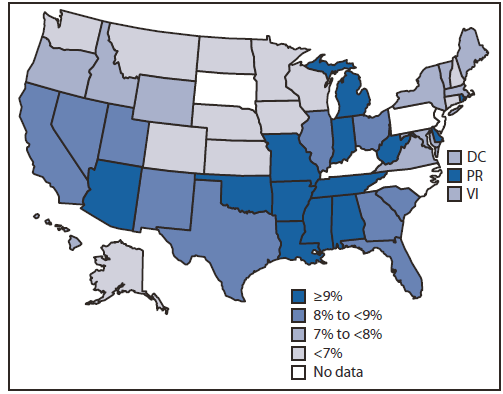
FIGURE 1. Prevalence of current depression* among adults aged ≥18 years, by state quartile† --- Behavioral Risk Factor Surveillance System, United States, 2006§
Persons using assistive technology might not be able to fully access information in this file. For assistance, please send e-mail to: mmwrq@cdc.gov. Type 508 Accommodation and the title of the report in the subject line of e-mail.
Mental Illness Surveillance Among Adults in the United States
Corresponding author: William C. Reeves, MD, Public Health Surveillance Program Office, CDC, 1600 Clifton Rd., N.E., MS E-97, Atlanta, GA 30333. Telephone: 404-498-6521; Fax: 404-498-1177; E-mail: wcr1@cdc.gov.
Summary
Mental illnesses account for a larger proportion of disability in developed countries than any other group of illnesses, including cancer and heart disease. In 2004, an estimated 25% of adults in the United States reported having a mental illness in the previous year. The economic cost of mental illness in the United States is substantial, approximately $300 billion in 2002. Population surveys and surveys of health-care use measure the occurrence of mental illness, associated risk behaviors (e.g., alcohol and drug abuse) and chronic conditions, and use of mental health--related care and clinical services. Population-based surveys and surveillance systems provide much of the evidence needed to guide effective mental health promotion, mental illness prevention, and treatment programs.
This report summarizes data from selected CDC surveillance systems that measure the prevalence and impact of mental illness in the U.S. adult population. CDC surveillance systems provide several types of mental health information: estimates of the prevalence of diagnosed mental illness from self-report or recorded diagnosis, estimates of the prevalence of symptoms associated with mental illness, and estimates of the impact of mental illness on health and well-being. Data from the CDC 2005--2008 National Health and Nutrition Examination Survey indicate that 6.8% of adults had moderate to severe depression in the 2 weeks before completing the survey. State-specific data from the CDC 2006 Behavioral Risk Factor Surveillance System (BRFSS), the most recent BRFSS data available, indicate that the prevalence of moderate to severe depression was generally higher in southeastern states compared with other states. Two other CDC surveys on ambulatory care services, the National Ambulatory Medical Care Survey and the National Hospital Ambulatory Medical Care Survey, indicate that during 2007--2008, approximately 5% of ambulatory care visits involved patients with a diagnosis of a mental health disorder, and most of these were classified as depression, psychoses, or anxiety disorders.
Future surveillance should pay particular attention to changes in the prevalence of depression both nationwide and at the state and county levels. In addition, national and state-level mental illness surveillance should measure a wider range of psychiatric conditions and should include anxiety disorders. Many mental illnesses can be managed successfully, and increasing access to and use of mental health treatment services could substantially reduce the associated morbidity.
Introduction
Mental illness refers collectively to all diagnosable mental disorders and is characterized by sustained, abnormal alterations in thinking, mood, or behavior associated with distress and impaired functioning (1). Mental illness is an important public health problem, both in its own right and because the condition is associated with other chronic diseases and their resulting morbidity and mortality. According to the World Health Organization (WHO), mental illnesses account for more disability in developed countries than any other group of illnesses, including cancer and heart disease (2). Approximately one fourth of adults in the United States have a mental illness, and nearly half will develop at least one mental illness during their lifetime (3--5). The most common mental illnesses in adults are anxiety and mood disorders (4). The effects of mental illness range from minor disruptions in daily functioning to incapacitating personal, social, and occupational impairments and premature death (6--9). In 2002 and 2003, mental illness cost the United States an estimated $300 billion annually, which included approximately $193 billion from lost earnings and wages and $24 billion in disability benefits in 2002 (10) and $100 billion in health-care expenditures in 2003 (11).
Mental illness exacerbates morbidity from the multiple chronic diseases with which it is associated, including cardiovascular disease, diabetes, obesity, asthma, epilepsy, and cancer (12--16). This increased morbidity is a result of lower use of medical care and treatment adherence for concurrent chronic diseases and higher risk for adverse health outcomes (17--20). Rates for injuries, both intentional (e.g., homicide and suicide) and unintentional (e.g., motor vehicle), are 2--6 times higher among persons with a mental illness than in the overall population (21,22). Mental illness also is associated with use of tobacco products and alcohol abuse (23).
This report summarizes data from selected CDC surveillance and information systems that measure mental illness and the associated effects in the U.S. adult population. The data presented include 1) the occurrence and associated effects of mental illness among adults in the United States as measured through selected CDC surveillance and information systems, 2) the CDC systems involved in the collection of mental illness data for adults and the associated public access databases, and 3) estimates from other studies and surveys, particularly those conducted by the Substance Abuse and Mental Health Services Administration (SAMHSA), compared with CDC system estimates.
Background
Role of Surveillance in Reducing Morbidity and Mortality Associated with Mental Illness
Public health surveillance is the ongoing and systematic collection, analysis, interpretation, and dissemination of data used to develop public health interventions that reduce morbidity and mortality and improve health (24). Surveillance for a particular condition might depend either on collection of new data or use of data obtained from existing health information systems (e.g., from vital statistics or public health surveys). Surveillance data have numerous uses in public health: 1) determination of the distribution and spread of disease, 2) estimation of the impact of a disease or injury, 3) generation of hypotheses and stimulation of research, 4) development of public health interventions, 5) description of the history of a health condition and the impact of treatments on outcomes, 6) evaluation of prevention and control measures, and 7) facilitation of program planning (25). Because a single surveillance system typically cannot accomplish all of these tasks, use of multiple surveillance systems often provides a more complete assessment of a particular disease or condition.
Surveillance data are essential to the public health goals of reducing the incidence, prevalence, severity, and economic impact of mental illnesses. Public health officials, academicians, health-care providers, and advocacy groups need accurate and timely information on the prevalence and effects of mental illness to detect and characterize trends in mental illness prevalence and severity (26); assess associations between mental illness and other chronic medical conditions (e.g., obesity, diabetes, heart disease, and alcohol and substance abuse); identify populations at high risk for mental illness and target interventions, treatment, and prevention measures; and provide outcome measures for evaluating mental illness interventions. For example, officials have used metal illness surveillance data to track trends in mental illness and psychological distress associated with exposure to military combat or large-scale disasters (27).
Diagnostic Classification of Mental Illness
Population surveys can be used to estimate accurately the prevalence of certain mental illness symptoms across populations, and by repeating surveys over time, they can be used to detect and characterize trends. Surveys generally cannot be used to diagnose mental disorders with the same level of specificity as an individual clinical examination conducted by an experienced psychiatrist or other mental health professional. Instead, they collect information on a range of subjective manifestations of alterations in thinking, mood, behavior, and associated distress that correspond with clinical disorders. Surveys collect this information using participant questionnaires that have been validated empirically to distinguish between persons with and without specific mental illnesses or general psychological distress. Estimates from these surveys vary according to the symptoms being collected and the way they correspond with various defined mental illnesses. Survey estimates usually are based on carefully defined patterns of symptoms. The most commonly used patterns correspond with diagnostic criteria agreed on by mental health professionals.
The symptom patterns used for surveys vary according to the classification of mental illness under study; changes in these classifications over time have increased the complexity of matching symptom patterns to specific illnesses. New classifications have been identified, and certain classifications have been removed. Even for relatively stable diagnostic categories (e.g., depression), subcategories and terminology have varied over time. For example, terms used to describe depression have included major and minor depression, psychotic depression, depression not otherwise specified, bipolar disorder, dysthymia, moderate to severe depression, and mild depression. However, the relationship among the disorders described by these different terms often is unclear. The American Psychiatric Association (APA) developed mental illness diagnostic categories based on symptoms observed by a health professional or reported by the patient; the Diagnostic and Statistical Manual of Mental Disorders, Fourth Edition, Text Revision (DSM-IV-TR) is the current version of this system (28). Another system, the WHO International Classification of Diseases, 10th Revision, Clinical Modification (ICD-10-CM), defines mental illness categories that are similar but not identical to those in the DSM-IV-TR (29). Previous DSM and ICD versions have not been completely congruent, and APA is developing a fifth edition of the DSM (DSM-V) that will coordinate better with future editions of ICD (30).
Methods for Measuring Prevalence and Public Health Impact of Mental Illness
Research Instruments
The Structured Clinical Interview for DSM Disorders (SCID) Research Version (31) is considered to be the standard among psychiatric research instruments based on DSM-IV-TR criteria; however, SCID takes 30--60 minutes and must be conducted by a trained mental health professional. Another instrument, the Composite International Diagnostic Interview (CIDI), was developed by WHO and is based on ICD-10 mental illness criteria. CIDI also is intended for use in epidemiological, clinical, and research studies. CIDI is lengthy, like SCID, but may be administered by trained lay interviewers (32). SCID and CIDI identify overlapping but not necessarily identical populations because they are based on different classification systems.
Screening Instruments
Large surveys that focus on a wide range of health topics typically can include only a limited number of mental health questions and often rely on SCID- or CIDI-validated screening instruments to provide indicators of psychiatric-related symptoms; in some cases, statistical models are used to predict the likelihood of specific mental illness in the respondent based on rating scales. Several standardized and validated screening instruments can be used to identify persons with mental illnesses such as depression and psychological distress, with varying degrees of diagnostic sensitivity and specificity (33--35). CDC surveys use these screening instruments, as well as other standardized questions, to assess mental illness and other measures, such as impaired quality of life (e.g., mentally unhealthy days) and health-related disability associated with mental illness.
Depression (Patient Health Questionnaire-8 and Patient Health Questionnaire-9)
Depression is a major focus of population surveys of mental illness. To meet the DSM-IV-TR definition of major depressive disorder, a person must have either a depressed mood or a loss of interest or pleasure in daily activities consistently for at least 2 weeks. This mood must represent a change from the person's normal mood; social, occupational, educational, or other important functioning also must be impaired by the change in mood. Under the DSM-IV-TR, a depressed mood that is caused by substances (e.g., drugs, alcohol, or medications) or that is part of a general medical condition is not considered to be major depressive disorder (28).
One of the most widely used and validated instruments for measuring depression in population surveys is the nine-item Patient Health Questionnaire (PHQ-9). The PHQ-9 screens for the presence of the nine DSM-IV-TR criteria for acute and clinically significant depressive disorders (36). A PHQ-9 score of ≥10 has high sensitivity (88%) and specificity (88%) when validated against SCID (37) and effectively detects depressive symptoms among persons of various races and ethnicities (38,39). The PHQ-9 has been used as a self-administered module in many clinical studies and telephone-administered surveys (38,40--43).
Other telephone surveys have used a slightly shorter instrument, the eight-item Patient Health Questionnaire (PHQ-8), which omits the PHQ-9 question concerning suicidal or self-injurious ideation because survey administrators might not be able to offer appropriate follow-up interventions. Omitting this question in population-based surveys has only a minor effect on the usefulness of PHQ as a screen for depression (36).
The standard PHQ-8 and PHQ-9 have the following primary question: "Over the last 2 weeks, how often have you been bothered by any of the following problems?" The following problems are listed: 1) little interest or pleasure in doing things; 2) feeling down, depressed, or hopeless; 3) trouble falling/staying asleep, sleeping too much; 4) feeling tired or having little energy; 5) poor appetite or overeating; 6) feeling bad about yourself or that you are a failure or have let yourself or your family down; 7) trouble concentrating on things, such as reading the newspaper or watching television; 8) moving or speaking so slowly that other people could have noticed, or the opposite --- being so fidgety or restless that you have been moving around a lot more than usual; and 9) (PHQ-9 only) thoughts that you would be better off dead or of hurting yourself in some way. Response categories are "not at all," "several days," "more than half the days," and "nearly every day."
PHQ-8 and PHQ-9 answers are scored using one of two algorithms, and the scores are used to assign depression categories. One algorithm is based on the DSM-IV and categorizes depressed respondents as having a major depressive disorder or other depression. The other algorithm categorizes respondents according to the severity of depressive symptoms (i.e., no significant depressive symptoms or mild, moderate, moderately severe, or severe depressive symptoms) (36,37).
Psychological Distress (Kessler-6 Psychological Distress Scale)
Surveys use the Kessler-6 psychological distress scale to screen for psychological distress experienced by persons with anxiety and mood disorders (44). The Kessler-6 scale asks respondents about the frequency with which they have experienced six manifestations of psychological distress, which include feeling 1) nervous, 2) hopeless, 3) restless or fidgety, 4) so sad or depressed that nothing could cheer the respondent up, 5) that everything is an effort, and 6) worthless. Responses are "all of the time," "most of the time," "some of the time," "a little of the time," and "none of the time." Scoring of individual items is based on a 4-point scale according to increased frequency of the problem, yielding a total six-item score ranging from 0--24. A score of ≥13 indicates serious psychological distress (45). Serious psychological distress as defined by the Kessler-6 score is highly associated with anxiety disorders and depression but does not identify a specific mental illness (44).
Mentally Unhealthy Days
Health-related quality of life (HRQOL) is a multidimensional concept that includes physical, mental, emotional, and social domains and reflects perceived physical and mental health (46,47). HRQOL often is used to characterize certain aspects of disease impact, disability, and injury and to identify unmet health needs and disparities among various sociodemographic populations (48). A core set of four questions (i.e., the Healthy Days Core Module, or HRQOL-4) has been standardized and validated for public health survey purposes. HRQOL-4 asks respondents about self-rated general health, physical health, mental health, and activity limitations resulting from poor physical or mental health during the previous 30 days (48). One indicator often used to measure HRQOL is the number of mentally unhealthy days experienced by a person. Typically, the question asks: "Now thinking about your mental health, which includes stress, depression, and problems with emotions, for how many days during the past 30 days was your mental health not good?" Respondents who report ≥14 mentally unhealthy days over the past month are defined as having frequent mental distress. The mentally unhealthy days question has acceptable criterion validity and test-retest reliability (48--50). In a large prospective study, this question predicted 1-month and 12-month physician visits, hospitalizations, and mortality outcomes (51).
Health-Care Surveys
Data from health-care providers and insurers provide an additional important source of information on the prevalence of mental illness in the United States. Coding systems used by hospitals and medical providers for billing purposes typically use the ICD-9 coding system, which, as mentioned previously, is not completely congruent with the DSM-IV-TR. In addition, mental health professionals generally use the DSM-IV-TR nomenclature, whereas primary care providers use other terminology. In practice, regardless of the diagnostic system used, diagnoses vary according to the training of the coder, local practice, availability of treatment resources, and reimbursement codes.
CDC Surveillance Systems and Surveys that Measure Prevalence and Impact of Mental Illness
CDC systems for measuring the prevalence and impact of mental illness in the U.S. adult population fall into two categories: 1) population surveys, which are used to estimate mental illness prevalence, and 2) national health-care surveys that include a diagnosed psychiatric condition based on ICD-9 codes, which are used to estimate outpatient visits and hospitalizations and reflect access to and use of health care by persons with mental illness (Table 1). Both of these systems provide public access data sets that allow researchers to address specific queries or conduct specific analyses. In combination with information from other studies and surveys, notably surveys conducted by SAMHSA, data from these CDC systems can be used to plan, implement, and evaluate mental illness prevention strategies and to explore ways to protect and promote mental health. Proper interpretation of mental health surveillance statistics requires an understanding of 1) the reason the data were collected (e.g., to identify prevalence or for program planning); 2) the survey population (e.g., representative of state or national population, sample frame, and time conducted); 3) survey methods (e.g., telephone vs. in-person interviews, record reviews or abstracts, and vital statistics); 4) questionnaires and questions used (e.g., standardization, validity, and reliability); 5) parameters measured (population prevalence and effects of the illness); and 6) appropriate analyses (adjustment and weighting for survey designs and response rates, rates, proportions, and continuous measures).
Population Surveys
BRFSS
BRFSS is a state-based telephone survey that was established in 1984.* BRFSS is the largest ongoing telephone health survey in the world, with approximately 450,000 adult interviews completed each year. BRFSS collects standardized, state-specific data concerning preventive health practices and risk behaviors associated with infectious diseases, chronic diseases, and injuries in the adult population. Data are collected in all 50 states, the District of Columbia, Puerto Rico, the U.S. Virgin Islands, and Guam. The large size of the survey permits calculation of state-specific estimates (and in some cases, substate estimates) and aggregated nationwide estimates. States use BRFSS data to identify emerging health problems, establish and track health objectives, and develop and evaluate public health policies and programs. For many states, BRFSS is the only source of timely, accurate, state-based data on health-related behaviors.
BRFSS interviews consist of three parts: 1) core questions asked in all states and territories (e.g., demographics, HRQOL, access to health care, disability, chronic conditions, and risk behaviors); 2) optional modules with questions on specific topics (for mental illness: the anxiety and depression module and the mental illness and stigma module); and 3) questions added by individual states. BRFSS data are directly weighted for the probability of selection of a telephone number, the number of adults in a household, and the number of landline telephone numbers that reach a household. Data are then stratified to adjust for nonresponse, to adjust for noncoverage of households without telephones, and to force the sum of the weighted frequencies to equal the adult population in each state.
Every year, the core BRFSS includes a question on number of mentally unhealthy days as a measure of HRQOL. States also may administer BRFSS optional modules (conducted through a collaboration between CDC and SAMHSA) that address other mental health topics in depth. In 2006, 2008, and 2010, an optional BRFSS module on anxiety and depression contained the PHQ-8, one question on lifetime diagnosis of anxiety, and one question on lifetime diagnosis of depression. In 2007 and 2009, an optional BRFSS module on mental illness and stigma included the Kessler-6 scale (past 30 days), one question on activity limitations associated with a mental health condition or emotional problem, one question on treatment, and two questions on attitudes toward mental illness that might underlie stigma. Because certain individual states do not use these optional modules, BRFSS cannot provide national estimates of depression or psychological distress.
CDC provides public online access to the following summary statistics from various BRFSS modules:
- Prevalence and trends data: prevalence estimates for core variables by year and by state from 1995 to the present†
- Selected metropolitan/micropolitan area risk trends (SMART) city and county data: CDC information on all health risk data for metropolitan and micropolitan statistical areas (MMSAs) by year and category, with users able to generate reports that compare statistics by MMSA and to use SMART to produce charts that show state, MMSA, and county data for a limited set of health risk factors (2002--2008)§,¶
- BRFSS maps: MMSA maps for many core variables (2002--present)** and annual BRFSS survey data and technical documentation so that researchers can conduct their own analyses
- Yearly state-based survey data sets and technical documentation (1984--present)††
- Yearly data sets and technical documentation for counties and MMSAs with ≥500 respondents (2002--present)§§
- Yearly data and technical documentation for state and MMSA geographic information system data files (2002--present)¶¶
National Health Interview Survey
The National Health Interview Survey (NHIS) is a continuous cross-sectional survey of the civilian U.S. household population. NHIS monitors the health of the U.S. population through the collection and analysis of data on a broad range of health topics.*** Data are collected through an in-person household interview. The basic module, which remains largely unchanged from year to year, includes three components: a family core questionnaire, a sample adult core questionnaire, and a sample child core questionnaire. The family core collects information on everyone in the family and serves as the sampling frame for additional integrated surveys. This core includes information concerning household composition and sociodemographic characteristics, tracking information, information for linkage to administrative databases, indicators of health status, activity limitations, injuries, health insurance coverage, and access to and use of health-care services. One adult and one child (if any children aged <18 years are present) are selected randomly from each family, and information on each is collected with the sample adult core and sample child core questionnaires. Because certain health issues are different for adults and children, certain items on these two questionnaires differ; however, both collect basic data on health status, health-care services, and behavior. These sections of the survey yield the sample adult and the sample child data files.
NHIS uses a multistage area probability design to identify representative U.S. households. The sample is redesigned and redrawn approximately every 10 years to more accurately measure the changing population and to meet new survey objectives. NHIS oversamples blacks, Hispanics, and Asians (especially those aged ≥65 years) to allow for more precise estimation of health characteristics in these growing minority populations. The NHIS sample size (approximately 10,000) is not sufficient to provide reliable state-level estimates for most states. Although the database does not identify respondents' state of residence, state-level estimates can be produced for more populous states by requesting state identifiers through the CDC National Center for Health Statistics (NCHS) Research Data Centers.†††
NHIS sample weights, which account for the differential probabilities of selection, nonresponse, and noncoverage, must be used for all analyses. Methods that incorporate the complex sample design and weights (e.g., Taylor series linearization) must be used to calculate appropriate standard errors.
Since 1997, NHIS has used the Kessler-6 scale (past 30 days) to identify serious psychological distress among adults. National rates for psychological distress by age, sex, and race are produced quarterly through the NHIS Early Release Program and are available online. In 2007, the NHIS included three questions on lifetime diagnoses: "Have you EVER been told by a doctor or other health professional that you had bipolar disorder? Schizophrenia? Mania or psychoses?"
National Health and Nutrition Examination Survey
The National Health and Nutrition Examination Survey (NHANES) is a continuous survey of the health and nutritional status of the U.S. civilian noninstitutionalized population.§§§ Although NHANES uses a multistage probability household sampling design to obtain a nationally representative sample, the sample is not sufficient for state- or local-level analyses. NHANES sample weights, which account for the differential probabilities of selection, nonresponse, and noncoverage, must be used for all analyses. Survey participants complete an interview administered in their home and then are invited to participate in an examination conducted in a mobile examination center. This includes a private interview, a standardized physical examination, and collection of biological specimens for laboratory testing. NHANES collects data on the prevalence of 1) chronic diseases and conditions (including undiagnosed conditions detected through the examination or laboratory testing) and risk factors (e.g., obesity, smoking, serum cholesterol levels, hypertension, and diet and nutritional status), 2) vaccination status, 3) infectious disease prevalence, 4) health insurance, and 5) measures of environmental exposures. Other topics include hearing, vision, anemia, diabetes, cardiovascular disease, osteoporosis, oral health, pharmaceuticals and dietary supplements, physical fitness, HRQOL, and health-care use. In the private mobile examination center interview, NHANES uses the PHQ-9 to measure depression, and since 2000, this NHANES interview also has included the question on number of mentally unhealthy days. The examination and laboratory data collected allow researchers to examine the relationships between depression and health variables not available on other national surveys.
Pregnancy Risk Assessment Monitoring System
The Pregnancy Risk Assessment Monitoring System (PRAMS) was established in 1987 and is a state-based, cross-sectional survey of women who have recently delivered a live-born infant. PRAMS provides population-based data that can be used to develop maternal and infant health programs and policies.¶¶¶ The survey uses a mixed-mode data collection method. Each month, randomly selected women who have delivered a live-born infant are requested to complete a mail questionnaire; follow-up with nonresponders occurs by phone. Data are collected in 37 states and New York City, representing approximately 75% of the births in the United States. Data are weighted to adjust for survey design, nonresponse, and noncoverage.
PRAMS collects information on maternal behaviors, attitudes, and experiences before, during, and after pregnancy. Survey responses are linked to birth certificate data. The questionnaire includes core questions asked of all participants in all states, optional standard questions pretested by CDC, and state-developed questions. PRAMS provides estimates of postpartum depression by using two questions similar to those included in the PHQ-8: 1) "Since your new baby was born, how often have you felt down, depressed, or hopeless?" and 2) "Since your new baby was born, how often have you had little interest in doing things?" Possible responses are "never," "rarely," "sometimes," "often," and "always." Women who answer "often" or "always" to either question or both questions are categorized as having postpartum depression.
CDC provides access to PRAMS data electronically through CPONDER (CDC's PRAMS On-line Data for Epidemiologic Research).**** CPONDER provides access to prevalence estimates by state and by year (2000--2008). In addition, CPONDER indexes 54 variables by topic for selection as the outcome variable in cross-tabular analyses. Twelve control variables may be used to stratify these outcomes in an analysis. Analyses may include a single state and all available years or all available states and a single year.
National Health-Care Surveys
CDC conducts surveys of health-care providers, and the data from these surveys complement data from the population-based surveys to provide a more complete representation of the occurrence of mental illness in the United States. For the health-care surveys, CDC collects data from a sample of organizations that provide health care (e.g., nursing homes, inpatient hospitals, or physician offices). The data can be used to examine factors that influence use of health-care resources, quality of health care, and disparities in health-care services in population subgroups. In addition, because the surveys collect core information from a sample of providers that remains relatively stable over time, trends in the types of care delivered in each setting can be monitored and examined in relation to the characteristics of providers, patients, and clinical management of patient care.
National Ambulatory Medical Care Survey
The National Ambulatory Medical Care Survey (NAMCS)†††† collects information on the use of ambulatory care services in the United States. NAMCS uses a multistage probability sample of visits to office-based physicians and health-care providers in community health centers and collects data on provider characteristics. Sample data are weighted to produce national estimates that describe the provision and use of ambulatory medical care services in the United States. Public use data files are released annually and include a visit statistical weight and (since 2005) a physician statistical weight. Information on mental health and mental illness available from NAMCS includes reasons for visit, physician diagnosis, medications, treatment, referrals, and one item on comorbid depression. Physician diagnoses are recorded as written by the physician (text or ICD-9 codes). Nosologists convert text to ICD-9 codes for the data files.
National Hospital Ambulatory Medical Care Survey
The National Hospital Ambulatory Medical Care Survey (NHAMCS)†††† collects data on the use of ambulatory care services in hospital emergency and outpatient departments. NHAMCS involves a multistage probability sample of visits to the emergency and outpatient departments of noninstitutional, general, and short-stay hospitals in the United States. Federal, military, and U.S. Department of Veterans Affairs hospitals are not included. Data collected from outpatient departments are similar to those collected by NAMCS. Data from emergency department visits are slightly different from the outpatient department data and include whether the patient was admitted to a mental health unit or transferred to a psychiatric hospital. Sample data are weighted to produce national estimates. Public-use data files are released annually.
National Hospital Discharge Survey
The National Hospital Discharge Survey (NHDS)§§§§ obtains national-level information on characteristics of inpatients discharged from nonfederal, short-stay (<30 days) hospitals in the United States. Only hospitals with an average length of stay of <30 days, general hospitals, and children's general hospitals are included in the survey. Psychiatric hospitals with an average length of stay of <30 days are eligible. NHDS does not include federal, military, U.S. Department of Veterans Affairs hospitals, prison hospitals, or hospitals with fewer than six beds. Hospitals are selected by using a three-stage stratified design. Patient information collected includes demographics, length of stay, diagnoses, and procedures. Hospital characteristics collected include region, ownership, and number of beds. NHDS sample statistical weights account for nonresponse and must be used for all analyses. Methods that incorporate the complex sample design and weights, such as Taylor series linearization, must be used to calculate appropriate standard errors.
National Nursing Home Survey
The National Nursing Home Survey (NNHS)¶¶¶¶ is a continuous series of national sample surveys of nursing homes and their residents and staff members. NNHS provides information on nursing homes from the perspectives of the provider and recipient of services. Data on facilities include characteristics such as number of beds, ownership, affiliation, Medicare and Medicaid certification, specialty units, services offered, number and characteristics of staff, expenses, and charges. Data on current residents include demographic characteristics, health status, up to 16 current diagnoses, level of assistance needed with activities of daily living, vision and hearing impairment, continence, services received, and sources of payment. The survey uses a stratified two-stage probability design. The first stage is the selection of facilities, and the second stage is selection of residents.
Findings from CDC Surveillance Systems and Surveys
Through the surveys and surveillance systems described in this report, CDC provides prevalence estimates on current depression, postpartum depression, psychological distress, number of mentally unhealthy days, and lifetime diagnosis of depression, anxiety, bipolar disorder, and schizophrenia in the U.S. adult population. CDC health-care surveys provide health services information about physician, hospital outpatient, and emergency department visits related to mental illness. All of these CDC systems can provide data for national-level (or nationwide) estimates by sex, age, race, and ethnicity. BRFSS and PRAMS data also can be used for state-level estimates.
Population Surveys
Current Depression
Two CDC surveillance systems provide estimates for current depression: NHANES (national estimates) and BRFSS (state estimates). These systems use the PHQ-9 (NHANES) or PHQ-8 (BRFSS) to estimate the occurrence of depression in the last 2 weeks. For example, using continuously collected data from 2005--2008 (the most recent data available), results from NHANES indicate that 6.8% of U.S. adults had depression (measured by the PHQ-9) during the 2 weeks before the survey (Table 2).
Results from BRFSS for current depression (measured by the PHQ-8) vary according to the year conducted because in different years, a varying number of states might have administered the optional modules containing the mental illness--related questions. Results from 2006 (in 38 states, the District of Columbia, Puerto Rico, and the U.S. Virgin Islands) using the PHQ-8 indicate that approximately 8.7% of respondents had current depression. Results from 2008 in 16 states using the optional BRFSS anxiety and depression module indicate that 8.2% had current depression. Prevalence estimates were higher among women and non-Hispanic blacks compared with other groups (Table 3).
Using the PHQ-8 algorithm for major depressive disorder (36), the 2006 BRFSS prevalence estimate of major depression during the previous 2 weeks was 3.5% (95% confidence interval [CI]: 3.3--3.7) and in 2008 was 3.0% (95% CI: 2.8--3.3). BRFSS state-specific prevalence estimates for depression in 2006 and 2008 show marked variations from state to state, with prevalences ranging from 4.3% in North Dakota to 13.7% in Mississippi and West Virginia (Table 4). The prevalence of depression was generally highest in the southeastern states (Figure 1).
Postpartum Depression
During 2004--2008, a total of 14.5% of PRAMS respondents reported symptoms of postpartum depression (i.e., answered "often" or "always" to either or both of the following questions): 1) "Since your new baby was born, how often have you felt down, depressed, or hopeless?" and 2) "Since your new baby was born, how often have you had little interest in doing things?") (Table 5). The prevalence of postpartum depression varied by age, ranging from 10.3% among women aged 30--39 years to 23.3% among women aged ≤19 years. Prevalence also varied by race/ethnicity: 16.8% among Hispanic women, 11.9% among non-Hispanic white women, and 21.5% among non-Hispanic black women. Among 22 states, the prevalence of postpartum depression ranged from 9.8% in Minnesota to 21.3% in Tennessee (Table 6).
Psychological Distress
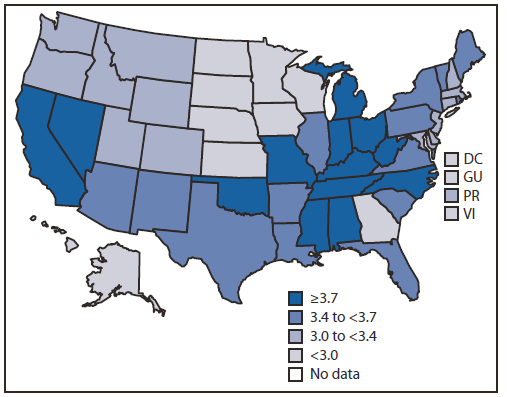
Both NHIS and optional modules of BRFSS use the Kessler-6 scale to identify persons who experienced psychological distress during the 30 days before the survey. NHIS data indicate that in 2009, 3.2% of respondents experienced serious psychological distress (Table 7). BRFSS included the Kessler-6 in the optional mental illness and stigma module during 2007 (administered in 35 states, the District of Columbia, and Puerto Rico) and 2009 (16 states). Among participating states, prevalence estimates were similar in 2007 (4.0%) and 2009 (3.9%) (Table 8). These BRFSS estimates are higher than NHIS estimates, which might be a result of the limited geographical coverage of BRFSS, differences in survey design and methods, question placement, and context. As in NHIS, women were more likely to have serious psychological distress than men, and rates were highest among adults aged 45--54 years and non-Hispanic blacks. BRFSS data for state-specific prevalences of serious psychological distress during 2007 and 2009 indicate that, like depression, prevalence varied among states, ranging from 1.9% in Utah to 9.4% in Tennessee (Table 9). The prevalence of serious psychological distress was generally highest in the southeastern states (Figure 2).
Mentally Unhealthy Days
The question on number of mentally unhealthy days is included in the BRFSS core questionnaire; therefore, data are available for every year for all states and territories. Nationwide, for 2009, adults aged ≥18 years reported an average of 3.5 mentally unhealthy days during the past 30 days (Table 10). Among states, in 2009, the median number of mentally unhealthy days was 3.4, and the 25th and 75th quartiles were 3.1 and 3.7 days, respectively (Table 11). The mean number of mentally unhealthy days was highest in the southeastern states (Figure 3).
Lifetime Diagnosis of Mental Illness
The BRFSS optional anxiety and depression module includes questions on whether respondents have received a diagnosis of depression or anxiety disorder in their lifetime. Although the number of participating states varied between the 2 years in which the module was administered, rates of reported lifetime diagnosis of depression were similar in 2006 (15.7%) and 2008 (16.1%) (Tables 12 and 13). The prevalence of lifetime diagnosis of anxiety disorders was slightly lower, with 11.3% in 2006 and 12.3% in 2008 (Tables 14 and 15). In 2007, NHIS included a question for all respondents on lifetime diagnosis of bipolar disorder and schizophrenia; 1.7% of participants had received a diagnosis of bipolar disorder, and 0.6% had received a diagnosis of schizophrenia (Table 16).
National Health-Care Surveys
NAMCS and NHAMCS
During 2007--2008, an estimated 47.8 million ambulatory care visits were made by patients with primary mental health diagnoses, which constituted approximately 5% of all ambulatory care visits made in the United States during those 2 years (Tables 17 and 18). Women made 29.4 million of the visits, compared with 18.5 million for men. Of all mental illness--related visits, the greatest proportion of visits (31%) were made by patients with any depressive disorder, followed by 23% of visits among those with schizophrenia and other psychotic disorders. The proportion of visits related to alcohol and drug use that occurred in emergency and outpatient departments was higher than the proportion of visits for other mental illness diagnoses.
NHDS
Among patients discharged from nonfederal, short-stay hospitals, mental illness was a primary diagnosis for 97.9 discharged patients per 10,000 population among persons aged 18--64 years. The occurence decreased with age to 64.4 among those aged ≥65 years (Table 19). Mood disorders were the most common primary mental illness discharge diagnosis, and the occurence decreased with age, with a range of 46.0 per 10,000 population among patients aged 18--44 years to 19.2 per 10,000 population among those aged ≥65 years. Alcohol and drug use disorders were the second most common diagnoses and also decreased with age. In contrast to rates for primary diagnoses, discharges rates among patients with mental illness listed as any of the diagnoses increased with age, ranging from 231.4 discharged patients per 10,000 population among those aged 18--44 years to 650.8 per 10,000 population among those aged >65 years (Table 20). As with primary diagnoses of mental illness, mood disorders were the most common diagnosis, followed by alcohol and drug use disorders.
NNHS
The prevalence of nursing home residents with a primary diagnosis of mental illness in 2004 increased with age, ranging from 18.7% among those aged 65--74 years to 23.5% among those aged ≥85 years (Table 21). Dementia and Alzheimer disease were the most common primary diagnoses among nursing home residents with a primary diagnosis of mental illness, and the prevalence of each increased with age. Among nursing home residents with any diagnosis of mental illness (among any of 16 current diagnoses), mood disorders and dementia were the most common diagnoses among residents aged 65--74 years and 75--84 years (Table 22). Among residents aged ≥85 years, dementia (41.0%) was the most common mental illness, followed by mood disorders (35.3%). In 2004, approximately two thirds of nursing home residents had a diagnosis of a mental illness, and approximately one third of these had a mood disorder.
Discussion
CDC national surveillance surveys such as NHANES and NHIS are important for developing national policies and tracking progress toward national health goals such as those described in Healthy People 2010 and Healthy People 2020. Data from these surveys are useful for national planning and research.
Two state-based CDC surveys, BRFSS and PRAMS, can provide data at the state or substate levels that can be used for both national and state-level planning. For example, variations in BRFSS estimates for certain mental illnesses might help determine the focus of certain mental health services.
The prevalence of current depression varies substantially by state (from 4.3% in North Dakota to 13.7% in Mississippi and West Virginia), as does the prevalence of serious psychological distress (from 1.9% in Utah to 9.4% in Tennessee). These variations might reflect regional differences, including demographic characteristics, socioeconomic conditions, availability of and access to health-care services, and patterns of reimbursement for mental health services, that would be useful in planning (52,53). Southeastern states generally have the highest prevalence of depression, serious psychological distress, and mean number of mentally unhealthy days. This finding likely reflects, in part, sociodemographics, access to and use of health care, and the association between mental illness and certain chronic diseases such as obesity, diabetes, and cardiovascular disease (13,14). For some states, BRFSS, PRAMS, and other state-based surveys have provided mental illness data that state and local authorities have used to identify the need for services at the local or regional level.
CDC surveys focus on depression, and they lack sufficient data on anxiety disorders. Anxiety disorders are as common in the population as depression and, like depression and severe psychological distress, can result in high levels of impairment. Moreover, the pathophysiologic characteristics of anxiety disorders are similar to those of depression and often are associated with the same chronic medical conditions (54--56). The National Epidemiologic Survey on Alcohol and Related Conditions (NESARC), conducted by the National Institute on Alcohol Abuse and Alcoholism, estimated that during 2001--2002, 14% of U.S. adults had an anxiety disorder (7%, specific phobia; 3%, social phobia; 2%, generalized anxiety disorder; and 1%, panic disorder) (23). Estimates from the 2003 National Comorbidity Survey Replication (NCS-R) were similar, indicating that 18% of adults had an anxiety disorder (9%, specific phobia; 7%, social phobia; 4%, posttraumatic stress disorder; and 3%, panic disorder); 56% of the disorders identified were categorized as serious or moderate (5). Several standardized and validated scales can be used in telephone and in-person interviews to identify and classify anxiety disorders (57,58). Better documentation of the impact of anxiety disorders might help guide national public health policy. At the state and local levels, documenting the prevalence and impact of anxiety disorders might help ascertain the need for additional public health services for these disorders.
Although CDC surveys and information systems have provided important information on the prevalence of mental illness, none of them was designed solely to monitor mental illness. They are general surveillance tools that have added components on mental illness gradually over time as recognition of the importance of mental illness in public health has increased. For example, NHANES and NHIS are national CDC surveys designed to monitor the entire range of public health diseases and conditions and can include only a limited number of questions concerning mental illness. Likewise, the state-based CDC BRFSS is designed to provide state and local estimates on a wide range of health behaviors. BRFSS mental illness questions are primarily contained in two small mental illness modules that are optional for states and are not included on the core BRFSS questionnaire administered by all states. States may choose to administer the optional modules, but not all states do so because of financial constraints, competing state surveillance priorities, and limitations in the length of time respondents are willing to spend completing a telephone survey. The willingness of the states to administer optional modules is affected by the rapid rise in the proportion of households that no longer contain a landline telephone (59). Survey calls to cell phone numbers are limited to BRFSS core questions and do not include the optional survey modules, partly because cell phone respondents are not willing to spend as much time completing BRFSS questions as respondents using landline telephones. Recognizing that the number of households with landline telephones will continue to decrease, CDC is exploring additional methods to obtain a valid sample for mental illness questions in BRFSS.
Increasingly, physicians and others who treat mental illness, as well as public health experts, are recognizing the substantial overlap between mental illness and diseases traditionally considered to be matters of public health concern. The ability of certain mental illnesses to exacerbate morbidity from several chronic diseases is well-established. Recent studies have explored the causal pathways from mental illness to certain chronic diseases (60,61), highlighting the need for more accurate and timely information on the epidemiology of mental illness in the United States. Future mental illness surveillance surveys should measure both depression and anxiety disorders and include more detailed questions concerning their impact on quality of life, associated chronic medical conditions, and issues such as family violence, alcohol and substance abuse, and access to and use of health care. For example, CDC is collaborating with SAMHSA and the Gulf Coast states to conduct surveillance of mental illness in coastal regions affected by the 2010 Deepwater Horizon oil spill. This targeted surveillance effort uses standardized questionnaires to identify the occurrence of anxiety disorders, depression, and psychological distress, as well as the effects of mental illness on and use of mental illness services by the Gulf Coast population.
Increased awareness of the value of mental illness surveillance is important, as is identification of gaps in the available CDC data and data from other sources. The impact of psychological distress and depression is well-documented, and the risk factors and associated issues such as access to and use of health services have been identified. Therefore, increased emphasis should be placed on using this information to initiate public health action and on using surveillance to measure outcomes.
Acknowledgments
This report is based, in part, on contributions by Shilpa Bengeri, Nova Research Company, Hyattsville, Maryland; Janet R. Cummings, PhD, Emory University Rollins School of Public Health, Atlanta, Georgia; Joseph Gfroerer, Center for Behavioral Health Statistics and Quality, Substance Abuse and Mental Health Services Administration, Rockville, Maryland; Elsie Freeman, MD, Maine Department of Health and Human Services, Augusta, Maine; Catherine Simile, PhD, Patricia Barnes, MA, Vladislav Beresovsky, PhD, Yelena Gorina, MPH, MS, Xiang Liu, MS, Susan M. Schappert, MA, Betzaida Tejada-Vera, Anita Bercovitz, PhD, and Jennifer H. Madans, PhD, National Center for Health Statistics, Rosemarie Kobau, MPH, MAPP, Matthew M. Zack, MD, Sherry Farr, PhD, John P. Barile, and Janet B. Croft, PhD, National Center for Chronic Disease Prevention and Health Promotion, Ruth Perou, PhD, National Center for Birth Defects and Developmental Disabilities, James W. Buehler, MD, and JM (Sally) Lin, PhD, Public Health Surveillance Program Office, Hao Tian, PhD, National Center for Emerging and Zoonotic Infectious Diseases, Ileana Arias, PhD, Office of the Director, and Stephen B. Thacker, MD, Office of Surveillance, Epidemiology, and Laboratory Services, CDC.
References
- US Department of Health and Human Services. Mental health: a report of the Surgeon General. Rockville, MD: US Department of Health and Human Services, Substance Abuse and Mental Health Services Administration, Center for Mental Health Services, National Institutes of Health, National Institute of Mental Health; 1999. Available at http://www.surgeongeneral.gov/library/mentalhealth/home.html. Accessed July 1, 2011.
- World Health Organization. Promoting mental health: concepts, emerging evidence, practice (summary report). Geneva, Switzerland: World Health Organization; 2004. Available at http://www.who.int/mental_health/evidence/en/promoting_mhh.pdf. Accessed July 1, 2011.
- Kessler RC, Berglund P, Demler O, Jin R, Merikangas KR, Walters EE. Lifetime prevalence and age-of-onset distributions of DSM-IV disorders in the National Comorbidity Survey Replication. Arch Gen Psych 2005;62:593--602.
- Kessler RC, Chiu WT, Demler O, Walter EE. Prevalence, severity, and comorbidity of 12-month DSM-IV disorders in the National Comorbidity Survey Replication. Arch Gen Psych 2005;62:617--709.
- Kessler RC, Chiu WT, Colpe L, et al. The prevalence and correlates of serious mental illness (SMI) in the National Comorbidity Survey Replication (NCS-R) [Chapter 15]. In Manderscheid RW, Berry JT, eds. Mental health, United States, 2004. Rockville, MD: Substance Abuse and Mental Health Services Administration; 2006. DHHS Pub no. (SMA)-06-4195.
- Colton CW, Manderscheid RW. Congruencies in increased mortality rates, years of potential life lost, and causes of death among public mental health clients in eight states. Prev Chron Dis 2006;3:A42.
- Mathers CD, Loncar, D. Projections of global mortality and burden of disease from 2002 to 2030. PLoS Medicine 2006;3:e442.
- Murray CJ, Lopez A D. Global mortality, disability, and the contribution of risk factors: Global Burden of Disease Study. Lancet 1997;349:1436--42.
- Kessler RC, Berglund PA, Zhao S, et al. The 12-month prevalence and correlates of serious mental illness, In Manderscheid RW, Sonnenschein MA, eds. Mental health, United States, 1996. Washington, DC: US Government Printing Office; 1996. DHHS publication no. (SMA) 96-3098.
- Insel TR. Assessing the economic costs of serious mental illness. Am J Psych 2008;165:663--5.
- Mark TL, Levit KR, Buck JA, Coffey RM, Vandivort-Warren R. Mental health treatment expenditure trends, 1986--2003. Psychiatr Serv 2007;58:1041--8.
- Kessler RC, Heeringa S, Lakoma MD, Petukhova M, Rupp AE, Schoenbaum M. Individual and societal effects of mental disorders on earnings in the United States: results from the National Comorbidity Survey Replication. Am J Psychiatry 2008;165:703--11.
- Chapman DP, Perry GS, Strine TW. The vital link between chronic disease and depressive disorders. Prev Chronic Dis 2005;2:A14.
- Evans DL, Charney DS, Lewis L, Golden RN, Gorman JM, Krishnan KR. Mood disorders in the medically ill: scientific review and recommendations. Biol Psychiatry 2005;58:175--89.
- El-Gabalawy R, Katz LY, Sareen J. Comorbidity and associated severity of borderline personality disorder and physical health conditions in a nationally representative sample. Psychosom Med 2010;72:641--7.
- Lichtman JH, Bigger JT, Blumenthal JA, Frasure-Smith N, Kaufmann PG, Lespérance F. Depression and coronary heart disease: recommendations for screening, referral, and treatment: a science advisory from the American Heart Association Prevention Committee of the Council on Cardiovascular Nursing, Council on Clinical Cardiology, Council on Epidemiology and Prevention, and Interdisciplinary Council on Quality of Care and Outcomes Research: endorsed by the American Psychiatric Association. Circulation 2008;118:1768--75.
- Pincus H, Watkins K, Houtsinger J, Keyser D. Applying the Institute of Medicine quality chasm framework to improving health care for mental and substance use conditions. Psychiatr Clin North Am 2008;31:43--56.
- Broadbent E, Kydd R., Sanders D, Vanderpyl J. Unmet needs and treatment seeking in high users of mental health services: role of illness perceptions. Aust N Z J Psychiatry 2008;42:147--53.
- Levinson D, Karger CJ, Haklai Z. Chronic physical conditions and use of health services among persons with mental disorders: results from the Israel National Health Survey. Gen Hosp Psychiatry 2008;30:226--32.
- Shen C, Sambamoorthi U, Rust G. Co-occurring mental illness and health care utilization and expenditures in adults with obesity and chronic physical illness. Disease Management 2008;11:153--60.
- Wan JJ, Morabito DJ, Khaw J, Knudson MM, Dicker RA. Mental illness as an independent risk factor for unintentional injury and injury recidivism. J Trauma 2006;61:1299--304.
- Hiroeh U, Appleby L, Mortensen PB, Dunn G. Death by homicide, suicide and other unnatural causes in people with mental illness: a population-based study. Lancet 2001;358:2110--2.
- Lasser K, Boyd JW, Woolhandler S, Himmelstein DU, McCormick D, Dor DH. Smoking and mental illness: a population-based prevalence study. JAMA 2000;284:2606--10.
- CDC. Updated guidelines for evaluating public health surveillance systems: recommendations from the guidelines working group. MMWR 2001;50(No. RR-13).
- Teutsch SM, Churchill RE. Principles and practice of public health surveillance. 2nd ed. New York, NY: Oxford University Press; 2000.
- CDC. Framework for evaluating public health surveillance systems for early detection of outbreaks. Recommendations from the CDC working group. MMWR 2004;53(No. RR-5).
- Norris FH, Galea S, Friedman MJH, Watson PJ, eds. Methods for disaster mental health research. New York, NY: Guilford Press; 2006.
- American Psychiatric Association. Diagnostic and statistical manual for mental disorders. 4th ed. Washington, DC: American Psychiatric Association; 2000.
- World Health Organization. The ICD-10 classification of mental and behavioural disorders. Clinical descriptions and diagnostic guidelines. Geneva, Switzerland: World Health Organization; 1992. Available at http://www.who.int/substance_abuse/terminology/ICD10ClinicalDiagnosis.pdf. Accessed June 4, 2011.
- Miller G, Holden C. Proposed revisions to psychiatry's canon unveiled. Science 2010;327:770--1.
- First MB, Spitzer RL, Gibbon M, Williams JBW. Structured Clinical Interview for DSM-IV-TR axis I disorders, Research version. New York, NY: Biometrics Research, New York State Psychiatric Institute; 2002.
- Kessler RC, Ustun TB. The World Mental Health (WMH) Survey Initiative Version of the World Health Organization (WHO) Composite International Diagnostic Interview (CIDI). Int J Methods Psychiatr Res 2004;13:93--121.
- Lowe B, Spitzer RL, Grafe K, et al. Comparative validity of three screening questionnaires for DSM-IV depressive disorders and physicians' diagnoses. J Affect Disord 2004;78:131--40.
- Patel V, Araya R, Chowdhary N, et al. Detecting common mental disorders in primary care in India: a comparison of five screening questionnaires. Psychol Med 2008;38:221--8.
- O'Connor WD, Parslow RA. Mental health scales and psychiatric diagnoses: Responses to GHQ-12, K-10 and CIDI across the lifespan. J Affect Disord 2010;121:263--7.
- Kroenke K, Strine TW, Spitzer RL, Williams JB, Berry JT, Mokdad AH. The PHQ-8 as a measure of current depression in the general population. J Affect Disord 2009;114:163--73.
- Kroenke K, Spitzer RL, Williams JB. The PHQ-9: validity of a brief depression severity measure. J Gen Intern Med 2001;16:606--13.
- Diez-Quevedo C, Rangil T, Sanchez-Planell L, Kroenke K, Spitzer RL. Validation and utility of the Patient Health Questionnaire in diagnosing mental disorders in 1003 general hospital Spanish inpatients. Psychosom Med 2001;63:679--86.
- Huang FY, Chung H, Kroenke K, Delucchi KL, Spitzer RL. Using the Patient Health Questionnaire-9 to measure depression among racially and ethnically diverse primary care patients. J Gen Intern Med 2001;16:606--13.
- Spitzer RL, Kroenke K, Williams JB. Validation and utility of a self-report version of PRIME-MD: the PHQ primary care study. Primary care evaluation of mental disorders. Patient Health Questionnaire. JAMA 1992;282:1737--44.
- Spitzer RL, Williams JB, Kroenke K, Hornyak R, McMurray J. Validity and utility of the PRIME-MD patient health questionnaire in assessment of 3000 obstetric-gynecologic patients: the PRIME-MD Patient Health Questionnaire Obstetrics--Gynecology Study. Am J Obstet Gynecol 2000;183:759--69.
- Martin A, Rief W, Klaiberg A, Braehler E. Validity of the brief patient health questionnaire mood scale (PHQ-9) in the general population. Gen Hosp Psychiatry 2006;28:71--7.
- Pinto-Meza A, Serrano-Blanco A, Penarrubia MT, Blanco E, Haro JM. Assessing depression in primary care with the PHQ-9: can it be carried out over the telephone? J Gen Intern Med 2005;20:738--42.
- Andrews G, Slade T. Interpreting scores on the Kessler psychological distress scale (K10). Aust N Z J Public Health 2001;25:494--7.
- Aldworth J, Chromy JR, Foster M, Heller D, Novak S; RTI International. National Survey on Drug Use and Health: serious psychological distress report. Rockville, MD: Substance Abuse and Mental Health Services Administration; 2004 Available at http://www.oas.samhsa.gov/nsduh/2k4MRB/2k4spd.pdf. Accessed July 1, 2011.
- CDC. Health-related quality of life and activity limitations---eight states, 1995. MMWR 1998;47:134--40.
- Kindig DA, Asada Y, Booske B. A population health framework for setting national and state health goals. JAMA 2008;299:2081--3.
- Moriarty DG, Zack MM, Kobau R. The Centers for Disease Control and Prevention's healthy days measures---population tracking of perceived physical and mental health over time. Health Qual Life Outcomes 2003;2:1:37.
- Andresen EM, Catlin TK, Wyrwich KW, Jackson-Thompson J. Retest reliability of surveillance questions on health-related quality of life. J Epidemiol Community Health 2003;57:339--43.
- Kapp JM, Jackson-Thompson J, Petroski GF, Schootman M. Reliability of health-related quality-of-life indicators in cancer survivors from a population-based sample, 2005, BRFSS. Public Health 2009;123:321--5.
- Dominick KL, Ahern FM, Gold CH, Heller DA. Relationship of health-related quality of life to health care utilization and mortality among older adults. Aging Clin Exp Res 2002;14:499--508.
- Lewis G, Booth M, Regional differences in mental health in Great Britain. J Epidemiol Community Health 1992;46:608--11.
- Strine TW, Dhingra SS, Kroenke K, Qayad M, Ribble JL, Okoro CA. Metropolitan and micropolitan statistical area estimates of depression and anxiety using the Patient Health Questionnaire-8 in the 2006 Behavioral Risk Factor Surveillance System. Int J Public Health 2009;54:117--24.
- Wardenaar KJ, Vreeburg SA, Veen TV, et al. Dimensions of depression and anxiety and the hypothalamo-pituitary-adrenal axis. Biol Psychiatry 2010;15:366--73.
- Albert CM, Chae CU, Rexrode KM, Manson JE, Kawachi I. Phobic anxiety and risk of coronary heart disease and sudden cardiac death among women. Circulation 2005;111:480--7.
- Kawachi I, Colditz GA, Ascherio A, et al. Prospective study of phobic anxiety and risk of coronary heart disease in men. Circulation 1994;89:1992--7.
- Kroenke K, Spitzer RL, Williams JBW, Monahan PO, Lo B. Anxiety disorders in primary care: prevalence, impairment, comorbidity, and detection. Ann Intern Med 2007;146:317--25.
- Spitzer RL, Kroenke K, Williams JB, et al. A brief measure for assessing generalized anxiety disorder: the GAD-7. Arch Intern Med 2006;166:1092--7.
- Hu SS, Balluz L, Battaglia MP, Frankel MR. The impact of cell phones on public health surveillance. Bull World Health Organ 2010;77:799.
- Kubzansky LD, Koenen KC. A prospective study of posttraumatic stress disorder symptoms and coronary heart disease in women. Health Psychol 2009;28:125--30.
- Aiello AE, Simanek AM, Galea S. Population levels of psychological stress, herpesvirus reactivation and HIV. AIDS Behav 2010;14:308--17.
* Additional information available at http://www.cdc.gov/brfss/index.htm.
† Additional information available at http://apps.nccd.cdc.gov/brfss.
§ Additional information available at http://apps.nccd.cdc.gov/brfss-smart/index.asp.
¶ Additional information available at http://apps.nccd.cdc.gov/brfss-smart/selquickviewchart.asp.
** Additional information available at http://apps.nccd.cdc.gov/gisbrfss/default.aspx.
†† Additional information available at http://www.cdc.gov/brfss/technical_infodata/surveydata.htm.
§§ Additional information available at http://www.cdc.gov/brfss/smart/technical_infodata.htm.
¶¶ Additional information available at http://www.cdc.gov/brfss/maps/gis_data.htm.
*** Additional information available at http://www.cdc.gov/nchs/nhis.htm.
††† Additional information available at http://www.cdc.gov/rdc.
§§§ Demographic, questionnaire, examination, and laboratory data sets are available at http://www.cdc.gov/nchs/nhanes/nhanes2007-2008/nhanes07_08.htm.
¶¶¶ Additional information available at http://www.cdc.gov/prams.
**** Additional information available at http://www.cdc.gov/prams/CPONDER.htm.
†††† Additional information available at http://www.cdc.gov/nchs/ahcd.htm.
§§§§ Additional information available at http://www.cdc.gov/nchs/nhds.htm.
¶¶¶¶ Additional information available at http://www.cdc.gov/nchs/nnhs.htm.

* Patient Health Questionnaire-8 severity score of ≥10.
† Quartiles based on point estimates (see Table 4).
§ For Arizona, Colorado, Idaho, Illinois, Massachusetts, New York, and Ohio, data are from 2008.
Alternate Text: This figure is a map of the United States showing the prevalence of current depression among adults aged ≥18 years, by state quartile, using data from the 2006 Behavioral Risk Factor Surveillance System. The prevalence of depression was generally highest in the southeastern states Current depression was defined as a Patient Health Questionnaire-8 severity score of ≥10. Quartiles are based on point estimates (see Table 4). For Arizona, Colorado, Idaho, Illinois, Massachusetts, New York, and Ohio, data are from 2008.
FIGURE 2. Prevalence of serious psychological distress* among adults aged ≥18 years, by state quartile† --- Behavioral Risk Factor Surveillance System, United States, 2007§
* Kessler-6 score of ≥13.
† For Tennessee and Utah, data are from 2009.
§ Quartiles based on point estimates (see Table 9).
Alternate Text: This figure is a map of the United States showing the prevalence of serious psychological distress among adults aged ≥18 years, by state quartile, using data from the 2007 Behavioral Risk Factor Surveillance System. The prevalence of serious psychological distress was generally highest in the southeastern states. Serious psychological distress was defined as a Kessler-6 score of ≥13. Quartiles are based on point estimates (see Table 9). For Tennessee and Utah, data are from 2009.
FIGURE 3. Mean number of mentally unhealthy days* during past 30 days among adults aged ≥18 years, by state quartile --- Behavioral Risk Factor Surveillance System, United States, 2009
* Survey question: "Now thinking about your mental health, which includes stress, depression, and problems with emotions, for how many days during the last 30 days was your mental health not good?"
Alternate Text: This figure is a map of the United States showing the mean number of mentally unhealthy days during past 30 days among adults aged ≥18 years, by state quartile, using data from the 2009 Behavioral Risk Factor Surveillance System. The mean number of mentally unhealthy days was highest in the southeastern states The survey question was: "Now thinking about your mental health, which includes stress, depression, and problems with emotions, for how many days during the last 30 days was your mental health not good?"
|
TABLE 1. CDC surveys and surveillance systems that collect data on mental illness among adults |
|||||
|---|---|---|---|---|---|
|
Name, website, and CDC sponsor |
Description |
Method of data collection |
Survey topics |
Mental health topics and questions |
Population |
|
Behavioral Risk Factor Surveillance System (BRFSS) Public Health Surveillance Program Office |
BRFSS is a state-based system of health surveys that collects information on health-risk behaviors, preventive health practices, and health-care access primarily related to chronic disease and injury. For many states, BRFSS is the only available source of timely, accurate data on health-related behaviors. |
Telephone interviews |
Heath-risk behaviors Preventive health practices Health-care access Health-related quality of life Mental illness screening Disability Violence |
Anxiety and depression module (PHQ-8, lifetime diagnosis of anxiety and depression) Mental illness and stigma module (K-6, stigma, mental health treatment, and mental illness--related disability) Health-related quality of life (number of days in past 30 days respondent felt that mental health was not good, felt depressed, felt anxious, felt not getting enough sleep, and felt full of energy) Life satisfaction Social support Smoking, alcohol use, physical activity, and body mass index Health-care use and access Sexual and intimate partner violence |
National sample of one person (aged ≥18 years) from each household Approximately 450,000 completed interviews, as of 2010 |
|
National Health Interview Survey (NHIS) http://www.cdc.gov/nchs/nhis.htm National Center for Health Statistics |
NHIS is a national survey on the health of the civilian noninstitutionalized U.S. population. The main objective of NHIS is to monitor the health of the U.S. population through the collection and analysis of data on a broad range of health topics. |
In-person household interviews |
Health status and limitations Health-care use Family resources Health insurance Health-care access Vaccination Injury Health behaviors Functioning Disability |
Activity limitations from physical, mental, or emotional problems External causes and circumstances of injury Mental health-care use Mental health conditions and symptoms (in 2007 survey), including ADHD; schizophrenia; bipolar disorder; depression, anxiety, and emotional problems; dementia and senility; mental retardation; learning disabilities; and general distress symptoms Health-risk behaviors (including tobacco use and alcohol use) K-6 measure of serious psychological distress |
Approximately 40,000 households per year, as of 2010 Oversample of blacks, Hispanics, Asians, and adults aged ≥65 years |
|
National Health and Nutrition Examination Survey (NHANES) http://www.cdc.gov/nchs/nhanes.htm National Center for Health Statistics |
NHANES is designed to assess the health and nutritional status of adults and children in the United States. The survey combines interviews and physical examinations. |
In-person household interviews Physical examinations Laboratory tests Nutritional assessments DNA repository |
Numerous diseases, medical conditions, and health indicators Nutrition and nutritional disorders Environmental risk factors Health-care use Mental, behavioral, and emotional problems of children Weight and physical fitness Risk factors |
Sleep disorders Alcohol and drug use Social and emotional support Use of mental health-care professionals Activity limitations from poor physical or mental health PHQ-9 depression screening |
Approximately 5,000 persons per year, as of 2008 Oversample of blacks, Mexican-Americans, adolescents, and adults aged ≥60 years |
|
Pregnancy Risk Assessment Monitoring System (PRAMS) National Center for Chronic Disease Prevention and Health Promotion, Division of Reproductive Health |
PRAMS is a surveillance project of CDC and state health departments. PRAMS collects state-specific, population-based data on maternal attitudes and experiences before, during, and shortly after pregnancy. |
Mailed surveys with follow-up telephone interviews for nonresponders |
Postpartum depressive symptoms Attitudes and feelings about most recent pregnancy Prenatal care Maternal alcohol and tobacco use HIV testing Health insurance coverage Physical abuse before and during pregnancy Pregnancy-related morbidity Infant health care Contraceptive use Breastfeeding practices Health-care provider advice |
Whether health-care provider discussed with respondent healthy and risky pregnancy behaviors (including drinking alcohol and smoking during pregnancy) Maternal tobacco and alcohol use before, during, and after pregnancy Difficult or traumatic events before or during pregnancy Pregnancy intention, both of mother and of partner Whether respondent needed and received counseling for substance use or personal problems during or after pregnancy Interpersonal violence before and during pregnancy Injury control and prevention Social support and stress Infant sleeping behaviors Infant and maternal exposure to smoke Feelings, diagnosis, and treatment of postpartum depression, hopelessness, and anxiety |
Approximately 50,000 women with live-born infants per year, as of 2008 |
|
National Ambulatory Medical Care Survey (NAMCS) http://www.cdc.gov/nchs/ahcd.htm National Center for Health Statistics |
NAMCS is a national survey that collects data on the provision and use of ambulatory medical care services in the United States. Findings are based on a sample of visits to nonfederal, employed, office-based physicians who are primarily engaged in direct patient care. |
Patient record forms completed by physicians and staff members or survey field representatives |
Demographic characteristics of patients Expected payment sources Patients' principal complaints, symptoms, or other reasons for visit Physician diagnoses, diagnostic and screening services Medications Types of health-care providers seen during visit Disposition Causes of injury (if applicable) |
Current diagnosed mental health conditions Current depression Cause of injury (including intentional) Health education services ordered or provided at visit (including injury prevention, stress management, and tobacco use and exposure) Nonmedication treatment provided at visit (including psychotherapy and mental health counseling) Type of health-care providers patient visited or was referred to during visit (including providers of mental health services) Medications |
Office-based physicians and then visits within the practices. In 2007, data were provided on 32,778 visits. |
|
National Hospital Ambulatory Medical Care Survey (NHAMCS) http://www.cdc.gov/nchs/ahcd.htm National Center for Health Statistics |
NHAMCS is designed to collect data on the use and provision of ambulatory care services in hospital emergency and outpatient departments. Findings are based on a national sample of visits to the emergency departments and outpatient departments of noninstitutional general and short-stay hospitals. |
Patient record forms completed by hospital physicians and staff members |
Demographic characteristics of patients Expected payment sources Patients' principal complaints, symptoms, or other reasons for visit Physician diagnoses, diagnostic and screening services Procedures (emergency department only) Medications Disposition Types of health- care providers seen during visit Causes of injury (if applicable) |
Emergency department: Patients' principal complaints, symptoms, or other reasons for visit Causes of injury (including intentional) Health-care provider diagnoses Medications Mental health providers seen during visit Transfer to psychiatric hospital Admission to mental health or detoxification unit Outpatient department: Current diagnosed mental health conditions Current depression Cause of injury (including intentional) Health education services ordered or provided at visit (including injury prevention, stress management, and tobacco use and exposure) Nonmedication treatment provided at visit (including psychotherapy and mental health counseling) Type of health-care providers patient visited or was referred to during visit (including providers of mental health services) Medications |
Nationally representative sample of 500 nonfederal short-stay (<30 days) hospitals |
|
National Hospital Discharge Survey (NHDS) http://www.cdc.gov/nchs/nhds.htm National Center for Health Statistics |
NHDS is a national probability survey of characteristics of inpatients discharged from nonfederal short-stay hospitals in the United States. |
Medical record abstraction |
Demographic characteristics of patients Expected sources of payment Type and source of admission Disposition Discharge diagnoses (up to seven) Surgical and diagnostic procedures (up to four) |
Discharge diagnoses (up to seven) Surgical and diagnostic procedures (up to four) |
Nationally representative sample of nonfederal short-stay hospitals and systematic samples of discharges within hospitals |
|
National Nursing Home Survey (NNHS) http://www.cdc.gov/nchs/nnhs.htm National Center for Health Statistics |
NNHS is a continuing series of national sample surveys of nursing homes and their residents and staff members. |
Interviews with staff member best acquainted with resident medical records |
Demographic characteristics of patients Admitting diagnosis Current diagnoses (up to 16) Health status Activities of daily living Vision and hearing Continence Pain assessment Behavior Mood Medications Falls Services received Sources of payment |
Behavioral problems Depressed mood Medications Admitting diagnosis Current diagnoses (up to 16) Current assignment to specialty unit (i.e., dementia or behavioral health) Decision-making ability |
Sample of nursing homes (that had at least three beds and were either certified by Medicare or Medicaid or had a state license to operate as a nursing home) and then sample of residents within nursing homes |
|
Abbreviations: ADHD = attention deficit hyperactivity disorder; HIV = human immunodeficiency virus; K-6 = Kessler-6; PHQ-8 = Patient Health Questionnaire-8; PHQ-9 = Patient Health Questionnaire-9. |
|||||
|
TABLE 17. Annual average number and rate of ambulatory care visits* for mental health disorders among adults aged ≥18 years, by diagnosis and medical setting --- National Ambulatory Medical Care Survey (NAMCS) and National Hospital Ambulatory Medical Care Survey (NHAMCS), United States, 2007--2008 |
|||||||||||
|---|---|---|---|---|---|---|---|---|---|---|---|
|
Primary diagnosis group† |
ICD-9-CM codes |
No. visits (in thousands) |
(SE) |
Rate of visits§ |
(SE) |
Medical setting |
|||||
|
Physician office (NAMCS) |
OPD (NHAMCS) |
ED (NHAMCS) |
|||||||||
|
% |
(SE) |
% |
(SE) |
% |
(SE) |
||||||
|
All diagnoses |
961,646 |
(28,861) |
42,982 |
(1,290) |
82.3 |
(0.9) |
8.0 |
(0.7) |
9.7 |
(0.4) |
|
|
Mental health disorders |
290--319 |
47,835 |
(2,534) |
2,138 |
(113) |
80.7 |
(1.6) |
11.8 |
(1.5) |
7.5 |
(0.5) |
|
Schizophrenic disorders |
295 |
2,730 |
(507) |
122 |
(23) |
79.4 |
(4.5) |
13.4 |
(3.3) |
7.2 |
(1.6) |
|
Major depressive disorder |
296.2--296.3 |
7,530 |
(793) |
337 |
(35) |
85.0 |
(2.7) |
13.6 |
(2.6) |
1.4 |
(0.3) |
|
Other psychoses |
290--294, 296.0--296.1, 296.4--299 |
8,451 |
(584) |
378 |
(26) |
80.8 |
(2.0) |
11.0 |
(1. 8) |
8.3 |
(0.8) |
|
Anxiety states |
300.0 |
6,679 |
(544) |
299 |
(24) |
84.7 |
(1.5) |
7.0 |
(1.1) |
8.3 |
(0.9) |
|
Neurotic depression |
300.4 |
3,231 |
(323) |
144 |
(14) |
89.6 |
(1.7) |
8.4 |
(1.6) |
2.0 |
(0.5) |
|
Alcohol dependence syndrome |
303 |
653 |
(116) |
29 |
(5) |
---¶ |
(7.4) |
38.7 |
(7.2) |
23.5 |
(4.8) |
|
Drug dependence and nondependent use of drugs |
304--305 |
3,164 |
(459) |
141 |
(21) |
40.3 |
(6.5) |
29.8 |
(7.4) |
29.9 |
(4.5) |
|
Acute reaction to stress and adjustment reaction |
308--309 |
2,778 |
(308) |
124 |
(14) |
81.8 |
(3.2) |
14.5 |
(3.1) |
3.7 |
(0.7) |
|
Depressive disorder, not elsewhere classified |
311 |
7,299 |
(622) |
326 |
(28) |
85.8 |
(1.7) |
7.9 |
(1.3) |
6.4 |
(0.8) |
|
Attention deficit disorder |
314.0 |
1,736 |
(242) |
78 |
(11) |
94.6 |
(1.4) |
5.4 |
(1.4) |
--- |
(0.0) |
|
Other mental disorders |
300.1--300.3, 300.5--300.9, 301--302, 306--307, 310, 312--313, 314.1--319 |
3,585 |
(494) |
160 |
(22) |
83.1 |
(2.7) |
8.5 |
(1.7) |
8.4 |
(1.5) |
|
Abbreviations: ED = emergency department; ICD-9-CM = International Classification of Diseases, Ninth Revision, Clinical Modification; OPD = outpatient department; SE = standard error. * Visits to physician offices and hospital outpatient and emergency departments. † Primary diagnosis groups are based on a reclassification of codes. § Rate per 10,000 persons, based on U.S. Census Bureau estimates of the civilian noninstitutionalized adult population as of July 1, 2007, and July 1, 2008. Additional information on calculation of rates available at http://www.cdc.gov/nchs/ahcd.htm. ¶ Number does not meet standards of reliability or precision. |
|||||||||||
Use of trade names and commercial sources is for identification only and does not imply endorsement by the U.S. Department of Health and Human Services. |
All MMWR HTML versions of articles are electronic conversions from typeset documents. This conversion might result in character translation or format errors in the HTML version. Users are referred to the electronic PDF version (http://www.cdc.gov/mmwr)
and/or the original MMWR paper copy for printable versions of official text, figures, and tables. An original paper copy of this issue can be obtained from the Superintendent of Documents, U.S. Government Printing Office (GPO), Washington, DC 20402-9371;
telephone: (202) 512-1800. Contact GPO for current prices.
**Questions or messages regarding errors in formatting should be addressed to mmwrq@cdc.gov.
