Persons using assistive technology might not be able to fully access information in this file. For assistance, please send e-mail to: mmwrq@cdc.gov. Type 508 Accommodation and the title of the report in the subject line of e-mail.
Outbreaks of Acute Gastroenteritis Transmitted by Person-to-Person Contact — United States, 2009–2010
Mary E. Wikswo, MPH
Aron J. Hall, DVM
Division of Viral Diseases, National Center for Immunization and Respiratory Diseases, CDC
Corresponding author: Mary Wikswo, Division of Viral Diseases, National Center for Immunization and Respiratory Diseases, CDC, 1600 Clifton Rd., NE, MS A-34, Atlanta, GA 30333. Telephone: 404-639-0881; Fax: 404-235-7861; E-mail: ezq1@cdc.gov.
Abstract
Problem/Condition: Approximately 179 million cases of acute gastroenteritis (AGE) occur in the United States each year, and outbreaks of AGE are a substantial public health problem. Although CDC has conducted national surveillance for waterborne and foodborne AGE outbreaks since 1971 and 1973, respectively, no national surveillance existed for AGE outbreaks resulting primarily from person-to-person transmission before implementation of the National Outbreak Reporting System (NORS) in 2009.
Reporting Period: 2009–2010.
Description of System: NORS is a national surveillance system launched in 2009 to support the reporting of all waterborne outbreaks and enteric disease outbreaks from foodborne, person-to-person, animal contact, environmental, and unknown modes of transmission. State and local public health agencies in the 50 U.S. states, the District of Columbia, five U.S. territories, and three Freely Associated States report these outbreaks to CDC via NORS using a standardized online data entry system. Data are collected on general outbreak characteristics (e.g., dates, number of illnesses, and locations), demographic characteristics of cases (e.g., age and sex), symptoms, case outcomes, and laboratory testing information and results. Only outbreaks reported in NORS with a primary mode of transmission of person-to-person contact are included in this report.
Results: During 2009–2010, a total of 2,259 person-to-person AGE outbreaks were reported in NORS from 42 states and the District of Columbia. These outbreaks resulted in 81,491 reported illnesses, 1,339 hospitalizations, and 136 deaths. No etiology was reported in approximately 40% (n = 840) of outbreaks. Of the remaining 1,419 outbreaks with a reported etiology, 1,270 (89%) were either suspected or confirmed to be caused solely by norovirus. Other reported etiologies included Shigella (n = 86), Salmonella (n = 16), Shiga toxin-producing Escherichia coli (STEC) (n = 11), and rotavirus (n = 10). Most (82%) of the 1,723 outbreaks caused by norovirus or an unknown etiology occurred during the winter months, and outbreaks caused by Shigella or another suspected or confirmed etiology most often occurred during the spring or summer months (62%, N = 53 and 60%, N = 38, respectively). A setting was reported for 1,187 (53%) of total outbreaks. Among these reported settings, nursing homes and other long-term–care facilities were most common (80%), followed by childcare centers (6%), hospitals (5%), and schools (5%).
Interpretation: NORS provides the first national data on AGE outbreaks spread primarily through person-to-person transmission and describes the frequency of this mode of transmission. Norovirus is the most commonly reported cause of these outbreaks and, on the basis of epidemiologic characteristics, likely accounts for a substantial portion of the reported outbreaks of unknown etiology. In the United States, sporadic and outbreak-associated norovirus causes an estimated 800 deaths and 70,000 hospitalizations annually, which could increase by an additional 50% during epidemic years. During 2009–2010, norovirus outbreaks accounted for the majority of deaths and health-care visits in person-to-person AGE outbreaks reported to NORS.
Public Health Action: Prevention and control of person-to-person AGE outbreaks depend primarily on appropriate hand hygiene and isolation of ill persons. NORS surveillance data can help identify the etiologic agents, settings, and populations most often involved in AGE outbreaks resulting primarily from person-to-person transmission and guide development of targeted interventions to avert these outbreaks or mitigate the spread of infection. Surveillance for person-to-person AGE outbreaks via NORS also might be important in clarifying the epidemiology and role of certain pathogens (e.g., STEC) that have been traditionally considered foodborne but can also be transmitted person-to-person. As ongoing improvements and enhancements to NORS are introduced, participation in NORS has the potential to increase, allowing for improved estimation of epidemic person-to-person AGE and its relative importance among other modes of transmission.
Introduction
Acute gastroenteritis (AGE) is a major cause of illness in the United States, with approximately 179 million episodes occurring each year (1,2). Outbreaks of AGE contribute to this substantial public health problem. Data on waterborne and foodborne AGE outbreaks have been collected nationally by various methods since the 1920s (3,4). These methods were formalized in 1971 and 1973 when the Waterborne Disease and Outbreak Surveillance System (WBDOSS) and the Foodborne Disease Outbreak Surveillance System (FDOSS), respectively, were created as national surveillance systems to provide complete and accurate data for waterborne and foodborne disease outbreaks. However, no national system existed for reporting AGE outbreaks caused by direct person-to-person contact or other modes of transmission.
In 2006, the Council for State and Territorial Epidemiologists passed a resolution recommending that all outbreaks of AGE in the United States be nationally reported. The National Outbreak Reporting System (NORS) addresses this resolution by integrating WBDOSS and FDOSS with the first national reporting system for person-to-person AGE outbreaks, as well as AGE outbreaks caused by contact with animals or contaminated environments or by unknown modes of transmission.
The information collected through NORS can help guide the development of appropriate strategies to prevent and control AGE outbreaks resulting primarily from person-to-person transmission. This information is vital to improving understanding of these outbreaks, their frequency, and population-level risk factors for severe illness and death. To characterize the frequency and characteristics of person-to-person AGE outbreaks, CDC analyzed 2009–2010 data (the inaugural years that data were available) from NORS. This report summarizes those findings and is intended to be used by health departments and regulatory agencies to identify settings and populations for interventions likely to yield the greatest public health benefits.
Methods
Data Source
NORS is a voluntary national surveillance system designed to support the reporting of all waterborne outbreaks and enteric disease outbreaks from foodborne, person-to-person, animal contact, environmental, and unknown modes of transmission. State and local public health agencies in the United States and its territories report these outbreaks to CDC via NORS using a standard online data entry system. The NORS web-based data entry system was launched in February 2009 to all 59 NORS reporting sites comprised of the 50 U.S. states, the District of Columbia, five U.S. territories (American Samoa, Guam, the Commonwealth of the Northern Mariana Islands, Puerto Rico, and the U.S. Virgin Islands), and three Freely Associated States (the Federated States of Micronesia, the Republic of the Marshall Islands, and the Republic of Palau). Sites were encouraged to report outbreaks occurring since January 1, 2009, as well as those occurring prospectively.
Case Definition and Classification
All cases included in each NORS report were assumed to have met the case definition used for that outbreak investigation. For this analysis, the etiology of the outbreaks were categorized as norovirus, Shigella, other/multiple, and unknown on the basis of state reports. The term "no etiology reported" also is sometimes referred to as an "unknown etiology." The term "any etiology" refers to all reported outbreaks, including those with no etiology reported. NORS allows reporting sites to edit, add, or delete reports at any time. To reduce this fluidity in the data, only reports marked as "finalized" by the reporting site administrators were included in the analyses. Data also are subjected to basic logic checks at the conclusion of each calendar year to improve data quality.
An outbreak from person-to-person transmission is defined as ≥2 cases of a similar enteric illness associated with a common exposure in which the primary mode of transmission is reported as person-to-person contact, as determined by each reporting site. The source or index case of each outbreak, defined as the patient with the earliest illness onset, is included among the outbreak-associated cases. Case definitions or classification schemes might not be consistent across all sites. The date of earliest illness onset is defined in NORS as the date of outbreak occurrence. Data are reported on general outbreak characteristics (e.g., dates, number of illnesses, and locations), general demographic characteristics of cases (e.g., age and sex), symptoms, case outcomes, and laboratory testing information and results. A reported etiology was considered "confirmed" if ≥2 laboratory-confirmed cases were reported, consistent with CDC guidelines for confirmation of etiologies in foodborne disease outbreaks (5). If a reported etiology was associated with <2 laboratory-confirmed cases, it was classified as a suspected etiology. Symptoms were classified and reported in NORS according to the definitions used during each outbreak investigation.
To calculate attack rates in certain settings in which exposure occurred, states were asked to classify cases into two groups: residents and guests or staff. The former group is intended to capture the number of persons who did not work in the major setting of exposure, such as children attending childcare centers, residents of a long-term–care facility (LTCF), or guests of a hotel. The latter group is intended to capture the number of persons who work in the major setting, such as health-care providers, teachers, childcare center employees, and hotel staff.
The following outbreak reports were excluded from analysis: all outbreak reports in which the total number of cases was not entered, the total number of cases was <2, the reported etiology does not cause AGE (e.g., measles, scabies, or Hepatitis A), and outbreaks with a different primary mode of transmission (e.g., foodborne) with secondary person-to-person transmission.
Analysis
Person-to-person AGE outbreaks with a first illness onset during January 2009–December 2010, reported in NORS, marked as finalized by a state administrator, and meeting the inclusion criteria as stated in the methods are included in this summary. Data were extracted from NORS on January 24, 2012. Outbreak incidence in each reporting site was calculated using national data from the U.S. Census Bureau for 2009 for each state and expressed per 1 million population per year (6). If a state reported outbreaks in both 2009 and 2010, the average number of outbreaks over the 2 years was used to calculate the incidence per 1 million population per year. If a state only reported outbreaks for 1 year, the incidence per 1 million population for that single year was used.
During 2009–2010, NORS only allowed reporting of the percentage of the number of cases in each age and sex category. An age group category "unknown" is included in the analysis because states were allowed to enter the percentage of cases that were of unknown age as part of the total. Only outbreaks with complete information were included in each analysis; reports in which the total age or sex percentages were not entered or did not add to 100% (+/- 2% to account for rounding errors) were excluded from that analysis.
Comparisons of symptoms and case outcomes by etiology were performed using Pearson's chi square test. Comparisons of the mean number of cases reported in outbreaks from different etiologies were performed between each pair of etiologies using the Tukey method in conjunction with one-way analysis of variance. Comparisons of median attack rates among the different etiologies were performed using the Kolmogorov-Smirnov test, and comparisons of the staff and guest/resident group were performed using the signed rank test. All analyses were performed using SAS v 9.2 (SAS Institute, Inc.; Cary, North Carolina). Significance was determined by p<0.05 for all analyses.
Results
Reporting Sites
As of January 24, 2012, a total of 2,340 enteric person-to-person outbreaks occurring during 2009–2010 were reported to CDC through NORS. Of these, 2,259 outbreak reports were marked finalized by a state administrator and met the inclusion criteria (972 for 2009 and 1,287 for 2010). These outbreaks were reported in 43 reporting sites representing 42 states and the District of Columbia. Eight states (Delaware, Georgia, Illinois, Indiana, Montana, Nebraska, New York, and Oklahoma), five U.S. territories (American Samoa, Guam, the Commonwealth of the Northern Mariana Islands, Puerto Rico, and the U.S. Virgin Islands), and three Freely Associated States (the Federated States of Micronesia, the Republic of the Marshall Islands, and the Republic of Palau) reported no person-to-person AGE outbreaks occurring during 2009–2010 that met the inclusion criteria. Several of these sites, primarily the territories (excluding Puerto Rico) and Freely Associated States, have not reported any outbreaks in NORS or reported only one or two outbreaks of any type during 2009–2010. Puerto Rico and the eight U.S. states have regularly reported foodborne and waterborne outbreaks in NORS but have not reported any or have only reported very few outbreaks from person-to-person transmission.
Of the 43 reporting sites with at least one finalized person-to-person AGE outbreak report, 36 either began entering data in early 2009 (during the launch period) or reported these outbreaks retrospectively (Figure 1). Of the 36 states reporting outbreaks occurring in 2009, five did not enter reports for outbreaks occurring before July 2009. Forty-one states reported at least one outbreak occurring in 2010. Of the 43 sites that reported at least one outbreak occurring during 2009–2010, a total of 16 sites reported <10 outbreaks each, 18 reported 10–99 outbreaks each, and nine reported >100 outbreaks each (range: 1–276 outbreaks per site). Across all sites, the median outbreak incidence was 4.7 per million population per year (mean: 7.9; range: 0.03–41.9) (Figure 2).
Etiologies
Of the 2,259 person-to-person AGE outbreaks, 840 (37%) had an unknown etiology, 1,410 (62%) had a single suspected or confirmed etiology, and nine (<1%) had multiple etiologies (Figure 3). Norovirus was the only suspected or confirmed etiology reported in 1,270 (56%) outbreaks. Shigella was the second most commonly reported etiology, although it accounted for only 86 (4%) of all reported outbreaks. Other single-etiology outbreaks were suspected or confirmed to be caused by Salmonella (n = 16), rotavirus (n = 10), Shiga toxin-producing E. coli (STEC) (n = 11), Giardia lamblia (n = 5), Cryptosporidium spp. (n = 9), Clostridium difficile (n = 4), sapovirus (n = 2), and Campylobacter jejuni (n = 1). Nine outbreaks had multiple etiologies: norovirus and Clostridium spp. (n = 5), norovirus and rotavirus (n = 1), Salmonella enterica and STEC (n = 1), norovirus and Bacillus sp. (n = 1), and norovirus, rotavirus, and Clostridium difficile (n = 1).
Of the 1,419 outbreaks with at least one reported etiology, 1,016 (72%) reported at least one laboratory confirmed etiology and 403 (28%) outbreaks reported only a suspected etiology. Of the 1,016 outbreaks with at least one laboratory confirmed etiology, 886 (87%) reported norovirus as the only confirmed etiology, and 80 (8%) listed Shigella spp. (Figure 4). Other laboratory confirmed single-etiology outbreaks were caused by Salmonella enterica (n = 16), STEC (n = 9), rotavirus (n = 7), Giardia lamblia (n = 4), Cryptosporidium spp. (n = 4), Clostridium difficile (n = 3), sapovirus (n = 2), and Campylobacter jejuni (n = 1). Four outbreak reports listed ≥2 confirmed etiologies: norovirus and Clostridium difficile (n = 2), norovirus and Bacillus sp. (n = 1), and norovirus, rotavirus, and Clostridium difficile (n = 1).
Seasonality
Most (79%) of the 2,259 outbreaks occurred during winter months (Figure 5). This pattern is attributed to the substantial number of suspected and confirmed norovirus outbreaks, which exhibit strong winter seasonality. An estimated 83% of norovirus outbreaks occurred during October–March. Approximately 80% of outbreaks of unknown etiology also occurred during the winter season. In contrast, outbreaks caused by suspected or confirmed Shigella were relatively more frequent during summer months, although an insufficient number of these outbreaks existed to determine a consistent seasonal pattern. Only 38% of Shigella and 40% of other or multiple etiology outbreaks occurred during October–March.
Outbreak-Associated Cases
In the 2,259 person-to-person AGE outbreaks reported in NORS, 81,491 cases were identified, with a mean of 36 cases per outbreak (median: 26; range: 2–394) (Table 1). The mean number of cases per outbreak was significantly higher for suspected or confirmed norovirus outbreaks (44 cases) than for outbreaks caused by Shigella (15 cases), multiple or other etiology (22 cases), or an unknown etiology (27 cases). Outbreaks suspected or confirmed to be caused by Shigella had a significantly lower mean number of cases per outbreak (15 cases) than that of outbreaks caused by an unknown etiology (27 cases).
Of the 1,038 outbreak reports of any etiology with complete information on distribution of cases by sex, 69% of cases occurred in females (Figure 6). Of the 627 outbreaks with a suspected or confirmed etiology of norovirus, 71% of cases occurred among females. Cases reported in outbreaks suspected or confirmed to be caused by Shigella were as likely to occur among males as females. In outbreaks with another etiology or unknown etiology, 66% of cases were in females, following a similar pattern to those associated with norovirus outbreaks.
Of the 936 outbreak reports containing information on age group distribution of cases, most cases (54%) occurred among those aged >49 years. This pattern can be largely explained by the substantial number of suspected and confirmed norovirus outbreaks (N = 550), in which 58% of cases occurred among those aged >49 years (Figure 7). Conversely, 76% of cases in suspected or confirmed Shigella outbreaks occurred in children aged <10 years. In outbreaks caused by another or unknown etiology, 43% and 52% of cases, respectively, occurred in persons aged >49 years, similar to those associated with norovirus outbreaks. However, these outbreaks also involved relatively larger proportions (26% and 18%, respectively) of children aged <10 years than norovirus outbreaks (5%).
Settings
The age distribution of cases by etiology largely relate to the settings in which these outbreaks occurred. Overall, of the 1,187 person-to-person AGE outbreak reports containing information on setting, most were commonly identified in LTCFs, schools, childcare centers, and hospitals (Table 2). Outbreaks caused by norovirus or an unknown etiology occurred most frequently in LTCFs (86% and 77%, respectively); thus, most cases occurred in older adults. Outbreaks caused by Shigella occurred almost exclusively (97%) in childcare centers; thus, the majority of cases were reported in children aged <10 years. Other settings reported included other health-care facilities (n = 26), camp (eight), private settings (seven), prison or detention facilities (three), restaurants (three), athletic facilities (three), youth centers (two), hotels (two), adult day care facility (one), a harbor (one), and communitywide (e.g., not limited to a single setting) (one).
Symptoms and Clinical Outcomes
Information on the proportion of cases reported with at least one symptom was available for 1,156 (51%) outbreaks, although not all cases or all outbreaks provided information on each of the four symptoms analyzed in this report (Figure 8). Among cases for which information was available, diarrhea and vomiting were the most common symptoms reported (80% of 39,055 cases and 65% of 37,464 cases, respectively). Outbreaks caused by norovirus or unknown etiology involved vomiting in a significantly higher percentage of cases (65% and 68%, respectively) than in outbreaks caused by any other suspected or confirmed etiology (43% of cases). Fever and bloody stools were each reported significantly more often in outbreaks caused by Shigella (32%), multiple, or other etiologies (15%) than with outbreaks caused by norovirus or an unknown etiology (1% and 2%, respectively).
During 2009–2010, a total of 136 deaths were reported among 1,670 outbreaks with information on death, and 1,339 hospitalizations were reported among 1,576 outbreaks with information on hospitalizations. Of the 94 outbreak reports with an associated death, 61 outbreaks occurred in an LTCF, three in a hospital or other health-care setting, and one in a childcare center; setting was not reported for 29 outbreaks. In 80 (85%) of these 94 outbreak reports, which accounted for 118 (87%) deaths, norovirus was identified as the only suspected or confirmed etiology. Cryptosporidium sp. and E. coli O157:H7 were the confirmed etiology in one outbreak each, and each was associated with one reported death. A total of 16 reported deaths occurred in 12 outbreaks for which an etiology was not reported.
Patients reported in outbreaks caused by Shigella were significantly more likely to seek health care (i.e., outpatient health-care provider visits, emergency department visits, and hospitalizations combined) than cases associated with norovirus outbreaks (odds ratio: 10.2; 95% confidence interval = 9.3–11.2); however, norovirus outbreaks contributed to the largest number of deaths and health-care visits (Table 3).
Attack Rates
Unique to person-to-person AGE outbreak surveillance, data are collected on the total number of persons exposed, categorized as either guests and residents or staff, thereby allowing for calculation of attack rates. The median attack rate for guests and residents was significantly higher in suspected or confirmed norovirus outbreaks (35%) than in Shigella outbreaks (12%) (Table 4). Likewise, the median attack rate for guests and residents in outbreaks of unknown etiology (21%) also was significantly higher than in Shigella outbreaks. The median staff attack rate in norovirus outbreaks (19%) was significantly higher than the median staff attack rate in Shigella outbreaks (8%). For each outbreak etiology, the median attack rates were significantly lower among staff than among guests and residents.
Discussion
NORS is a novel reporting system that provides the first national data on AGE outbreaks spread through person-to-person transmission, highlighting the frequency of these outbreaks. During 2009–2010, a total of 2,259 person-to-person AGE outbreaks and 81,491 outbreak-related illnesses were reported to CDC via NORS from 43 reporting sites. The actual frequency of these outbreaks is likely underestimated, as evidenced by the inconsistent levels of reporting in NORS of outbreaks from different modes of transmission. In 2009, a total of 972 person-to-person AGE outbreaks and 33,085 illnesses were reported in NORS by only 36 sites. In comparison, during the same year, 668 foodborne outbreaks and 13,497 illnesses were reported by 45 sites (7). This further illustrates that person-to-person transmission is an important cause of AGE outbreaks in the United States, although surveillance for these outbreaks has only recently been prioritized and has not yet been fully implemented in all states.
Norovirus was the most frequently reported cause of person-to-person AGE outbreaks. It was reported as the only suspected or confirmed etiology in 56% of all person-to-person AGE outbreaks and in 89% of outbreaks with an etiology reported. These data are consistent with other studies indicating that norovirus is the leading cause of AGE outbreaks and that person-to-person transmission is the most common mode of transmission (8–13). Consistent with previous reports (9–16), LTCFs were the most frequent setting of person-to-person norovirus outbreaks (86%) reported in NORS, which might explain, in part, the predominance of cases among females and older adults. The 2004 National Nursing Home Survey indicated that 71% of nursing home patients were female (17), which is a similar proportion of males and females in norovirus outbreaks (86%) reported in NORS. However, among the 936 outbreak reports that include complete information by age, only 58% of cases in norovirus outbreaks occurred among persons aged >50 years. This might be explained, in part, by outbreaks in which not all ages of persons with cases were known; age was unknown in 19% of cases in norovirus outbreaks for which at least some age information was provided for the outbreak report. In addition, information on patient age was reported in fewer than half of all outbreaks reported, possibly introducing some bias. Nursing home outbreaks also included cases among staff members, which might have shifted the age of cases downward relative to the age of the resident populations.
The median attack rates reported for suspected and confirmed person-to-person norovirus outbreaks were significantly higher than those reported for suspected and confirmed Shigella outbreaks. This high norovirus attack rate is consistent with other attack rates calculated for outbreaks in LTCFs and previous reports in the literature (10,13). The lower attack rates among staff might result from several factors including better hand hygiene practices, immunity acquired from more frequent exposures to these pathogens from working in a high-risk setting (18,19), reluctance to report illness (20,21) or, in settings such as LTCFs, staff members who are younger than their residents and therefore less likely to experience symptomatic or severe disease (12,13,16,22–24).
The overall case-hospitalization and case-fatality rates for person-to-person norovirus outbreaks also were consistent with other studies conducted during norovirus outbreaks in LTCFs (10,12–15). Although hospitalizations and deaths represent a relatively small fraction of all person-to-person norovirus outbreak-associated cases (2% and 0.3%, respectively), the high frequency of these outbreaks resulted in 118 reported deaths and 919 hospitalizations during 2009–2010. Norovirus infection often results in a mild, self-limiting illness; however, consequences of norovirus disease in elderly and immunosuppressed populations could be especially severe and have been previously reported to include hospitalization and death (12,13,16,22–24).
Furthermore, other studies have demonstrated that all-cause gastroenteritis-associated hospitalizations and deaths appear to be increasing, which might be attributable at least in part to norovirus. In the United States, sporadic and outbreak-associated norovirus causes an estimated 800 deaths and 70,000 hospitalizations each year. These numbers increase by up to 50% during epidemic years associated with emergent strains (25,26). The highest rates of norovirus-associated hospitalizations occurred among adults aged ≥65 years; within this group, rates increased with advancing age (25). The elderly also accounted for 83% of AGE-associated deaths, of which norovirus was the second leading infectious cause after Clostridium difficile (26). A literature review of norovirus outbreaks during 1993–2011 indicated that hospitalizations and deaths were significantly more likely when outbreaks occurred in health-care settings, including LTCFs (27). The findings in this report affirm that norovirus can account for substantial morbidity and mortality among persons with acute gastrointestinal illness in the United States, particularly among the elderly.
Person-to-person AGE outbreaks of unknown etiology reported through NORS had epidemiologic characteristics consistent with norovirus outbreaks. Norovirus illnesses tend to peak during winter months, and many enteric bacterial illnesses tend to predominate in summer (9,11,25,26,28–30). Both the confirmed and suspected norovirus outbreaks and outbreaks of unknown etiology reported through NORS exhibited a strong winter seasonality, whereas outbreaks caused by other etiologies demonstrated slight peaks during spring and summer months. Norovirus and unknown etiology outbreaks also exhibited similarly high frequencies of diarrhea and vomiting and low frequencies of fever and bloody stools. A high proportion of patients with vomiting (≥50%) and a relatively low proportion with fever are characteristics that have been previously demonstrated as helpful in differentiating norovirus outbreaks from AGE outbreaks caused by other etiologies (31,32). However, bloody stools are more commonly associated with bacterial infections than with norovirus infections (8,33–36). Other characteristics common among norovirus and unknown etiology outbreaks reported through NORS included a higher frequency of cases among older adults and females, a high number of cases in LTCFs, and high attack rates. These findings suggest that many of the outbreaks of unknown etiology might have been caused by norovirus.
Although surveillance for person-to-person AGE outbreaks is predominated by norovirus, other etiologies were identified as important contributors. Shigella was suspected or confirmed to have caused 86 person-to-person AGE outbreaks and 1,305 outbreak-related illnesses reported through NORS during the first 2 years of the system. Similar to norovirus, Shigella has a low infectious dose and is commonly transmitted person-to-person (37–39). However, the profile of Shigella outbreaks was distinct from norovirus and unknown etiology outbreaks, likely in part because of the difference in setting. Almost all (97%) Shigella outbreaks for which setting was reported occurred in a childcare center, thus explaining why approximately 75% of reported outbreak-associated cases occurred among children aged <10 years. Most cases of shigellosis are identified in children aged <5 years, and Shigella is a well-recognized cause of AGE outbreaks in childcare facilities (29,37,40–45). Shigella outbreaks tend to affect more females than males, but outbreaks in young children tend to have an equal distribution of male and female patients, as is reflected in the findings of this report (29,41).
Cases involved in Shigella outbreaks were more likely to include fever and bloody stools than cases in norovirus outbreaks, and substantially more patients in Shigella outbreaks sought health care than those involved in norovirus outbreaks (69% and 10%, respectively). These outbreaks might have even broader implications because transmission to household contacts is common during Shigella outbreaks (44–46), and adults, particularly those aged ≥65, have much higher hospitalization rates for shigellosis than children (37). Furthermore, antibiotics are widely used during shigellosis outbreaks in the United States, yet multidrug resistance is common among Shigella bacteria, limiting antibiotic treatment options (41,43,44).
Some reported etiologies in person-to-person AGE outbreaks, including STEC and Salmonella, are primarily considered foodborne pathogens, and before 2009, national surveillance systematically captured only foodborne outbreaks of these pathogens. In 2009, a total of 119 foodborne outbreaks of Salmonella were reported via NORS; five additional Salmonella outbreaks were reported through person-to-person AGE outbreak surveillance. An estimated 40 foodborne outbreaks of STEC were reported in 2009, and five additional STEC outbreaks were reported as transmitted by person-to-person contact (7). In 2010, six additional STEC person-to-person outbreaks were reported, including one outbreak of STEC O157:H7 in a childcare facility that resulted in a death. Studying these outbreaks is especially important because person-to-person transmission of STEC is a recognized cause of outbreaks in childcare settings, and young children are most at risk for STEC infection and the complication hemolytic uremic syndrome (HUS) (47). Surveillance for person-to-person AGE outbreaks via NORS also might be important in clarifying the epidemiology and role of non-O157 STEC, which has been underrecognized because of limitations in surveillance and diagnostics (48–50).
Limitations
The findings in this report are subject to at least two limitations. First, similar to many other passive reporting systems, NORS is subject to underreporting. NORS ultimately relies on health-care providers and facilities reporting potential outbreaks to state and local health departments, which often depends on the general public seeking medical care. However, only 15%–20% of persons with an acute diarrheal illness seek medical care and only 17%–19% of those submit a stool sample for testing (51,52). This type of underreporting is influenced by behavioral patterns and nuances of the health-care system in the United States. In addition, underreporting to NORS probably occurs because state and local health departments, which often have limited resources and competing responsibilities, might not have the resources available to investigate each potential outbreak or submit a completed report in NORS. Furthermore, NORS is a new reporting system with variable adoption and use, which might vary by modes of illness transmission. For example, Puerto Rico and the eight U.S. states that did not have any NORS reports that met the inclusion criteria for this summary have been regularly reporting foodborne and waterborne outbreaks in NORS but have not reported any or have only reported very few outbreaks from person-to-person transmission. Only 36 sites reported person-to-person AGE outbreak data in 2009, compared with 45 sites that reported foodborne outbreaks during the same year (7). The primary mode of illness transmission also is determined by each reporting site and case definitions or classification schemes might not be consistent across all sites. Notably, the most populous states reported no or disproportionately low numbers of person-to-person AGE outbreaks, suggesting that the number of outbreaks in this report is an underestimate, and the findings reported might not be generalizable. System coverage could improve as sites become more familiar with NORS and as features are enhanced or added to facilitate reporting.
Second, only four variables (outbreak identification, date of first illness, reporting site, and total ill) are required to submit an outbreak report via NORS. Although this affords flexibility to sites that would like to report outbreaks for which they have only limited information available, it results in variable levels of completeness of other variables collected in the system (e.g., age, sex, etiology, and setting).
Conclusion
The findings in this report enable a better understanding of the frequency, causes, and patient outcomes of AGE outbreaks in the United States, especially those caused by person-to-person transmission. During 2009–2010, norovirus was the most frequently reported cause of person-to-person AGE outbreaks. On the basis of epidemiologic characteristics, norovirus also might be responsible for a substantial portion of the 840 reported outbreaks of unknown etiology. An additional 86 outbreaks were reported to be caused by Shigella. No vaccines exist for either norovirus or Shigella in the United States, and recommendations for prevention and control of person-to-person AGE outbreaks depend primarily on appropriate hand hygiene and isolation of ill persons.
Although norovirus and Shigella were associated with the majority of AGE outbreaks, they were not the only reported cause of person-to-person AGE outbreaks. Approximately 3% of outbreaks were caused by other or multiple etiologies, many of which are considered primarily foodborne pathogens but can be transmitted through multiple routes, such as Salmonella and STEC. Further study of these person-to-person AGE outbreaks should provide a better understanding of these pathogens and how they can be spread. Similarly, further examination of outbreaks of unknown etiology could help identify barriers to making an etiologic determination, to analyze clinical and epidemiologic clues suggestive of a probable etiology, and to discover new and emerging etiologic agents.
Acknowledgments
This report is based on contributions by state, territorial, and local health departments reporting this information to CDC. Constructive comments on this report were contributed by Umesh Parashar, Ben Lopman, Anna Bowen, Benjamin Nygren, Katherine Heiman, Barbara Mahon, Benjamin Silk, Rebecca Hall, Hannah Gould, and Jonathan Yoder.
References
- Scallan E, Hoekstra RM, Angulo FJ, et al. Foodborne illness acquired in the United States—major pathogens. Atlanta, GA: US Department of Health and Human Services, CDC; 2011. Available at http://wwwnc.cdc.gov/eid/article/17/1/p1-1101_article.htm. Accessed September 14, 2012.
- Jones TF, McMillian MB, Scallan E, et al. A population-based estimate of the substantial burden of diarrhoeal disease in the United States; FoodNet, 1996–2003. Epidemiol Infect 2007;135:293–301.
- Gorman A, Wolman A. Water-borne outbreaks in the United States and Canada and their significance. J Am Water Works Assoc 1939;31:225–75.
- Public Health Service. Annual report of the surgeon general on the Public Health Service of the United States for the fiscal year 1924–1925. Washington, DC: US Government Printing Office; 1925.
- CDC. Surveillance for foodborne-disease outbreaks—United States, 1998–2002. MMWR 2006;55:1–42.
- U.S. Census Bureau. Population estimates. Washington, DC: US Census Bureau; 2009. Available at http://www.census.gov/popest/data/state/totals/2009/index.html. Accessed September 20, 2012.
- CDC. Foodborne outbreak online database (FOOD). Available at http://wwwn.cdc.gov/foodborneoutbreaks. Accessed September 14, 2012.
- Patel MM, Hall AJ, Vinje J, Parashar UD. Noroviruses: a comprehensive review. J Clin Virol 2009;44:1–8.
- Kroneman A, Verhoef L, Harris J, et al. Analysis of integrated virological and epidemiological reports of norovirus outbreaks collected within the Foodborne Viruses in Europe network from 1 July 2001 to 30 June 2006. J Clin Microbiol 2008;46:2959–65.
- Nguyen LM, Middaugh JP. Suspected transmission of norovirus in eight long-term care facilities attributed to staff working at multiple institutions. Epidemiol Infect 2011;1–8. [Epub ahead of print]
- Yen C, Wikswo ME, Lopman BA, et al. Impact of an emergent norovirus variant in 2009 on norovirus outbreak activity in the United States. Clin Infect Dis 2011;53:568–71.
- CDC. Norovirus activity—United States, 2006–2007. MMWR 2007;56:842–6.
- Rosenthal NA, Lee LE, Vermeulen BA, et al. Epidemiological and genetic characteristics of norovirus outbreaks in long-term care facilities, 2003–2006. Epidemiol Infect Dis 2011;139:286–94.
- Lopman BA, Adak GK, Reacher MH, Brown DW. Two epidemiologic patterns of norovirus outbreaks: surveillance in England and Wales, 1992–2000. Emerg Infect Dis 2003;9:71–7.
- Kirk MD, Fullerton KE, Hall GV, et al. Surveillance for outbreaks of gastroenteritis in long-term care facilities, Australia, 2002–2008. Clin Infect Dis 2010;51:907–14.
- Friesema IH, Vennema H, Heijne JC, et al. Differences in clinical presentation between norovirus genotypes in nursing homes. J Clin Virol 2009;46:341–4.
- Jones AL, Dwyer LL, Bercovitz AR, Strahan GW. The national nursing home survey: 2004 overview. Vital Health Stat 2009;167:1–155.
- Johnson PC, Mathewson JJ, DuPont HL, Greenberg HB. Multiple-challenge study of host susceptibility to Norwalk gastroenteritis in US adults. J Infect Dis 1990;161:18–21.
- Lindesmith L, Moe C, Marionneau S, et al. Human susceptibility and resistance to Norwalk virus infection. Nat Med 2003;9:548–53.
- Boxman IL, Verhoef L, Dijkman R, et al. Year-round prevalence of norovirus in the environment of catering companies without a recently reported outbreak of gastroenteritis. Appl Environ Microbiol 2011;77:2968–74.
- Flemmer M, Oldfield EC, 3rd. The agony and the ecstasy. Am J Gastroenterol 2003;98:2098–9.
- Harris JP, Edmunds WJ, Pebody R, Brown DW, Lopman BA. Deaths from norovirus among the elderly, England and Wales. Emerg Infect Dis 2008;14:1546–52.
- Mattner F, Sohr D, Heim A, et al. Risk groups for clinical complications of norovirus infections: an outbreak investigation. Clin Microbiol Infect 2006;12:69–74.
- van Asten L, Siebenga J, van den Wijngaard C, et al. Unspecified gastroenteritis illness and deaths in the elderly associated with norovirus epidemics. Epidemiology 2011;22:336–43.
- Lopman BA, Hall AJ, Curns AT, Parashar UD. Increasing rates of gastroenteritis hospital discharges in US adults and the contribution of norovirus, 1996–2007. Clin Infect Dis 2011;52:466–74.
- Hall AJ, Curns AT, McDonald LC, Parashar UD, Lopman BA. The roles of Clostridium difficile and norovirus among gastroenteritis-associated deaths in the United States, 1999–2007. Clin Infect Dis 2012;55:216–23.
- Desai R, Hembree CD, Handel A, et al. Severe outcomes are associated with genogroup 2 genotype 4 norovirus outbreaks: a systematic literature review. Clin Infect Dis 2012;55:189–93.
- Hall AJ, Rosenthal M, Gregoricus N, et al. Incidence of acute gastroenteritis and role of norovirus, Georgia, USA, 2004–2005. Emerg Infect Dis 2011;17:1381–8.
- CDC. Shigella surveillance: annual summary, 2006. Atlanta, GA: US Department of Health and Human Services, CDC; 2008.
- Mounts AW, Ando T, Koopmans M, et al. Cold weather seasonality of gastroenteritis associated with Norwalk-like viruses. J Infect Dis 2000;181:S284–7.
- Turcios RM, Widdowson MA, Sulka AC, Mead PS, Glass RI. Reevaluation of epidemiological criteria for identifying outbreaks of acute gastroenteritis due to norovirus: United States, 1998–2000. Clin Infect Dis 2006;42:964–9.
- Kaplan JE, Feldman R, Campbell DS, Lookabaugh C, Gary GW. The frequency of a Norwalk-like pattern of illness in outbreaks of acute gastroenteritis. Am J Public Health 1982;72:1329–32.
- Lopman BA, Reacher MH, Vipond IB, Sarangi J, Brown DW. Clinical manifestation of norovirus gastroenteritis in health care settings. Clin Infect Dis 2004;39:318–24.
- Niyogi SK. Shigellosis. J Microbiol. 2005;43:133–43.
- Rockx B, De Wit M, Vennema H, et al. Natural history of human calicivirus infection: a prospective cohort study. Clin Infect Dis 2002;35:246–53.
- Talan D, Moran GJ, Newdow M, et al. Etiology of bloody diarrhea among patients presenting to United States emergency departments: prevalence of Escherichia coli O157:H7 and other enteropathogens. Clin Infect Dis 2001;32:573–80.
- CDC. Foodborne diseases active surveillance network (FoodNet): FoodNet surveillance report for 2009 (Final Report). Atlanta, Georgia: US Department of Health and Human Services, CDC; 2011.
- DuPont HL, Levine MM, Hornick RB, Formal SB. Inoculum size in shigellosis and implications for expected mode of transmission. J Infect Dis 1989;159:1126–8.
- Mead PS, Slutsker L, Dietz V, et al. Food-related illness and death in the United States. Emerg Infect Dis 1999;5:607–25.
- Gupta A, Polyak CS, Bishop RD, Sobel J, Mintz ED. Laboratory-confirmed shigellosis in the United States, 1989–2002: epidemiologic trends and patterns. Clin Infect Dis 2004;38:1372–7.
- CDC. Outbreaks of multidrug-resistant Shigella sonnei gastroenteritis associated with day care centers—Kansas, Kentucky, and Missouri, 2005. MMWR 2006;55:1068–71.
- Kotloff KL, Winickoff JP, Ivanoff B, et al. Global burden of Shigella infections: implications for vaccine development and implementation of control strategies. Bull World Health Organ 1999;77:651–66.
- Arvelo W, Hinkle CJ, Nguyen TA, et al. Transmission risk factors and treatment of pediatric shigellosis during a large daycare center-associated outbreak of multidrug resistant Shigella sonnei: implications for the management of shigellosis outbreaks among children. Pediatr Infect Dis J 2009;28:976–80.
- Garrett V, Bornschlegel K, Lange D, et al. A recurring outbreak of Shigella sonnei among traditionally observant Jewish children in New York City: the risks of daycare and household transmission. Epidemiol Infect 2006;134:1231–6.
- Pickering LK, Evans DG, DuPont HL, Vollet JJ, 3rd, Evans DJ, Jr. Diarrhea caused by Shigella, rotavirus, and Giardia in day-care centers: prospective study. J Pediatr 1981;99:51–6.
- Haley CC, Ong KL, Hedberg K, et al. Risk factors for sporadic shigellosis, FoodNet 2005. Foodborne Pathog Dis 2010;7:741–7.
- Gould LH, Demma L, Jones TF, et al. Hemolytic uremic syndrome and death in persons with Escherichia coli O157:H7 infection, foodborne diseases active surveillance network sites, 2000–2006. Clin Infect Dis 2009;49:1480–5.
- Brooks JT, Sowers EG, Wells JG, et al. Non-O157 Shiga toxin-producing Escherichia coli infections in the United States, 1983–2002. J Infect Dis 2005;192:1422–9.
- Gould LH, Bopp C, Strockbine N, et al. Recommendations for diagnosis of shiga toxin-producing Escherichia coli infections by clinical laboratories. MMWR 2009;58(No. RR-12).
- Rangel JM, Sparling PH, Crowe C, Griffin PM, Swerdlow DL. Epidemiology of Escherichia coli O157:H7 outbreaks, United States, 1982–2002. Emerg Infect Dis 2005;11:603–9.
- Kendall M, Scallan E, Greene S, et al. Differences by age group in the prevalence of diarrhea and vomiting, rates of seeking health care, and stool sample submission: FoodNet population survey, 1996–2007. International Conference on Emerging Infectious Diseases. Atlanta, GA; 2012.
- Scallan E, Jones TF, Cronquist A, et al. Factors associated with seeking medical care and submitting a stool sample in estimating the burden of foodborne illness. Foodborne Pathog Dis 2006;3:432–8.
FIGURE 1. Date of first reported acute gastroenteritis outbreak transmitted by person-to-person contact, by state — National Outbreak Reporting System, United States, 2009–2010
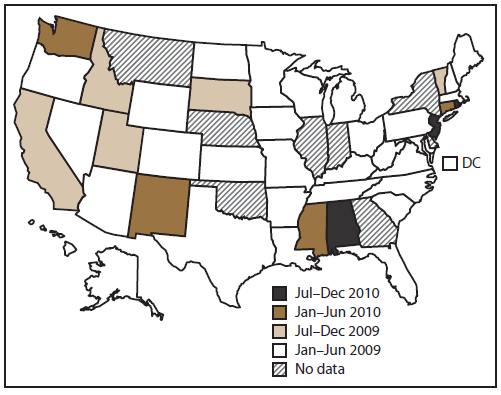
Alternate Text: This figure is a U.S. map that displays the date that an acute gastroenteritis outbreak was first reported in each state for which it applies, from January 2009 to December 2010.
FIGURE 2. Rate* of outbreaks of acute gastroenteritis transmitted by person-to-person contact, by state† — National Outbreak Reporting System, United States, 2009–2010
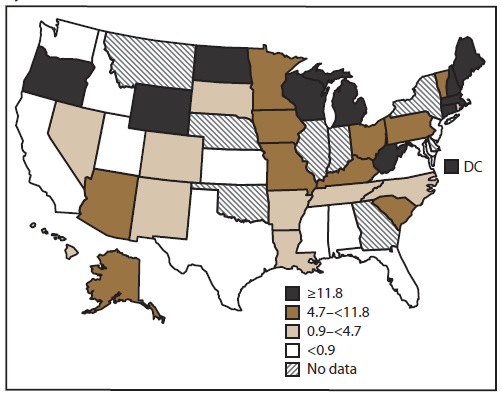
Alternate Text: This figure is a U.S. map that shows the rate (i.e., incidence of outbreaks per state, per million population, on the basis of U.S. Census Bureau estimates) of outbreaks of acute gastroenteritis transmitted by person-to-person contact in each state.
FIGURE 3. Number* and percentage of outbreaks of acute gastroenteritis transmitted by person-to-person contact, by etiology — National Outbreak Reporting System, United States, 2009–2010
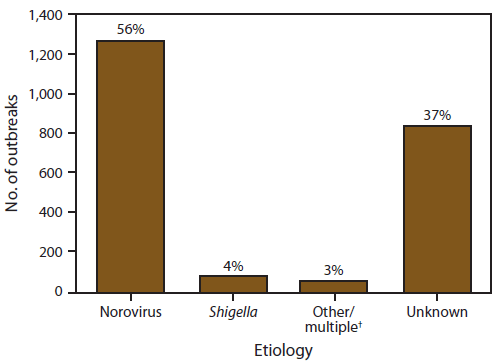
Alternate Text: This figure is a bar graph that presents the number and percentage of outbreaks, by etiology, of acute gastroenteritis transmitted by person-to-person contact.
FIGURE 4. Number* and percentage of outbreaks of acute gastroenteritis transmitted by person-to-person contact, by confirmed etiology — National Outbreak Reporting System, United States, 2009–2010
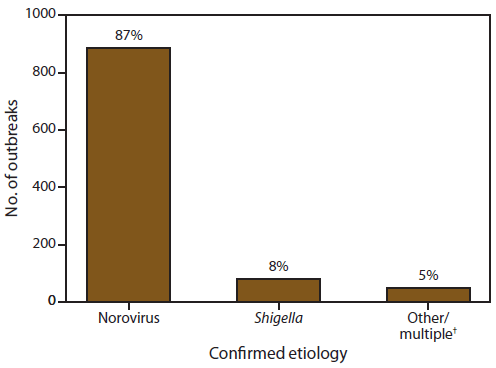
Alternate Text: This figure is a bar graph that presents the number and percentage of confirmed etiologies of acute gastroenteritis transmitted by person-to-person contact.
FIGURE 5. Number* of outbreaks of acute gastroenteritis transmitted by person-to-person contact, by month of first illness onset and etiology — National Outbreak Reporting System, United States, 2009–2010
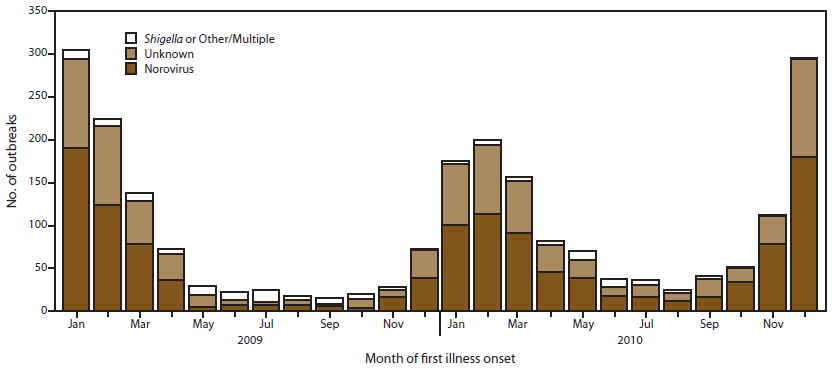
Alternate Text: This figure is a stacked bar graph that presents the number of outbreaks of acute gastroenteritis, by month of first onset of illness and by etiology, for the years 2009-2010.
|
Etiology
|
Total cases
|
No. of outbreaks
|
Mean cases
|
Median cases
|
Range
|
|
Norovirus
|
56,053
|
1,270
|
44
|
33
|
2–357
|
|
Shigella
|
1,305
|
86
|
15
|
7
|
2–105
|
|
Other/multiple
|
1,375
|
63
|
22
|
10
|
2–394
|
|
Unknown
|
22,758
|
840
|
27
|
20
|
2–246
|
|
Any
|
81,491
|
2,259
|
36
|
26
|
2–394
|
FIGURE 6. Percentage* of cases in outbreaks of acute gastroenteritis transmitted by person-to-person contact,† by sex and etiology — National Outbreak Reporting System , United States, 2009–2010
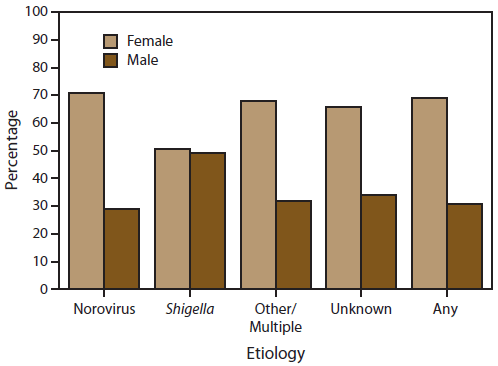
Alternate Text: This figure is a bar graph that presents the percentage of cases in outbreaks of acute gastroenteritis transmitted by person-to-person contact, and is compared by sex and etiology.
FIGURE 7. Percentage* of cases in outbreaks of acute gastroenteritis transmitted by person-to-person contact,† by age group distribution and etiology — National Outbreak Reporting System, United States, 2009–2010
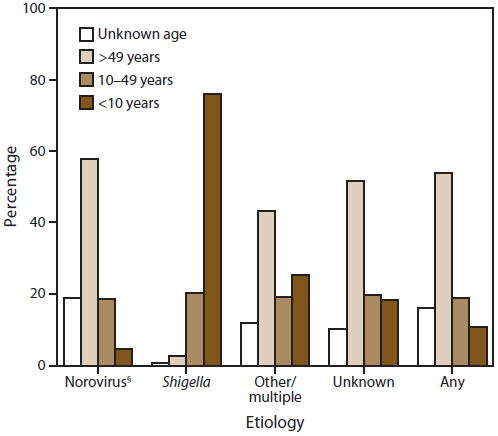
Alternate Text: This figure is a bar graph that presents the percentage of cases in outbreaks of acute gastroenteritis transmitted by person-to-person contact, and is shown comparing age groups and etiologies.
|
Etiology
|
Total outbreaks
|
LTCF
|
Childcare center
|
School
|
Hospital
|
Other*
|
|
No.
|
(%)
|
No.
|
(%)
|
No.
|
(%)
|
No.
|
(%)
|
No.
|
(%)
|
|
Norovirus
|
714
|
617
|
(86)
|
13
|
(2)
|
21
|
(3)
|
32
|
(5)
|
31
|
(4)
|
|
Shigella
|
30
|
0
|
(0)
|
29
|
(97)
|
0
|
(0)
|
0
|
(0)
|
1
|
(3)
|
|
Other/multiple
|
30
|
11
|
(37)
|
10
|
(33)
|
3
|
(10)
|
0
|
(0)
|
6
|
(20)
|
|
Unknown
|
413
|
320
|
(77)
|
15
|
(4)
|
37
|
(9)
|
22
|
(5)
|
19
|
(5)
|
|
Any
|
1,187
|
948
|
(80)
|
67
|
(6)
|
61
|
(5)
|
54
|
(5)
|
57
|
(5)
|
FIGURE 8. Percentage*of outbreaks of acute gastroenteritis transmitted by person-to-person contact, by symptom and etiology — National Outbreak Reporting System, United States, 2009–2010
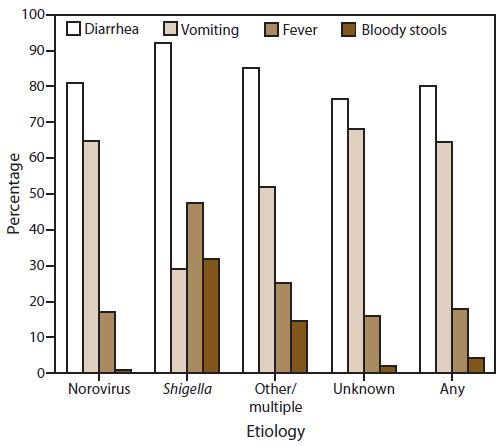
Altenate Text: This figure is a bar graph that presents the percentage of outbreaks of acute gastroenteritis transmitted by person-to-person contact, compared by symptom and etiology, for the years 2009-2010.
|
Etiology
|
Deaths
|
Hospitalized patients
|
Patients who visited the ED
|
Patients who sought health care†
|
|
No.
|
(%)
|
No.
|
(%)
|
No.
|
(%)
|
No.
|
(%)
|
|
Norovirus
|
118
|
(0.3)
|
919
|
(2)
|
373
|
(2)
|
1,639
|
(10)
|
|
Shigella
|
0
|
(0.0)
|
50
|
(6)
|
97
|
(16)
|
551
|
(69)
|
|
Other/multiple
|
2§
|
(0.2)
|
57
|
(4)
|
20
|
(5)
|
116
|
(25)
|
|
Unknown
|
16
|
(0.1)
|
313
|
(2)
|
129
|
(2)
|
369
|
(6)
|
|
Any
|
136
|
(0.2)
|
1,339
|
(2)
|
619
|
(2)
|
2,675
|
(11)
|
|
Etiology
|
Median guest/resident attack rate* %
|
Range (%)
|
Median staff attack rate† %
|
Range (%)
|
p-value§
|
|
Norovirus
|
35
|
(1.0–100)
|
19
|
(0–100)
|
p<0.001
|
|
Shigella
|
12
|
(3–51)
|
8
|
(0–38)
|
0.001
|
|
Other/multiple
|
31
|
(0–78)
|
12
|
(0–75)
|
0.03
|
|
Unknown
|
21
|
(1–100)
|
8
|
(0–100)
|
<0.0001
|
|
Any
|
30
|
(0–100)
|
13
|
(0–100)
|
<0.0001
|
