Persons using assistive technology might not be able to fully access information in this file. For assistance, please send e-mail to: mmwrq@cdc.gov. Type 508 Accommodation and the title of the report in the subject line of e-mail.
Abortion Surveillance — United States, 2009
Karen Pazol, PhD
Andreea A. Creanga, MD, PhD
Suzanne B. Zane, DVM
Kim D. Burley
Denise J. Jamieson, MD
Division of Reproductive Health, National Center for Chronic Disease Prevention and Health Promotion, CDC
Corresponding address: CDC, National Center for Chronic Disease Prevention and Health Promotion, Division of Reproductive Health, 1600 Clifton Rd., NE, MS K-21, Atlanta, GA 30333. E-mail: cdcinfo@cdc.gov.
Abstract
Problem/Condition: Since 1969, CDC has conducted abortion surveillance to document the number and characteristics of women obtaining legal induced abortions in the United States.
Reporting Period Covered: 2009.
Description of System: Each year, CDC requests abortion data from the central health agencies of 52 reporting areas (the 50 states, the District of Columbia, and New York City). The reporting areas provide this information voluntarily. For 2009, data were received from 48 reporting areas. For the purpose of trend analysis, abortion data were evaluated from the 45 areas that reported data every year during 2000–2009. Census and natality data, respectively, were used to calculated abortion rates (number of abortions per 1,000 women) and ratios (number of abortions per 1,000 live births).
Results: A total of 784,507 abortions were reported to CDC for 2009. Of these abortions, 772,630 (98.5%) were from the 45 reporting areas that provided data every year during 2000–2009. Among these same 45 reporting areas, the abortion rate for 2009 was 15.1 abortions per 1,000 women aged 15–44 years, and the abortion ratio was 227 abortions per 1,000 live births. Compared with 2008, the total number and rate of reported abortions for 2009 decreased 5%, representing the largest single year decrease for the entire period of analysis. The abortion ratio decreased 2%. From 2000 to 2009, the total number, rate, and ratio of reported abortions decreased 6%, 7%, and 8%, respectively, to the lowest levels for 2000–2009.
In 2009 and throughout the period of analysis, women in their 20s accounted for the majority of abortions and had the highest abortion rates, whereas women aged ≥30 years accounted for a much smaller percentage of abortions and had lower abortion rates. In 2009, women aged 20–24 and 25–29 years accounted for 32.7% and 24.4% of all abortions, respectively, and had an abortion rate of 27.4 abortions per 1,000 women aged 20–24 years and 20.4 abortions per 1,000 women aged 25–29 years. In contrast, women aged 30–34, 35–39, and ≥40 years accounted for 14.7%, 8.8%, and 3.3% of all abortions, respectively, and had an abortion rate of 13.3 abortions per 1,000 women aged 30–34 years, 7.6 abortions per 1,000 women aged 35–39 years, and 2.7 abortions per 1,000 women aged ≥40 years. Throughout the period of analysis, abortion rates decreased among women aged 20–24 and 25–29 years, whereas they increased among women aged ≥40 years.
In 2009, adolescents aged 15–19 years accounted for 15.5% of all abortions and had an abortion rate of 13.0 abortions per 1,000 adolescents aged 15–19 years. Throughout the period of analysis, the percentage of all abortions accounted for by adolescents and the adolescent abortion rate decreased.
In contrast to the percentage distribution of abortions and abortion rates by age, abortion ratios in 2009 and throughout the entire period of analysis were highest among adolescents and lowest among women aged 30–39 years. Abortion ratios decreased from 2000 to 2009 for women in all age groups except for those aged <15 years, for whom they increased.
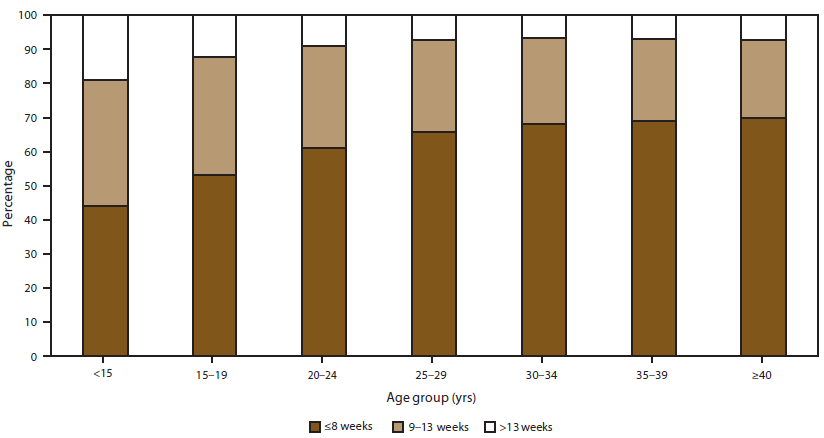
In 2009, most (64.0%) abortions were performed at ≤8 weeks' gestation, and 91.7% were performed at ≤13 weeks' gestation. Few abortions (7.0%) were performed at 14–20 weeks' gestation, and even fewer (1.3%) were performed at ≥21 weeks' gestation. From 2000 to 2009, the percentage of all abortions performed at ≤8 weeks' gestation increased 12%, whereas the percentage performed at >13 weeks' decreased 12%. Moreover, among abortions performed at ≤13 weeks' gestation, the distribution shifted toward earlier gestational ages, with the percentage of these abortions performed at ≤6 weeks' gestation increasing 47%.
In 2009, 74.2% of abortions were performed by curettage at ≤13 weeks' gestation, 16.5% were performed by early medical abortion (a nonsurgical abortion at ≤8 weeks' gestation), and 8.1% were performed by curettage at >13 weeks' gestation. Among abortions that were performed at ≤8 weeks' gestation and thus were eligible for early medical abortion, 25.2% were completed by this method. The use of early medical abortion increased 10% from 2008 to 2009.
Deaths of women associated with complications from abortions for 2009 are being investigated under CDC's Pregnancy Mortality Surveillance System. In 2008, the most recent year for which data were available, 12 women were reported to have died as a result of complications from known legal induced abortions. No reported deaths were associated with known illegal induced abortions.
Interpretation: Among the 45 areas that reported data every year during 2000–2009, the gradual decrease that had occurred during previous decades in the total number and rate of reported abortions continued through 2005, whereas year-to-year variation from 2006 to 2008 resulted in no net change during this later period. However, the change from 2008 to 2009 for both the total number of abortions and the abortion rate was the largest single year decrease during 2000–2009, and all three measures of abortion (total numbers, rates, and ratios) decreased to the lowest level observed during this period.
Public Health Actions: Unintended pregnancy is the major contributor to abortion. Because unintended pregnancies are rare among women who use the most effective methods of reversible contraception, increasing access to and use of these methods can help further reduce the number of abortions performed in the United States. The data in this report can help program planners and policy makers identify groups of women at greatest risk for unintended pregnancy and help guide and evaluate prevention efforts.
Introduction
This report is based on abortion data for 2000–2009 that were provided voluntarily to CDC by the central health agencies of 48 reporting areas (the District of Columbia; New York City; and 46 states, excluding California, Delaware, Maryland, and New Hampshire). Since 1969, CDC has conducted abortion surveillance to document the number and characteristics of women obtaining legal induced abortions in the United States (1). Following nationwide legalization of abortion in 1973, the total number, rate (number of abortions per 1,000 women aged 15–44 years), and ratio (number of abortions per 1,000 live births) of reported abortions increased rapidly, reaching the highest levels in the 1980s before decreasing at a slow yet steady pace (2–6). However, the incidence of abortion has varied considerably across demographic subpopulations (7–11), and recent reports through 2008 have suggested that the sustained pattern of decrease has leveled off (12–15). Continued surveillance is needed to monitor long-term changes in the incidence of abortion in the United States.
Methods
Description of the Surveillance System
Each year, CDC requests tabulated data from the central health agencies of 52 reporting areas (the 50 states, the District of Columbia, and New York City) to document the number and characteristics of women obtaining abortions in the United States. For the purpose of surveillance, a legal induced abortion* is defined as an intervention performed by a licensed clinician (e.g., a physician, nurse-midwife, nurse practitioner, or physician assistant) that is intended to terminate a suspected or known ongoing intrauterine pregnancy and produce a nonviable fetus at any gestational age.
In most states, collection of abortion data is facilitated by the legal requirement for hospitals, facilities, and physicians to report abortions to a central health agency (16). These central health agencies voluntarily provide CDC aggregate numbers for the abortion data they have collected (17).
Although reporting to CDC is voluntary, most reporting areas do provide aggregate abortion numbers: during 2000–2009, a total of 45 reporting areas provided CDC a continuous annual record of abortion numbers,† and in 2009, CDC obtained aggregate abortion numbers from 48 reporting areas (excludes California, Delaware, Maryland, and New Hampshire). However, the level of detail that CDC receives on the characteristics of women obtaining abortions varies considerably from year to year and among reporting areas. To encourage more uniform collection of these details, CDC has developed a model reporting form to serve as a technical guide (18). However, because the collection of abortion data is not federally mandated, many reporting areas have developed their own forms and do not collect all the information that CDC compiles.
Variables and Categorization of Data
Each year, CDC sends suggested templates to the central health agencies for compilation of abortion data in aggregate. Aggregate abortion numbers, but no individual-level records, are requested for the following variables:
- Age in years of the woman (<15, 15–19 by individual year, 20–24, 25–29, 30–34, 35–39, or ≥40)
- Gestational age in weeks at the time of abortion (≤6, 7–20 by individual week, or ≥21)
- Race (black, white, Asian, Native Hawaiian/Pacific Islander, or American Indian/Alaska Native)
- Ethnicity (Hispanic or non-Hispanic)
- Method type (curettage,§ intrauterine instillation, medical [nonsurgical] abortion, or other¶)
- Marital status (married [including currently married or separated] or unmarried [including never married, widowed, or divorced])
- Number of previous live births (0, 1, 2, 3, or ≥4)
- Number of previous abortions (0, 1, 2, or ≥3)
- Maternal residence (the state, reporting area, or foreign country in which the woman obtaining the abortion lived, or, if additional details are unavailable, in-reporting area versus out-of-reporting area)
In addition to sending templates for compiling information on race and ethnicity as separate variables, CDC has provided alternative templates since 2001 for the tabulation of aggregate cross-classified race/ethnicity data. Before 2007, few reporting areas returned these alternative templates. Therefore, 2009 is only the third year for which CDC has had sufficient data to report results by these cross-classified race/ethnicity categories (non-Hispanic white, non-Hispanic black, non-Hispanic other, and Hispanic).
Finally, both the original and alternative templates provided by CDC request that aggregate numbers for certain individual variables be cross-tabulated by a second variable. These cross-tabulations include gestational age (by age, method type, race, ethnicity, and race/ethnicity) and age and marital status (by race, ethnicity, and race/ethnicity).
In this report, medical abortions and abortions performed by curettage are further categorized by gestational age. For medical abortion, early medical abortion is defined as the administration of medication or medications (typically mifepristone followed by misoprostol) to induce an abortion at ≤8 weeks' gestation**; medical abortion at >8 weeks' gestation is defined as the administration of medication or medications (typically vaginal prostaglandins) to induce an abortion at >8 weeks' gestation. For curettage, abortions are categorized as having been performed at ≤13 weeks' gestation or at >13 weeks' gestation because of differences in technique used before and after 13 weeks (20). Finally, because intrauterine instillations cannot be performed early in gestation, abortions reported to have been performed by intrauterine installation at ≤12 weeks' gestation are excluded from calculation of the percentage of abortions by known method type.††
Measures of Abortion
Four measures of abortion are presented in this report: 1) the total number of abortions in a given population, 2) the percentage of abortions obtained by a given subpopulation, 3) the abortion rate (number of abortions per 1,000 women aged 15–44 years or other specific group within a given population), and 4) the abortion ratio (number of abortions per 1,000 live births within a given population). Although total numbers and percentages are useful measures for determining how many women have obtained an abortion, abortion rates adjust for differences in subpopulation size and reflect how likely abortion is among women in particular groups. Abortion ratios measure the relative number of pregnancies in a population that end in abortion compared with live birth. Abortion ratios are influenced both by the proportion of pregnancies in a population that are unintended and the proportion of unintended pregnancies that end in abortion. Abortion ratios also are influenced by the proportion of intended pregnancies that end in abortion; however, intended pregnancies account for a very small percentage of abortions (<5%) (23).
U.S. Census Bureau estimates of the resident female population of the United States, compiled by CDC, were used as the denominator for calculating abortion rates (24–32). Overall abortion rates were calculated from the population of women aged 15–44 years. For adolescents aged <15 years, abortion rates were based on the number of adolescents aged 13–14 years; similarly, for women aged ≥40 years, abortion rates were based on the number of women aged 40–44 years. For the calculation of abortion ratios, live birth data were obtained from CDC natality files (33).
Data Presentation and Analysis
This report provides state-specific and overall abortion numbers, rates, and ratios for the 48 areas that reported to CDC for 2009 (excludes California, Delaware, Maryland, and New Hampshire). In addition, this report describes the characteristics of women who obtained abortions in 2009. Because the completeness of reporting on the characteristics of women varies by year and by variable, this report only describes the characteristics of women from areas that met reporting standards (i.e., reported at least 20 abortions, provided data categorized in accordance with surveillance variables, and had <15% unknown values for a given characteristic). Cells with a value in the range of 1 to 4 have been suppressed to maintain confidentiality. In addition, abortion rates and ratios have been omitted for groups with <20 abortions because results are considered unstable.
Although most of the data in this report are presented by the reporting area in which the abortions were performed, 47 reporting areas§§ also provided the number of abortions by maternal residence. However, three of these reporting areas (Illinois, Pennsylvania, and Wisconsin) reported certain characteristics for in-state residents but not for out-of-state residents. Four other reporting areas (Arizona, Iowa, Louisiana, and Massachusetts) provided only the total number of abortions for out-of-state residents without specifying individual states or areas of residence from which these women came. As a result, abortion statistics in this report by area of residence are minimum estimates and might be disproportionately low for reporting areas from which many women travel to other states to obtain abortion services.
For the purpose of evaluating overall trends in the number, rate, and ratio of reported abortions, annual data are presented for the 45 areas that reported every year during 2000–2009. Linear regression analysis was used to assess the overall rate of change among these areas during 2000–2009 and during the first and second half of the period of analysis (2000–2004 and 2005–2009). Percentage change calculations (for 2008 to 2009 and for 2000 to 2009) were also calculated with the same 45 areas that provided data for every year included in this report. For the analysis of certain additional variables (abortions by maternal age, gestational age, race, and ethnicity), annual data are presented for areas that met reporting standards every year during 2000–2009, and the percentage change was calculated for 2000 to 2009, 2000 to 2004, 2005 to 2009, and 2008 to 2009. For other variables (marital status, number of previous abortions, and number of previous live births), annual data are not presented, and areas were included as long as they provided data that met reporting standards for the years needed for percentage change calculations. To evaluate trends in the use of different methods for performing an abortion, reporting areas were included only if they met reporting standards and if they specifically included medical abortion as a method on their reporting form. Because approval of mifepristone for medical abortion was granted by the Food and Drug Administration (FDA) in September 2000 (34), comparisons have been made between 2001 (the first complete year after FDA approval of mifepristone) and 2009 and between 2008 and 2009.
Because some of the 48 areas that reported for 2009 were not included in certain trend analyses, summary measures for comparisons over time might differ slightly from the point estimates presented for all areas that reported for 2009.
Abortion Mortality
CDC has reported data on abortion-related deaths periodically since information on abortion mortality first was included in the 1972 abortion surveillance report (14,35). An abortion-related death is defined as a death resulting from a direct complication of an abortion (legal or illegal), an indirect complication caused by a chain of events initiated by an abortion, or an aggravation of a preexisting condition by the physiologic or psychologic effects of abortion (36). All deaths determined to be related causally to induced abortion are classified as abortion related regardless of the time between the abortion and death. In addition, any pregnancy-related death in which the pregnancy outcome was induced abortion regardless of the causal relation between the abortion and the death is considered an abortion-related death. An abortion is defined as legal if it is performed by a licensed clinician; an abortion is defined as illegal if it is performed by any other person.
Since 1987, CDC has monitored abortion-related deaths through its Pregnancy Mortality Surveillance System (37). Sources of data for abortion-related deaths have included state vital records, public health agencies, maternal mortality review committees, health-care providers and provider organizations, private citizens and citizen groups, and media reports, including computerized searches of full-text newspaper and other print media databases. For each death that possibly is related to abortion, CDC requests clinical records and autopsy reports. Two medical epidemiologists review these reports to determine the cause of death and whether the death was abortion related. Each death is categorized by abortion type as legal induced, illegal induced, spontaneous, or unknown type. This report provides data on induced abortion-related deaths that occurred in 2008, the most recent year for which data are available. Data on induced abortion-related deaths that occurred during 1972–2007 already have been published (14), and possible abortion-related deaths that occurred during 2009–2012 are under investigation. For 1998–2008, surveillance data reported to CDC cannot be used alone to calculate national case-fatality rates (number of legal induced abortion-related deaths per 100,000 reported legal induced abortions in the United States) because some states (four during 1998–1999, three during 2000–2005 and 2007–2008, and two during 2006), including California, did not report abortion surveillance data. Thus, national legal induced abortion case-fatality rates were calculated with denominator data from a more complete source available for 1973–2008 (12). Because rates based on <20 deaths are highly variable (38), national legal induced abortion case-fatality rates were calculated for one 6-year period (1973–1978) and for consecutive 5-year periods thereafter.
Results
U.S. Totals
Among the 48 reporting areas that provided data for 2009, a total of 784,507 abortions were reported. Of these abortions, 772,630 (98.5%) were from the 45 reporting areas that provided data every year during 2000–2009.¶¶ These same 45 areas had an abortion rate of 15.1 abortions per 1,000 women aged 15–44 years and an abortion ratio of 227 abortions per 1,000 live births (Table 1). Compared with 2008, the total number of abortions reported for the same 45 areas decreased 5% (from 810,403); the abortion rate for these areas also decreased 5% (from 15.9 abortions per 1,000 women aged 15–44 years), and the abortion ratio decreased 2% (from 232 abortions per 1,000 live births). From 2000 to 2009, the total number of reported abortions decreased 6% (from 826,123), the abortion rate decreased 7% (from 16.2 abortions per 1,000 women aged 15–44 years), and the abortion ratio decreased 8% (from 248 abortions per 1,000 live births) (Figure 1). For both the total number and rate of abortions, the change from 2008 to 2009 was the largest single year decrease during the entire period of analysis. Moreover, for all three measures of abortion, the annual rate of decrease fitted from the regression analysis was greater during 2005–2009 than during 2000–2004. During 2005–2009, the number of reported abortions decreased by 7,538 abortions per year, the abortion rate decreased by 0.12 abortions per 1,000 women per year, and the abortion ratio decreased by 2.2 abortions per 1,000 live births per year. In contrast, during 2000–2004, the number of reported abortions decreased by 3,128 abortions per year, the abortion rate decreased by 0.06 abortions per 1,000 women per year, and the abortion ratio decreased by 1.8 abortions per 1,000 live births per year.
Occurrence and Residence
Abortion numbers, rates, and ratios have been calculated by individual state or reporting area of occurrence and the residence of the women who obtained the abortions (Table 2). By occurrence, a considerable range existed in the total number of reported abortions (ranging from 769 in South Dakota to 119,996 in New York, including New York City and New York State combined),*** the abortion rate (ranging from 4.0 abortions per 1,000 women aged 15–44 years in Mississippi to 29.8 in New York [city and state combined]), and the abortion ratio (ranging from 57 abortions per 1,000 live births in Mississippi to 484 in New York [city and state combined]). Similarly, a considerable range existed by residence††† in the total number of reported abortions (ranging from 782 in Wyoming to 115,629 in New York [city and state combined]), the abortion rate (ranging from 5.7 abortions per 1,000 women aged 15–44 years in Utah to 28.7 in New York§§§ [city and state combined]), and the abortion ratio (ranging from 64 abortions per 1,000 live births in Utah to 466 in New York [city and state combined]). Because of the substantial variation that also occurred among reporting areas in the percentage of abortions obtained by out-of-state residents (ranging from none in Wyoming to 51.8% in the District of Columbia), abortion rates and ratios calculated by maternal residence might provide a more accurate reflection of population trends. However, these measures must be viewed with caution because states vary in the level of detail they collect on maternal residence and as a result, 11.4% of abortions were reported without a state, territory, reporting area, or country of maternal residence.
Age
Among the 45 areas that reported by maternal age for 2009, women aged 20–29 years accounted for the majority (57.1%) of abortions and had the highest abortion rates (27.4 and 20.4 abortions per 1,000 women aged 20–24 and 25–29 years, respectively) (Figure 2, Table 3). Women in the youngest and oldest age groups (aged <15 or ≥40 years) accounted for the smallest percentage of abortions (0.5% and 3.3%, respectively) and had the lowest abortion rates (1.1 and 2.7 abortions per 1,000 women aged <15 and ≥40 years, respectively). Among the 42 reporting areas that provided data every year during 2000–2009, this pattern across age groups was stable, with the majority of abortions and the highest abortion rates occurring among women aged 20–29 years and the lowest percentages of abortions and abortion rates occurring among women in the youngest and oldest age groups (Table 4). However, from 2000 to 2009 the abortion rate and percentage of abortions accounted for by younger women decreased, whereas the abortion rate and percentage of abortions accounted for by older women increased. Among women aged <30 years, abortion rates decreased both from 2000 to 2004 and from 2005 to 2009; decreases from 2008 to 2009 were greater than in any other year during the period of analysis (6%–8%). In contrast, among women aged ≥40 years, abortion rates increased both from 2001 to 2004 and from 2005 to 2009. Among women aged 30–39 years, abortion rates varied more from year to year, resulting in little overall change: although abortion rates increased among women aged 35–39 years from 2000 to 2004 this increase did not continue from 2005 to 2009.
In contrast to the percentage distribution of abortion numbers and abortion rates, abortion ratios in 2009 were highest among adolescents aged ≤19 years and lowest among women aged 30–39 years (Figure 2, Table 3). Among the 42 reporting areas that provided data for every year during 2000–2009, abortion ratios decreased among all women aged ≥15 years. For most age groups ≥15 years, abortion ratios decreased both from 2000 to 2004 and from 2005 to 2009. However for women aged 15–19 years, abortion ratios increased from 2000 to 2004 before they decreased from 2005 to 2009; among women aged 35–39 years abortion ratios decreased from 2000 to 2004 but not from 2005 to 2009 (Table 4).
Adolescents
Among the 42 areas that reported age by individual year among adolescents for 2009, the adolescent abortion rate was 9.7 abortions per 1,000 adolescents aged ≤19 years (Table 5). Adolescents aged 18–19 years accounted for the majority (63.9%) of adolescent abortions and had the highest adolescent abortion rates (18.4 and 22.9 abortions per 1,000 adolescents aged 18 and 19 years, respectively); adolescents aged <15 years accounted for the smallest percentage of adolescent abortions (3.0%) and had the lowest adolescent abortion rate (1.0 abortions per 1,000 adolescents aged <15 years). Among the 39 reporting areas that provided data for adolescents by individual year of age every year during 2000–2009, this pattern across age groups was stable, with older adolescents consistently accounting for the largest percentage of adolescent abortions and having the highest abortion rates (Table 6). Although the percentage of abortions accounted for by adolescents aged 19 years increased from 2000 to 2009, abortion rates decreased among adolescents of all ages, and these decreases occurred both from 2000 to 2004 and from 2005 to 2009. For adolescents in all age groups, the decrease in the abortion rate from 2008 to 2009 was the largest single year change during the entire period of analysis.
The adolescent abortion ratio for 2009 was 326 abortions per 1,000 live births. Adolescent abortion ratios decreased with increasing age and were lowest among adolescents aged 19 years (Table 5). Among the 39 reporting areas that provided data for adolescents by individual year of age for every year during 2000–2009, abortion ratios among all adolescents aged >15 years were lower in 2009 than they had been in 2000, with the greatest decreases occurring among adolescents aged 18–19 years (Table 6). For all adolescents aged 15–19 years this decrease occurred almost exclusively from 2005 to 2009 and not from 2000 to 2004.
Gestational Age
Among the 39 areas that reported gestational age at the time of abortion for 2009 (Table 7), the majority (64.0%) of abortions were performed at ≤8 weeks' gestation, and 91.7% were performed at ≤13 weeks' gestation. Few abortions (7.0%) were performed at 14–20 weeks' gestation, and even fewer (1.3%) were performed at ≥21 weeks' gestation. Among the 30 reporting areas that provided data on gestational age every year during 2000–2009 (Table 8), the percentage of abortions performed at ≤13 weeks' gestation increased only slightly. However, within this gestational age range, a shift occurred toward earlier gestational ages, with abortions performed at ≤8 weeks' gestation increasing 12%. The percentage increase in abortions performed at ≤8 weeks' was greatest from 2000 to 2004 but continued from 2005 to 2009. Throughout the period of analysis, the percentage of abortions performed at >13 weeks' gestation remained low (<10%), and abortions performed at ≥16 weeks' gestation decreased 13%–22% from 2000 to 2009.
Among the subset of abortions performed at ≤13 weeks' gestation in 2009, 35.2% were performed at ≤6 weeks' gestation, and 34.6% were performed at 7–8 weeks' gestation (Table 9). Among the remaining abortions at ≤13 weeks' gestation, the percentage contribution was progressively lower for each additional week of gestation: 10.2% were performed at 9 weeks' gestation, whereas 3.0% were performed at 13 weeks' gestation. Among the 30 areas that reported by the exact week of gestational age for every year during 2000–2009, the percentage of abortions shifted over time toward earlier gestational ages: among abortions performed at ≤13 weeks' gestation, those that were performed at ≤6 weeks' gestation increased 47%, whereas the percentage performed at 7–13 weeks' gestation decreased up to 26% (Table 10); the percentage increase in abortions performed at ≤6 weeks' was greatest from 2000 to 2004, but this increase continued from 2005 to 2009.
Method Type
Among the 38 areas that reported by method type for 2009 and included medical abortion on their reporting form for medical providers, 74.2% of abortions were performed by curettage at ≤13 weeks' gestation; 16.5% were performed by early medical (nonsurgical) abortion, 8.1% were performed by curettage at >13 weeks' gestation, and all other methods were uncommon (Table 11). Among the 27 reporting areas that included medical abortion on their reporting form and provided this data for all 3 years of comparison (2001, the first full year following FDA approval of mifepristone for use in early medical abortion, as well as 2008 and 2009),¶¶¶ the use of early medical abortion increased 10% from 2008 to 2009 and approximately 350% from 2001 to 2009 (from 3.4% of abortions in 2001 to 13.8% in 2008 and 15.2% in 2009). In contrast, use of curettage at ≤13 weeks' gestation decreased 2% from 2008 to 2009 and 14% from 2001 to 2009 (from 87.3% of abortions in 2001 to 76.7% in 2008 and 75.5% in 2009). Use of curettage at >13 weeks' gestation was stable from 2001 to 2008 but decreased 5% from 2008 to 2009 (from 8.6% of abortions in 2001 and in 2008 to 8.2% in 2009). All other methods consistently accounted for a small percentage of abortions (0.04%–0.9%).
Race/Ethnicity
Among the 29 areas that reported cross-classified race/ethnicity data for 2009 (Table 12), non-Hispanic white women and non-Hispanic black women accounted for the largest percentages of abortions (37.7% and 35.4%, respectively), whereas Hispanic women and non-Hispanic women in the other races category accounted for smaller percentages (20.6% and 6.3%, respectively). Non-Hispanic white women had the lowest abortion rates (8.5 abortions per 1,000 women aged 15–44 years) and ratios (140 abortions per 1,000 live births), whereas non-Hispanic black women had the highest abortion rates (32.5 abortions per 1,000 women aged 15–44 years) and ratios (477 abortions per 1,000 live births). Among the 24 areas**** that reported by race/ethnicity every year during 2007–2009, abortion rates decreased for all racial/ethnic groups. The abortion rate decreased 7% for non-Hispanic white women (from 9.1 abortions per 1,000 women in 2007 to 8.5 in 2009) and 6% for Hispanic women (from 20.5 abortions per 1,000 women in 2007 to 19.3 in 2009) but only 1% for non-Hispanic black women (from 34.6 abortions per 1,000 women in 2007 to 34.2 in 2009). In contrast, abortion ratios decreased among non-Hispanic white women but not among women in any other racial/ethnic group. For non-Hispanic white women, the abortion ratio decreased 3% (from 143 abortions per 1,000 live births in 2007 to 138 in 2009), whereas the abortion ratio increased 4% for non-Hispanic black women (from 481 abortions per 1,000 live births in 2007 to 501 in 2009) and 2% for Hispanic women (from 192 abortions per 1,000 live births in 2007 to 195 in 2009). Data also are reported separately by race and by ethnicity for 2009 (Tables 13 and 15) and for 2000–2009 (Tables 14 and 16).
Marital Status
Among the 37 areas that reported marital status for 2009, 15.0% of all women who obtained abortions were married, and 85.0% were unmarried (Table 17). For the 28 reporting areas†††† that provided these data for the relevant years of comparison, the percentage of abortions accounted for by unmarried women increased 4% from 2000 to 2009 (from 81.6% in 2000 to 85.0% in 2009); an increase occurred both from 2000 to 2004 and from 2005 to 2009.
Previous Live Births and Abortions
Data from the 36 areas that reported the number of previous live births for women who obtained abortions in 2009 show that 40.2%, 46.3%, and 13.6% of these women previously had zero, one to two, or three or more live births, respectively (Table 18). Among the 29 reporting areas§§§§ that provided these data for the relevant years of comparison, little change occurred in the distribution of abortions by the number of previous live births: the percentage of women who had zero previous live births was 39.7% in 2000 and 40.1% in 2009; the percentage of women who had one to two previous live births was 48.0% in 2000 and 46.4% in 2009; and the percentage of women who had three or more previous live births was 12.4% in 2000 and 13.5% in 2009.
Data from the 37 areas that reported the number of previous abortions for women obtaining abortions in 2009 show that the majority of women (55.3%) had not previously had an abortion; 36.6% had previously had either one to two abortions, and 8.1% had three or more abortions (Table 19). Among the 30 reporting areas¶¶¶¶ that provided data for the relevant years of comparison, the distribution of abortions by the number of previous abortions changed little: the percentage of women who had zero previous abortions was 55.0% in 2000 and 55.4% in 2009; the percentage of women who had one or two previous abortions was 37.3% in 2000 and 36.5% in 2009; and the percentage of women who had three or more previous abortions was 7.7% in 2000 and 8.2% in 2009.
Age and Marital Status by Race and Race/Ethnicity
In some reporting areas, abortions that were categorized by maternal race and race/ethnicity were further categorized by maternal age and marital status (Tables 20 and 21). A consistent pattern existed for abortion by age across all racial and racial/ethnic groups, with the smallest percentage of abortions occurring among adolescents aged <15 years (0.3%–0.7%) and the largest percentage occurring among women aged 20–24 years (26.9%–33.8%). A consistent pattern also existed for abortion by marital status across all racial and racial/ethnic groups, with a higher percentage of abortions occurring among women who were unmarried (66.0%–91.3%) than among those who were married (8.7%–34.0%). However, although most abortions occurred among unmarried women in all racial/ethnic groups, this percentage was higher for non-Hispanic black women (90.6%) than it was for non-Hispanic white (83.3%) or Hispanic women (83.8%).
Weeks of Gestation by Age, Race, Race/Ethnicity, and Method Type
In some reporting areas, abortions that were categorized by weeks of gestation were further categorized by maternal age, race, and race/ethnicity (Tables 22 and 23). In every subgroup for these three variables, the largest percentage of abortions was obtained at ≤8 weeks' gestation. However, whereas 46.5% of adolescents aged <15 years and 54.3% of adolescents aged 15–19 years obtained an abortion by ≤8 weeks' gestation, 62.1%–71.2% of women aged ≥20 years obtained an abortion by this point in gestation (Figure 3; Table 22). Conversely, 19.0% of adolescents aged <15 years and 11.8% of adolescents 15–19 years obtained an abortion after 13 weeks' gestation, whereas this percentage ranged from 6.5%–8.7% for adult women. By race/ethnicity, 58.4% of non-Hispanic black women obtained an abortion at ≤8 weeks' gestation, whereas 66.5%–70.8% of women from other racial/ethnic groups obtained an abortion by this point in gestation. Non-Hispanic black women also obtained the highest percentage of abortions after 13 weeks' gestation; however, differences across racial/ethnic groups were less apparent than differences across age groups (Table 22).
Among abortions categorized by method type and gestational age, curettage accounted for the largest percentage of abortions within every gestational age category (Table 24). At ≤8 weeks' gestation, curettage accounted for a smaller percentage of abortions (74.5%) than at any other stage of gestation, and early medical abortion accounted for a comparatively high percentage of abortions (25.2%). At 9–17 weeks' gestation, curettage accounted for 96.4%–98.3% of all abortions and then decreased to 94.7% of abortions at 18–20 weeks' gestation and 91.4% of abortions at ≥21 weeks' gestation. After the gestational age limit of ≤8 weeks' gestation for early medical abortion, the use of medications to induce abortions through nonsurgical methods accounted for only 0.8%–2.9% of reported abortions at 9–20 weeks' gestation and then increased to 6.9% of abortions at ≥21 weeks' gestation. Throughout gestation, intrauterine instillations and abortions reported in the other methods category accounted for a small percentage (<0.01%–1.9%) of abortions.
Abortion Mortality
Using national data from the Pregnancy Mortality Surveillance System (37), CDC identified 12 abortion-related deaths for 2008 (Table 25). These deaths were identified either by some indication of abortion on the death certificate, by reports from a health-care provider or public health agency, or from a media report. Investigation of these cases indicated that all 12 deaths were related to legal abortion and none to illegal abortion. The national legal induced abortion case-fatality rate for 2004–2008 was 0.64 legal induced abortion-related deaths per 100,000 reported legal abortions. Possible abortion-related deaths that occurred during 2009–2012 are under investigation.
Discussion
For 2009, a total of 784,507 abortions were reported. Of these abortions, 772,630 (98.5%) were from the 45 reporting areas that submitted data every year during 2000–2009, thus providing the information necessary for evaluating trends. These 45 areas had an abortion rate of 15.1 abortions per 1,000 women aged 15–44 years and an abortion ratio of 227 abortions per 1,000 live births. Comparing 2008 with 2009, this represents the largest single-year decrease in the total number (a decrease of 5% from 810,403) and rate (a decrease of 5% from 15.9 abortions per 1,000 women) of reported abortions. Because of the size of the decreases that occurred from 2008 to 2009 for all three measures of abortion, the overall decrease in the total number, rate and ratio was greater during 2005–2009 than during 2000–2004. Hence, although recent variations had resulted in a leveling off from sustained decreases observed in the past, with no net decrease in the total number or rate of abortions occurring from 2005 to 2008 (12–15), all three measures of abortion decreased in 2009 to the lowest level observed during the entire period of analysis.
In addition to highlighting changes that occurred among all women of reproductive age, this report highlights important age differences in abortion trends. Throughout the period of analysis (2000–2009), women in their 20s consistently accounted for the majority of abortions (56%–57%) and therefore strongly influenced overall changes in abortion rates, including the observed decrease from 2008 to 2009. Conversely, women aged ≥35 years consistently have accounted for a small percentage of abortions (≤12% during 2000–2009) and have had a much smaller impact on overall abortion trends. Nonetheless, the persistent increase in abortion rates and high abortion ratios among women aged ≥40 years suggest that unintended pregnancy is a problem that women continue to face throughout their reproductive years.
The adolescent abortion trends described in this report are important for monitoring progress that has been made toward reducing pregnancies among adolescents in the United States. During 1990–2008, the pregnancy rate for adolescents aged 15–19 years decreased 40% (5). Although this decrease was associated with significant decreases in rates of live births and abortions, decreases during this period were even greater for abortions than live births (5); even during a brief 2-year increase from 2005 to 2007 in the adolescent birth rate (39), the adolescent abortion rate decreased by 1% (15). Data from this report indicate that the decrease in pregnancies among adolescents is continuing; the abortion rate for adolescents aged 15–19 years decreased 8% from 2008 to 2009, thus exceeding the 6% decrease in adolescent births for this year (40).
The findings in this report on race and ethnicity reflect differences in patterns of obtaining abortions that have been well-documented and observed for many years (2–11). Comparatively high abortion rates and ratios among non-Hispanic black women can be attributed to higher unintended pregnancy rates and a higher percentage of unintended pregnancies ending in abortion (41,42). Data from recent reports suggest that differences in measures of abortion between black women and women of other races have narrowed (10,11), although this pattern has not been observed in the data reported to CDC for 2009 or in previous years (14). High abortion rates among Hispanic compared with non-Hispanic white women have been attributed to high pregnancy rates among Hispanic women (41,42). However, abortion ratios in these two groups have been more comparable: Hispanic women have tended to have a slightly higher percentage of pregnancies that are unintended but are no more likely than non-Hispanic white women to end unintended pregnancies in abortion (41). Differences between non-Hispanic white and Hispanic women in abortion rates and ratios changed little from 2007 to 2009.
The findings in this report indicate that more women are obtaining abortions earlier in gestation, when the risks for complications are lowest (43–46). Among the areas that reported data every year during 2000–2009, the percentage of abortions performed at ≤8 weeks' gestation increased 12%. Moreover, among the areas that reported abortions at ≤13 weeks' gestation by individual week, a clear shift in the distribution toward earlier weeks of gestation was observed: from 2000 to 2009, abortions performed at ≤6 weeks' gestation increased 47%, whereas those performed at ≥8 weeks' gestation decreased. However, these changes were greater from 2000 to 2004 than from 2005 to 2009, suggesting that the increase in the percentage of abortions performed during the earliest stages of gestation might have slowed in recent years. Moreover, the overall percentage of abortions performed at ≤13 weeks' gestation changed little during 2000–2009, and findings from this report and other research suggest that delays in obtaining an abortion are more common among certain groups of women (47,48). Given the small but persistent percentage of women who obtain abortions at >13 weeks' gestation, a greater understanding is needed of the factors that cause delays in pregnancy termination (48–51).
The trend of obtaining abortions earlier in pregnancy, although not observed equally among all subgroups of women, has been facilitated by changes in abortion practices. Curettage has remained the most common method for performing abortions. Although for many years this type of abortion was performed only after the initial weeks of gestation, the development of highly sensitive pregnancy tests and transvaginal ultrasonography increasingly have allowed clinicians to diagnose pregnancy and confirm its termination at ≤6 weeks' gestation (52–57). In addition, the use of medical abortion might have contributed to the increasing percentage of abortions performed early in gestation. In September 2000, FDA approved mifepristone for use in early medical abortion (34), and the American College of Obstetricians and Gynecologists has endorsed an evidence-based protocol that can be used up to 63 days of gestation (19). In 2009, 64.0% of abortions were performed at ≤8 weeks' gestation and thus were eligible for early medical abortion; 25.2% of these eligible abortions and 16.5% of all abortions were reported as early medical abortions. Moreover, the use of early medical abortion has increased substantially since FDA approval of mifepristone: from 2001 to 2009, the percentage of all reported abortions accounted for by this method increased approximately 350%. Furthermore, whereas the rate of increase leveled off after the initial years of approval (58), the proportional use of this method has continued to increase, with the percentage of all abortions reported as early medical abortion increasing 10% from 2008 to 2009.
In 2008, 12 legal induced abortion-related deaths occurred; no women died as a result of a known illegal abortion. The annual number of legal induced abortions has fluctuated from year to year over the past 36 years (Table 25). For example, 12 abortion-related deaths occurred in 1994, four deaths in 1995, and nine deaths in 1996. Because of this variability and the relatively small number of abortion-related deaths every year, national case-fatality rates were calculated for 5-year periods. The national legal induced abortion case-fatality rate was 0.64 legal induced abortion-related deaths per 100,000 reported legal induced abortions for both the most recent period (2004–2008) and the preceding 5-year period (1999–2003).
Limitations
The findings in this report are subject to at least four limitations. First, because reporting requirements are established by the individual reporting areas (17), the collection of data varies, and CDC is unable to obtain the total number of abortions performed in the United States. During the period covered by this report, the total annual number of abortions recorded by CDC was 65%–69% of the number recorded by the Guttmacher Institute (12,59), which uses numerous active follow-up techniques to increase the completeness of the data obtained through its periodic national census of abortion providers (12). Although most reporting areas collect and send abortion data to CDC, this information is given to CDC voluntarily. Consequently, during 2000–2009, seven of the 52 reporting areas did not provide CDC data on a consistent annual basis, and for 2009, CDC did not obtain any information from California, Delaware, Maryland, or New Hampshire.***** In addition, whereas most of the reporting areas that send abortion data to CDC have laws requiring medical providers to submit a report for every abortion they perform to a central health agency, in New Jersey and the District of Columbia, medical providers submit this information voluntarily (16). As a result, the abortion numbers these areas report to CDC are incomplete.††††† Moreover, even in states that legally require medical providers to submit a report for all the abortions they perform, enforcement of this requirement varies (60). Consequently, several other reporting areas tend to provide CDC with incomplete numbers.§§§§§
Second, because reporting requirements are established by the individual reporting areas, many states have developed reporting forms that do not resemble the template CDC created for technical guidance (18). Consequently, many reporting areas do not collect all the information CDC compiles on the characteristics of women obtaining abortions (e.g., age, race, and ethnicity) (60). Although missing demographic information can reduce the extent to which the statistics in this report represent all women in the United States, four nationally representative surveys of women obtaining abortions in 1987, 1994–1995, 2001–2002, and 2008 (7–10) have produced distributions, for most characteristics, that are nearly identical to the distributions reported by CDC. The one exception is the distribution of abortions by race/ethnicity. In particular, the percentage of abortions accounted for by non-Hispanic black women is higher in this report than the percentage in reports based on a recent nationally representative survey of abortion patients (10). Similarly, the greater decrease in abortion rates for non-Hispanic black women compared with women of other racial/ethnic groups based on nationally representative survey data (11) is not supported by the data reported to CDC. These differences likely are attributable both to the comparatively high degree of measurement error for this variable that reduces the reliability of national survey results (10,11) and to the fact that the number of states that report to CDC by race/ethnicity continues to be somewhat lower than for other demographic variables. Importantly, some of the reporting areas that have not reported to CDC, or have not reported cross-classified race/ethnicity data (e.g., California, Florida, and Illinois), have large enough populations of minority women that the absence of data from these areas reduces the representativeness of CDC data.
Third, abortion data are compiled and reported to CDC by the central health agency of the reporting area in which the abortion was performed rather than the reporting area in which the woman lived. This inflates abortion statistics for reporting areas in which a high percentage of abortions are obtained by out-of-state residents and undercounts abortions for states with limited abortion services, more stringent legal requirements for obtaining an abortion, or geographic proximity to services in another state. To adjust for these biases, CDC attempts to categorize abortions by residence in addition to occurrence. However, in 2009, CDC was unable to identify the reporting area, territory, or country of residence for 11.4% of reported abortions.
Finally, adjustments for socioeconomic status cannot be made because CDC does not collect abortion data by education or income, and joint analysis of many variables of interest (e.g., age, race, and ethnicity) is precluded because reporting areas provide CDC with aggregate numbers rather than individual-level records.
Public Health Implications
Ongoing abortion surveillance is important for several reasons. First, abortion surveillance is needed to guide and evaluate programs aimed at preventing unintended pregnancies. Pregnancy intentions are complex and difficult to assess (61–68); abortion surveillance provides an important measure of pregnancies that are unwanted. Second, routine abortion surveillance is needed to assess changes in clinical practice patterns over time. Information in this report on the prevalence of abortions performed through different methods (e.g., medical or curettage) and at different gestational ages provides the denominator data that are necessary for analyses of the relative safety of abortion practices. Finally, statistics on the number of pregnancies ending in abortion are needed in conjunction with data on births and fetal losses to more accurately estimate the number of pregnancies in the United States and determine rates for various outcomes (e.g., adolescent pregnancy rates) (69).
According to the most recent national estimates, 18% of all pregnancies in the United States end in abortion (5). Multiple factors are known to influence the incidence of abortion, including the availability of abortion providers (12,70–72); state regulations, such as mandatory waiting periods (73), parental involvement laws (74), and legal restrictions on abortion providers (75); increasing acceptance of nonmarital childbearing (76,77); shifts in the racial/ethnic composition of the U.S. population (78,79); and changes in the economy and the resulting impact on fertility preferences and access to health-care services, including contraception (80,81). However, despite these multiple influences, given that unintended pregnancy precedes nearly all abortions (23),¶¶¶¶¶ efforts to reduce the incidence of abortion need to focus on helping women avoid pregnancies that they do not desire.
Providing women and men with the knowledge and resources necessary to make decisions about their sexual behavior and use of contraception can help them avoid unintended pregnancies. However, efforts to improve contraceptive use and reduce the number of unintended pregnancies in the United States have been challenging. Findings from the National Survey of Family Growth (NSFG), the primary national source of data on unintended pregnancy in the United States, suggest that unintended pregnancy decreased during 1982–1995 in conjunction with an increase in contraceptive use among women at risk for unintended pregnancy (82–84).****** However, data from the 2002 and 2006–2010 NSFGs show that contraceptive use among women at risk for unintended pregnancy has decreased (84,85). Moreover, although use of the most effective forms of reversible contraception (i.e., intrauterine devices and hormonal implants, which are as effective as sterilization at preventing unintended pregnancy [86]) has increased (85,87), use of these methods in the United States remains among the lowest of any developed country (87), and no additional progress has been made toward reducing unintended pregnancy (41,42). Research has shown that providing no-cost contraception increases use of the most effective methods and can reduce abortion rates (88,89). Removing cost as one barrier to the use of the most effective contraceptive methods might therefore be an important way to reduce the number of unintended pregnancies and consequently the number of abortions that are performed in the United States.
References
- Smith JC. Abortion surveillance report, hospital abortions, annual summary 1969. Atlanta, GA: US Department of Health, Education, and Welfare, Public Health Service, Health Services and Mental Health Administration, National Communicable Disease Center; 1970.
- CDC. Abortion surveillance—United States, 2005. MMWR 2008;57(No. SS-13).
- Henshaw SK, Kost K. Trends in the characteristics of women obtaining abortions, 1974 to 2004. New York, NY: Guttmacher Institute; 2008. Available at http://www.guttmacher.org/pubs/2008/09/23/TrendsWomenAbortions-wTables.pdf. Accessed September 10, 2012.
- Jones RK, Kost K, Singh S, Henshaw SK, Finer LB. Trends in abortion in the United States. Clin Obstet Gynecol 2009;52:119–29.
- Ventura SJ, Curtin SC, Abma JC, Henshaw SK. Estimated pregnancy rates and rates of pregnancy outcomes for the United States, 1990–2008. Natl Vital Stat Rep 2012;60(7).
- Ventura SJ, Mosher WD, Curtin SC, Abma JC, Henshaw S. Trends in pregnancies and pregnancy rates by outcome: estimates for the United States, 1976–1996. Vital Health Stat 2000;21(56).
- Henshaw SK, Kost K. Abortion patients in 1994–1995: characteristics and contraceptive use. Fam Plann Perspect 1996;28:140–7,58.
- Henshaw SK, Silverman J. The characteristics and prior contraceptive use of U.S. abortion patients. Fam Plann Perspect 1988;20:158–68.
- Jones RK, Darroch JE, Henshaw SK. Patterns in the socioeconomic characteristics of women obtaining abortions in 2000–2001.Perspect Sex Reprod Health 2002;34:226–35.
- Jones RK, Finer LB, Singh S. Characteristics of U.S. abortion patients, 2008. New York, NY: Guttmacher Institute; 2010. Available at http://www.guttmacher.org/pubs/US-Abortion-Patients.pdf. Accessed September 10, 2012.
- Jones RK, Kavanaugh ML. Changes in abortion rates between 2000 and 2008 and lifetime incidence of abortion. Obstet Gynecol 2011;117:1358–66.
- Jones RK, Kooistra K. Abortion incidence and access to services in the United States, 2008. Perspect Sexual Reprod Health 2011;43:41–50.
- CDC. Abortion surveillance—United States, 2006. MMWR 2009;58(No. SS-8).
- CDC. Abortion surveillance—United States, 2008. MMWR 2011;60(No. SS-15).
- CDC. Abortion surveillance—United States, 2007. MMWR 2011;60(No. SS-1).
- Guttmacher Institute. State policies in brief: abortion reporting requirements. New York, NY: Guttmacher Institute. Available at http://www.guttmacher.org/statecenter/spibs/spib_ARR.pdf. September 10, 2012.
- Saul R. Abortion reporting in the United States: an examination of the federal-state partnership. Fam Plann Perspect 1998;30:244–7.
- CDC. Handbook on the reporting of induced termination of pregnancy. Hyattsville, MD: US Department of Health and Human Services, CDC, National Center for Health Statistics; 1998; DHHS publication no. (PHS)98 1117:1–18.
- ACOG Committee. ACOG practice bulletin: clinical management guidelines for obstetrician-gynecologists. Obstet Gynecol 2005;106:871–82.
- Paul M, Lichtenberg ES, Borgatta L, Grimes DA, Stubblefield PG, Creinin MD. Management of unintended and abnormal pregnancy: comprehensive abortion care. Oxford, England: Blackwell; 2009.
- Grimes DA, Schultz KF, Cates W, Jr., Tyler CW. The Joint Program for the Study of Abortion/CDC: a preliminary report. In: Hern WM, Andrikopoulos B, eds. Abortion in the seventies: proceedings of the Western Regional Conference on Abortion. New York, NY: National Abortion Federation; 1977:41–54.
- Grimes DA, Schulz KF, Cates W, Jr., Tyler CW, Jr. Mid-trimester abortion by dilatation and evacuation: a safe and practical alternative. N Engl J Med 1977;296:1141–5.
- Finer LB, Kost K. Unintended pregnancy rates at the state level. Perspect Sex Reprod Health 2011;43:78–87.
- CDC. Postcensal estimates of the resident population of the United States as of July 1, 2009, by year, state and county, age, bridged race, sex, and Hispanic origin (Vintage 2009) [File pcen_v2009_y09.sasbdat]. Hyattsville, MD: CDC, National Center for Health Statistics; 2009. Available at http://www.cdc.gov/nchs/nvss/bridged_race/data_documentation.htm#vintage2009. Accessed September 10, 2012.
- CDC. Postcensal estimates of the resident population of the United States as of July 1, 2008, by year, state and county, age, bridged race, sex, and Hispanic origin (Vintage 2008). [File pcen_v2008_y08.sasbdat]. Hyattsville, MD: CDC, National Center for Health Statistics; 2009. Available at http://www.cdc.gov/nchs/nvss/bridged_race/data_documentation.htm#vintage2008. Accessed September 10, 2012.
- CDC. Postcensal estimates of the resident population of the United States as of July 1, 2007, by year, state and county, age, bridged race, sex, and Hispanic origin (Vintage 2007) [File pcen_v2007_y07.sasbdat]. Hyattsville, MD: CDC, National Center for Health Statistics; 2008. Available at http://www.cdc.gov/nchs/nvss/bridged_race/data_documentation.htm#vintage2007. Accessed September 10, 2012.
- CDC. Postcensal estimates of the resident population of the United States as of July 1, 2006, by year, state and county, age, bridged race, sex, and Hispanic origin (Vintage 2006) [File pcen_v2006_y06.sasbdat]. Hyattsville, MD: CDC, National Center for Health Statistics; 2007. Available at http://www.cdc.gov/nchs/nvss/bridged_race/data_documentation.htm#vintage2006. Accessed September 10, 2012.
- CDC. Postcensal estimates of the resident population of the United States as of July 1, 2005, by year, state and county, age, bridged race, sex, and Hispanic origin (Vintage 2005) [File pcen_v2005_y05.sasbdat]. Hyattsville, MD: CDC, National Center for Health Statistics; 2006. Available at http://www.cdc.gov/nchs/nvss/bridged_race/data_documentation.htm#vintage2005. Accessed September 10, 2012.
- CDC. Postcensal estimates of the resident population of the United States as of July 1, 2004, by year, state and county, age, bridged race, sex, and Hispanic origin (Vintage 2004) [File pcen_v2004_y04.sasbdat]. Hyattsville, MD: CDC, National Center for Health Statistics; 2005. Available at http://www.cdc.gov/nchs/nvss/bridged_race/data_documentation.htm#vintage2004. Accessed September 10, 2012.
- CDC. Postcensal estimates of the resident population of the United States as of July 1, 2003, by year, state and county, age, bridged race, sex, and Hispanic origin (Vintage 2003) [File pcen_v2003_y03.zip]. Hyattsville, MD: CDC, National Center for Health Statistics; 2004. Available at http://www.cdc.gov/nchs/nvss/bridged_race/data_documentation.htm#vintage2003. Accessed September 10, 2012.
- CDC. Postcensal estimates of the resident population of the United States as of July 1, 2002, by year, state and county, age, bridged race, sex, and Hispanic origin (Vintage 2002) [File pcen_v2002_y02.zip]; 2003. Available at http://www.cdc.gov/nchs/nvss/bridged_race/data_documentation.htm#vintage2002. Accessed September 10, 2012.
- CDC. Bridged-race population estimates of the resident population of the United States as of April 1, 2000, by state and county, single year of age, bridged race, sex, and Hispanic origin [File br040100.zip]. Hyattsville, MD: CDC, National Center for Health Statistics; 2003. Available at http://www.cdc.gov/nchs/nvss/bridged_race/data_documentation.htm#april2000. Accessed September 10, 2012.
- CDC. VitalStats—births, birth data files. Hyattsville, MD: CDC, National Center for Health Statistics. Available at http://www.cdc.gov/nchs/data_access/vitalstats/VitalStats_Births.htm. Accessed September 10, 2012.
- US Food and Drug Administration. Orange book: approved drug products with therapeutic equivalence evaluations [Mifepristone]. Available at http://www.accessdata.fda.gov/scripts/cder/ob/docs/obdetail.cfm?Appl_No=020687&TABLE1=OB_Rx. Accessed September 10, 2012.
- CDC. Abortion surveillance, 1972. Atlanta, GA: US Department of Health, Education, and Welfare, CDC; 1974.
- CDC. Abortion surveillance, 1977. Atlanta, GA: US Department of Health, Education, and Welfare, Public Health Service, CDC; 1979.
- CDC. Pregnancy mortality surveillance in the United States. Atlanta, GA; 2011. Available at http://www.cdc.gov/reproductivehealth/MaternalInfantHealth/Pregnancy-relatedMortality.htm. Accessed September 10, 2012.
- Hoyert D. Maternal mortality and related concepts. National Center for Health Statistics. Vital Health Stat 2007;3(33).
- Martin JA, Hamilton BE, Sutton PD, et al. Births: final data for 2007. Natl Vital Stat Rep 2010;58(24).
- Martin JA, Hamilton BE, Ventura SJ, et al. Births: final data for 2009. Natl Vital Stat Rep 2012;60(1).
- Finer LB, Henshaw SK. Disparities in rates of unintended pregnancy in the United States, 1994 and 2001. Perspect Sex Reprod Health 2006;38:90–6.
- Finer LB, Zolna MR. Unintended pregnancy in the United States: incidence and disparities, 2006. Contraception 2011;84:478–85.
- Bartlett LA, Berg CJ, Shulman HB, et al. Risk factors for legal induced abortion-related mortality in the United States. Obstet Gynecol 2004;103:729–37.
- Ferris LE, McMain-Klein M, Colodny N, Fellows GF, Lamont J. Factors associated with immediate abortion complications. CMAJ 1996;154:1677–85.
- Buehler JW, Schulz KF, Grimes DA, Hogue CJ. The risk of serious complications from induced abortion: do personal characteristics make a difference? Am J Obstet Gynecol 1985;153:14–20.
- Andersen K, Ganatra B, Stucke S, Basnett I, Karki YB, Thapa K. A prospective study of complications from comprehensive abortion care services in Nepal. BMC Public Health 2012;12:9.
- Jones RK, Finer LB. Who has second-trimester abortions in the United States? Contraception 2012;85:544–51.
- Kiley JW, Yee LM, Niemi CM, Feinglass JM, Simon MA. Delays in request for pregnancy termination: comparison of patients in the first and second trimesters. Contraception 2010;81:446–51.
- Joyce T, Kaestner R. The impact of Mississippi's mandatory delay law on the timing of abortion. Fam Plann Perspect 2000;32:4–13.
- Drey EA, Foster DG, Jackson RA, Lee SJ, Cardenas LH, Darney PD. Risk factors associated with presenting for abortion in the second trimester. Obstet Gynecol 2006;107:128–35.
- Finer LB, Frohwirth LF, Dauphinee LA, Singh S, Moore AM. Timing of steps and reasons for delays in obtaining abortions in the United States. Contraception. 2006;74:334–44.
- Creinin MD, Edwards J. Early abortion: surgical and medical options. Curr Probl Obstet Gynecol Fertil 1997;20:1–32.
- Edwards J, Carson SA. New technologies permit safe abortion at less than six weeks' gestation and provide timely detection of ectopic gestation. Am J Obstet Gynecol 1997;176:1101–6.
- Fjerstad M, Stewart F. Pregnancy testing and management of early pregnancy. In: Hatcher RA, Trussell J, Nelson AL, Cates Jr. W, Stewart F, Kowal D, eds. Contraceptive technology. 19th ed, rev. New York, NY: Ardent Media; 2008:591–635.
- Goldstein SR, Reeves MF. Clinical assessment and ultrasound in early pregnancy. In: Paul M, Lichtenberg ES, Borgatta L, Grimes DA, Stubblefield PG, Creinin MD, eds. Management of unintended and abnormal pregnancy: comprehensive abortion care. West Sussex, England: Blackwell; 2009:63–77.
- Mechstroth K, Paul M. First-trimester aspiration abortion. In: Paul M, Lichtenberg ES, Borgatta L, Grimes DA, Stubblefield PG, Creinin MD, eds. Management of unintended and abnormal pregnancy: comprehensive abortion care. West Sussex: Blackwell Publishing; 2009:135–56.
- Paul ME, Mitchell CM, Rogers AJ, Fox MC, Lackie EG. Early surgical abortion: efficacy and safety. Am J Obstet Gynecol 2002;187:407–11.
- Finer LB, Wei J. Effect of mifepristone on abortion access in the United States. Obstet Gynecol 2009;114:623–30.
- Guttmacher Institute. State data center, trend data, abortions by state of occurrence. New York, NY: Guttmacher Institute; 2012. Available at http://www.guttmacher.org/datacenter/trend.jsp#. Accessed September 10, 2012.
- Pazol K. Abortion surveillance in the United States: future directions and challenges. Paper presented at the annual meeting of the National Association for Public Health Statistics and Information Systems. St. Louis, MO; 2010. Available at http://www.naphsis.org/naphsis/files/ccLibraryFiles/Filename/000000001291/Pazol_Abortion%20Surveillance%206-9-10_03.ppt. Accessed September 10, 2012.
- Bachrach CA, Newcomer S. Intended pregnancies and unintended pregnancies: distinct categories or opposite ends of a continuum? Fam Plann Perspect 1999;31:251–2.
- Dott M, Rasmussen SA, Hogue CJ, Reefhuis J. Association between pregnancy intention and reproductive-health related behaviors before and after pregnancy recognition, National Birth Defects Prevention Study, 1997–2002. Matern Child Health J 2010;14:373-81.
- Klerman LV. The intendedness of pregnancy: a concept in transition. Matern Child Health J 2000;4:155–62.
- Lifflander A, Gaydos LM, Hogue CJ. Circumstances of pregnancy: low income women in Georgia describe the difference between planned and unplanned pregnancies. Matern Child Health J 2007;11:81–9.
- Sable MR, Wilkinson DS. Pregnancy intentions, pregnancy attitudes, and the use of prenatal care in Missouri. Matern Child Health J 1998;2:155–65.
- Santelli J, Rochat R, Hatfield-Timajchy K, et al. The measurement and meaning of unintended pregnancy. Perspect Sex Reprod Health 2003;35:94–101.
- Santelli JS, Lindberg LD, Orr MG, Finer LB, Speizer I. Toward a multidimensional measure of pregnancy intentions: evidence from the United States. Stud Fam Plann 2009;40:87–100.
- Trussell J, Vaughan B, Stanford J. Are all contraceptive failures unintended pregnancies? Evidence from the 1995 National Survey of Family Growth. Fam Plann Perspect 1999;31:246–7,60.
- Ventura SJ, Abma JC, Mosher WD, Henshaw SK. Estimated pregnancy rates by outcome for the United States, 1990–2004. Natl Vital Stat Rep 2008;56(15).
- Finer LB, Henshaw SK. Abortion incidence and services in the United States in 2000. Perspect Sex Reprod Health. 2003;35:6–15.
- Henshaw SK. Abortion incidence and services in the United States, 1995–1996. Fam Plann Perspect 1998;30:263–70,87.
- Jones RK, Zolna MR, Henshaw SK, Finer LB. Abortion in the United States: incidence and access to services, 2005. Perspect Sex Reprod Health 2008;40:6–16.
- Joyce TJ, Henshaw SK, Dennis A, Finer LB, Blanchard K. The impact of state mandatory counseling and waiting period laws on abortion: a literature review. New York, NY: Guttmacher Institute; 2009. Available at http://www.guttmacher.org/pubs/MandatoryCounseling.pdf. Accessed September 10, 2012.
- Dennis A, Henshaw SK, Joyce TJ, Finer LB, Blanchard K. The impact of laws requiring parental involvement for abortion: a literature review. New York, NY: Guttmacher Institute; 2009. Available at http://www.guttmacher.org/pubs/ParentalInvolvementLaws.pdf. Accessed September 10, 2012.
- Joyce T. The supply-side economics of abortion. N Engl J Med 2011;365:1466–9.
- Martinez GM, Chandra A, Abma JC, Jones J, Mosher WD. Fertility, contraception, and fatherhood: data on men and women from Cycle 6 (2002) of the National Survey of Family Growth. Vital Health Stat 2006;23(26).
- Ventura SJ. Changing patterns of nonmarital childbearing in the United States. Hyattsville, MD: US Department of Health and Human Services, CDC, National Center for Health Statistics; 2009. (NCHS data brief, no. 18).
- Moore KA. Teen births: examining the recent increase. Washington DC: The National Campaign to Prevent Teen and Unplanned Pregnancy; 2008. Available at http://www.thenationalcampaign.org/resources/pdf/teenbirths_examincrease.pdf. Accessed September 10, 2012.
- Yang Z, Gaydos LM. Reasons for and challenges of recent increases in teen birth rates: a study of family planning service policies and demographic changes at the state level. J Adolesc Health 2010;46:517–24.
- American College of Obstetricians and Gynecologists. Bad economy blamed for women delaying pregnancy and annual check-up. Washington, DC: American College of Obstetricians and Gynecologists; 2009. Available at http://www.acog.org/from_home/publications/press_releases/nr05-05-09-1.cfm; 2009. Accessed September 10, 2012.
- Guttmacher Institute. A real-time look at the impact of the recession on women's family planning and pregnancy decisions. New York, NY: Guttmacher Institute; 2009. Available at http://www.guttmacher.org/pubs/RecessionFP.pdf 2009. Accessed September 10, 2012.
- Henshaw SK. Unintended pregnancy in the United States. Fam Plann Perspect 1998;30:24–9,46.
- Piccinino LJ, Mosher WD. Trends in contraceptive use in the United States: 1982–1995. Fam Plann Perspect 1998;30:4–10,46.
- Mosher WD, Martinez GM, Chandra A, Abma JC, Willson SJ. Use of contraception and use of family planning services in the United States: 1982–2002. Adv Data 2004;350:1–36.
- Jones J, Mosher WD, Daniels K. Current contraceptive use in the United States, 2006–2010, and changes in patterns of use since 1995. Natl Vital Stat Rep 2012;60.
- Trussell, J. Contraceptive efficacy. In: Hatcher RA, Trussell J, Nelson AL, Cates W, Kowal D, Policar MS, eds. Contraceptive technology, 20th ed. Atlanta, GA: Ardent Media, Inc; 2011:779–88.
- Finer LB, Jerman J, Kavanaugh ML. Changes in use of long-acting contraceptive methods in the United States, 2007–2009. Fertil Steril 2012;98:893–7. Epub July 13, 2012.
- Secura GM, Allsworth JE, Madden T, Mullersman JL, Peipert JF. The Contraceptive CHOICE Project: reducing barriers to long-acting reversible contraception. Am J Obstet Gynecol 2010;203:115.e1–7. Available at http://www.ncbi.nlm.nih.gov/pmc/articles/PMC2910826. Accessed October 30, 2012.
- Peipert JF, Madden T, Allsworth JE, Secura GM. Preventing unintended pregnancies by providing no-cost contraception. Obstet Gyneol. 2012. Epub October 3, 2012. Available at http://journals.lww.com/greenjournal/Abstract/publishahead/Preventing_Unintended_Pregnancies_by_Providing.99945.aspx. Accessed October 30, 2012.
FIGURE 1. Number, rate, and ratio of abortions performed, by year — selected states,* United States, 2000–2009
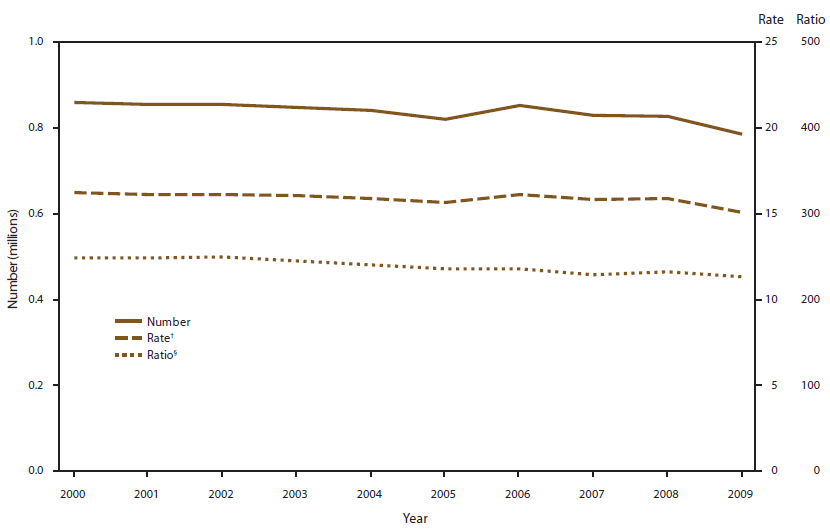
Alternate Text: This figure is a line graph that displays the data from 45 reporting areas (excluding Alaska, California, Delaware, Louisiana, Maryland, New Hampshire, and West Virginia) for 2000-2009 showing the number of abortions, the abortion rate (i.e., the number of abortions per 1,000 women aged 15-44 years), and the abortion ratio (i.e., the number of abortions per 1,000 live births) per year. From 2000 to 2009, the total number of reported abortions decreased 6% (from 826,123), the abortion rate decreased 7% (from 16.2 abortions per 1,000 women aged 15-44 years), and the abortion ratio decreased 8% (from 248 abortions per 1,000 live births).
FIGURE 2. Percentage distribution of total abortions, abortion rate, and abortion ratio, by age group of women who obtained a legal abortion — selected states,* United States, 2009
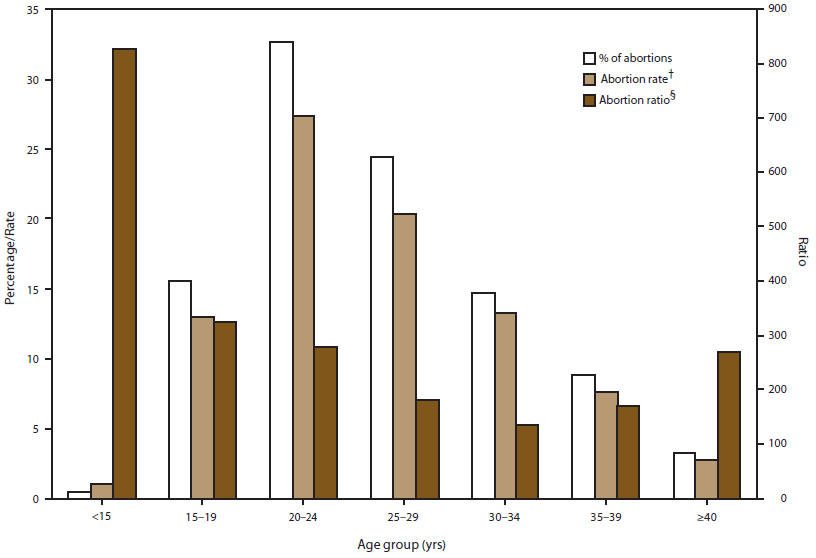
Alternate Text: This figure is a bar graph that displays data from 45 reporting areas (excluding California, Delaware, Florida, Maryland, New Hampshire, Vermont, and Wyoming) for 2009 showing the abortion rate (i.e., the number of abortions per 1,000 women aged 15-44 years, the abortion ratio (i.e., the number of abortions per 1,000 live births), and the percentage of total abortions by the age group of women who obtained a legal abortion in the United States in 2009. Women aged 20-29 years accounted for the majority (57.1%) of abortions and had the highest abortion rates (27.4 and 20.4 abortions per 1,000 women aged 20-24 and 25-29 years, respectively). Women in the youngest and oldest age groups (aged <15 or ≥40 years) accounted for the smallest percentage of abortions (0.5% and 3.3%, respectively) and had the lowest abortion rates (1.1 and 2.7 abortions per 1,000 women aged <15 and ≥40 years, respectively).
FIGURE 3. Percentage* distribution of gestational ages at time of abortion, by age group of women — selected states,† United States, 2009
Alternate Text: This figure is a bar graph that displays data from 45 reporting areas (excluding California, Delaware, Florida, Maryland, New Hampshire, Vermont, and Wyoming) for 2009 showing the abortion rate (i.e., the number of abortions per 1,000 women aged 15-44 years, the abortion ratio (i.e., the number of abortions per 1,000 live births), and the percentage of total abortions by the age group of women who obtained a legal abortion in the United States in 2009. Women aged 20-29 years accounted for the majority (57.1%) of abortions and had the highest abortion rates (27.4 and 20.4 abortions per 1,000 women aged 20-24 and 25-29 years, respectively). Women in the youngest and oldest age groups (aged <15 or ≥40 years) accounted for the smallest percentage of abortions (0.5% and 3.3%, respectively) and had the lowest abortion rates (1.1 and 2.7 abortions per 1,000 women aged <15 and ≥40 years, respectively).
|
Year
|
All reporting areas§
|
Continuously reporting areas¶
|
|
No.
|
No.
|
%**
|
Rate
|
Ratio
|
|
2000
|
857,475
|
826,123
|
96.3
|
16.2
|
248
|
|
2001
|
853,485
|
821,850
|
96.3
|
16.1
|
249
|
|
2002
|
854,122
|
823,534
|
96.4
|
16.1
|
250
|
|
2003
|
848,163
|
820,052
|
96.7
|
16.1
|
245
|
|
2004
|
839,226
|
811,381
|
96.7
|
15.9
|
241
|
|
2005
|
820,151
|
801,577
|
97.7
|
15.6
|
236
|
|
2006
|
852,385††
|
827,888
|
97.1
|
16.1
|
236
|
|
2007
|
827,609
|
812,273
|
98.1
|
15.8
|
229
|
|
2008
|
825,564
|
810,403
|
98.2
|
15.9
|
232
|
|
2009
|
784,507
|
772,630
|
98.5
|
15.1
|
227
|
|
State/Area
|
Residence
|
Occurrence
|
% obtained by out-of-state residents§
|
|
No.
|
Rate
|
Ratio
|
No.
|
Rate
|
Ratio
|
|
Alabama
|
9,749
|
10.3
|
156
|
10,882
|
11.5
|
174
|
18.2
|
|
Alaska
|
2,079
|
14.4
|
184
|
1,938
|
13.4
|
171
|
1.4
|
|
Arizona¶
|
10,298
|
7.9
|
111
|
10,271
|
7.9
|
111
|
2.4
|
|
Arkansas
|
4,820
|
8.5
|
121
|
4,580
|
8.1
|
115
|
13.5
|
|
California**
|
—
|
—
|
—
|
—
|
—
|
—
|
—
|
|
Colorado
|
10,735
|
10.4
|
156
|
11,598
|
11.3
|
169
|
8.0
|
|
Connecticut
|
13,651
|
19.8
|
351
|
13,732
|
20.0
|
353
|
3.4
|
|
Delaware**
|
—
|
—
|
—
|
—
|
—
|
—
|
—
|
|
District of Columbia††
|
1,554
|
10.3
|
172
|
2,596
|
17.2
|
287
|
51.8
|
|
Florida§§
|
—
|
—
|
—
|
81,918
|
23.5
|
370
|
—
|
|
Georgia
|
30,264
|
14.5
|
214
|
32,925
|
15.8
|
233
|
9.4
|
|
Hawaii
|
3,342
|
13.4
|
177
|
3,342
|
13.4
|
177
|
0.4
|
|
Idaho
|
2,381
|
7.8
|
100
|
1,650
|
5.4
|
70
|
4.1
|
|
Illinois
|
42,226
|
16.0
|
247
|
46,077
|
17.4
|
269
|
8.1
|
|
Indiana
|
11,687
|
9.1
|
135
|
10,557
|
8.2
|
122
|
4.5
|
|
Iowa¶
|
5,132
|
8.9
|
129
|
5,821
|
10.1
|
147
|
16.3
|
|
Kansas
|
4,987
|
9.0
|
120
|
9,410
|
17.0
|
227
|
49.9
|
|
Kentucky
|
5,799
|
6.7
|
101
|
4,120
|
4.8
|
72
|
11.0
|
|
Louisiana¶
|
7,578
|
8.1
|
117
|
8,167
|
8.8
|
126
|
2.1
|
|
Maine
|
2,355
|
9.6
|
175
|
2,413
|
9.8
|
179
|
2.3
|
|
Maryland**
|
—
|
—
|
—
|
—
|
—
|
—
|
—
|
|
Massachusetts¶
|
23,252
|
17.1
|
310
|
22,945
|
16.9
|
306
|
3.4
|
|
Michigan
|
22,175
|
11.3
|
189
|
22,357
|
11.4
|
191
|
2.4
|
|
Minnesota
|
11,908
|
11.4
|
169
|
12,388
|
11.8
|
175
|
8.0
|
|
Mississippi
|
6,193
|
10.2
|
144
|
2,438
|
4.0
|
57
|
2.6
|
|
Missouri
|
13,534
|
11.4
|
172
|
6,881
|
5.8
|
87
|
8.1
|
|
Montana
|
1,977
|
10.8
|
161
|
2,223
|
12.2
|
181
|
12.4
|
|
Nebraska
|
2,400
|
6.8
|
89
|
2,551
|
7.2
|
95
|
10.5
|
|
Nevada
|
8,892
|
16.8
|
236
|
9,540
|
18.1
|
254
|
5.8
|
|
New Hampshire**
|
—
|
—
|
—
|
—
|
—
|
—
|
—
|
|
New Jersey¶¶
|
29,231
|
17.1
|
265
|
28,519
|
16.7
|
258
|
5.3
|
|
New Mexico
|
5,414
|
13.7
|
187
|
5,022
|
12.7
|
173
|
5.0
|
|
New York
|
115,629
|
28.7
|
466
|
119,996
|
29.8
|
484
|
4.1
|
|
New York City
|
—
|
—
|
—
|
87,273
|
45.9
|
713
|
3.4
|
|
New York State
|
—
|
—
|
—
|
32,723
|
15.4
|
260
|
6.1
|
|
North Carolina
|
26,300
|
13.8
|
207
|
30,596
|
16.0
|
241
|
16.4
|
|
North Dakota
|
926
|
7.3
|
103
|
1,290
|
10.1
|
143
|
35.6
|
|
Ohio
|
27,604
|
12.2
|
191
|
28,721
|
12.6
|
198
|
6.1
|
|
Oklahoma
|
6,615
|
9.1
|
121
|
6,430
|
8.8
|
118
|
6.0
|
|
Oregon
|
9,893
|
13.1
|
210
|
10,801
|
14.3
|
229
|
11.0
|
|
Pennsylvania
|
37,901
|
15.5
|
259
|
37,284
|
15.3
|
255
|
4.3
|
|
Rhode Island
|
3,512
|
16.5
|
307
|
4,326
|
20.3
|
378
|
22.3
|
|
South Carolina
|
11,762
|
12.9
|
194
|
6,911
|
7.6
|
114
|
4.3
|
|
South Dakota
|
883
|
5.8
|
74
|
769
|
5.0
|
64
|
15.2
|
|
Tennessee
|
14,350
|
11.3
|
175
|
17,474
|
13.8
|
213
|
23.1
|
|
Texas
|
74,962
|
14.5
|
186
|
77,630
|
15.0
|
193
|
3.3
|
|
Utah
|
3,448
|
5.7
|
64
|
3,665
|
6.0
|
68
|
10.8
|
|
Vermont
|
1,246
|
10.4
|
204
|
1,319
|
11.0
|
216
|
7.0
|
|
Virginia
|
27,084
|
16.6
|
258
|
27,442
|
16.8
|
261
|
7.0
|
|
Washington
|
22,675
|
16.9
|
254
|
22,672
|
16.9
|
254
|
4.7
|
|
West Virginia
|
2,169
|
6.3
|
102
|
1,772
|
5.1
|
83
|
11.4
|
|
Wisconsin
|
9,600
|
8.6
|
136
|
8,542
|
7.7
|
121
|
2.8
|
|
Wyoming
|
782
|
7.4
|
99
|
—***
|
—†††
|
—†††
|
0.0
|
|
Canada
|
111
|
NA
|
NA
|
NA
|
NA
|
NA
|
NA
|
|
Mexico
|
666
|
NA
|
NA
|
NA
|
NA
|
NA
|
NA
|
|
Other country or territory
|
179
|
NA
|
NA
|
NA
|
NA
|
NA
|
NA
|
|
State/Area
|
Residence
|
Occurrence
|
% obtained by out-of-state residents§
|
|
No.
|
Rate
|
Ratio
|
No.
|
Rate
|
Ratio
|
|
Total known residence
|
694,882
|
NA
|
NA
|
NA
|
NA
|
NA
|
8.0
|
|
Percentage reported by known residence
|
88.6
|
NA
|
NA
|
NA
|
NA
|
NA
|
NA
|
|
Total unknown residence
|
89,625
|
NA
|
NA
|
NA
|
NA
|
NA
|
NA
|
|
Out of state, exact residence not stated
|
3,744
|
NA
|
NA
|
NA
|
NA
|
NA
|
NA
|
|
No information provided on residence
|
85,881
|
NA
|
NA
|
NA
|
NA
|
NA
|
NA
|
|
Percentage reported by unknown residence
|
11.4
|
NA
|
NA
|
NA
|
NA
|
NA
|
NA
|
|
Total
|
784,507
|
N/A
|
N/A
|
N/A
|
N/A
|
N/A
|
NA
|
|
State/Area
|
Age group (yrs)
|
Total abortions reported by known age
|
|
<15
|
15–19
|
20–24
|
25–29
|
30–34
|
35–39
|
≥40
|
No.
|
% of all reported abortions§
|
|
No.
|
(%)†
|
No.
|
(%)
|
No.
|
(%)
|
No.
|
(%)
|
No.
|
(%)
|
No.
|
(%)
|
No.
|
(%)
|
|
Alabama
|
84
|
(0.8)
|
1,790
|
(16.4)
|
3,766
|
(34.6)
|
2,661
|
(24.5)
|
1,481
|
(13.6)
|
864
|
(7.9)
|
236
|
(2.2)
|
10,882
|
(100.0)
|
|
Alaska
|
7
|
(0.4)
|
340
|
(17.6)
|
637
|
(33.0)
|
486
|
(25.2)
|
233
|
(12.1)
|
173
|
(9.0)
|
52
|
(2.7)
|
1,928
|
(99.5)
|
|
Arizona
|
24
|
(0.2)
|
1,518
|
(15.2)
|
3,447
|
(34.4)
|
2,427
|
(24.2)
|
1,409
|
(14.1)
|
897
|
(9.0)
|
294
|
(2.9)
|
10,016
|
(97.5)
|
|
Arkansas
|
35
|
(0.8)
|
739
|
(16.2)
|
1,495
|
(32.7)
|
1,148
|
(25.1)
|
642
|
(14.0)
|
395
|
(8.6)
|
119
|
(2.6)
|
4,573
|
(99.8)
|
|
Colorado
|
50
|
(0.4)
|
1,885
|
(16.3)
|
3,870
|
(33.4)
|
2,743
|
(23.7)
|
1,616
|
(14.0)
|
996
|
(8.6)
|
414
|
(3.6)
|
11,574
|
(99.8)
|
|
Connecticut
|
60
|
(0.4)
|
2,328
|
(17.4)
|
4,495
|
(33.5)
|
3,131
|
(23.3)
|
1,841
|
(13.7)
|
1,132
|
(8.4)
|
424
|
(3.2)
|
13,411
|
(97.7)
|
|
District of Columbia¶
|
15
|
(0.6)
|
426
|
(16.4)
|
824
|
(31.8)
|
666
|
(25.7)
|
381
|
(14.7)
|
202
|
(7.8)
|
81
|
(3.1)
|
2,595
|
(100.0)
|
|
Georgia
|
213
|
(0.6)
|
4,599
|
(14.0)
|
10,020
|
(30.4)
|
8,449
|
(25.7)
|
5,332
|
(16.2)
|
3,283
|
(10.0)
|
1,029
|
(3.1)
|
32,925
|
(100.0)
|
|
Hawaii
|
22
|
(0.7)
|
593
|
(17.8)
|
1,059
|
(31.8)
|
800
|
(24.0)
|
435
|
(13.0)
|
298
|
(8.9)
|
127
|
(3.8)
|
3,334
|
(99.8)
|
|
Idaho
|
6
|
(0.4)
|
283
|
(17.2)
|
562
|
(34.1)
|
353
|
(21.4)
|
229
|
(13.9)
|
143
|
(8.7)
|
74
|
(4.5)
|
1,650
|
(100.0)
|
|
Illinois**
|
257
|
(0.6)
|
6,955
|
(16.9)
|
12,664
|
(30.7)
|
9,901
|
(24.0)
|
6,293
|
(15.3)
|
3,781
|
(9.2)
|
1,333
|
(3.2)
|
41,184
|
(99.7)
|
|
Indiana
|
61
|
(0.6)
|
1,671
|
(15.8)
|
3,575
|
(33.9)
|
2,509
|
(23.8)
|
1,527
|
(14.5)
|
918
|
(8.7)
|
287
|
(2.7)
|
10,548
|
(99.9)
|
|
Iowa
|
35
|
(0.6)
|
1,036
|
(17.8)
|
1,935
|
(33.2)
|
1,358
|
(23.3)
|
801
|
(13.8)
|
475
|
(8.2)
|
181
|
(3.1)
|
5,821
|
(100.0)
|
|
Kansas
|
43
|
(0.5)
|
1,427
|
(15.2)
|
3,127
|
(33.2)
|
2,381
|
(25.3)
|
1,364
|
(14.5)
|
802
|
(8.5)
|
266
|
(2.8)
|
9,410
|
(100.0)
|
|
Kentucky
|
28
|
(0.7)
|
691
|
(16.8)
|
1,296
|
(31.5)
|
973
|
(23.6)
|
612
|
(14.9)
|
377
|
(9.2)
|
143
|
(3.5)
|
4,120
|
(100.0)
|
|
Louisiana
|
62
|
(0.8)
|
1,270
|
(16.4)
|
2,739
|
(35.4)
|
1,919
|
(24.8)
|
1,023
|
(13.2)
|
562
|
(7.3)
|
171
|
(2.2)
|
7,746
|
(94.8)
|
|
Maine
|
7
|
(0.3)
|
397
|
(16.5)
|
853
|
(35.4)
|
603
|
(25.0)
|
280
|
(11.6)
|
193
|
(8.0)
|
80
|
(3.3)
|
2,413
|
(100.0)
|
|
Massachusetts
|
72
|
(0.3)
|
3,338
|
(14.5)
|
7,673
|
(33.4)
|
5,434
|
(23.7)
|
3,260
|
(14.2)
|
2,187
|
(9.5)
|
981
|
(4.3)
|
22,945
|
(100.0)
|
|
Michigan
|
107
|
(0.5)
|
4,094
|
(18.3)
|
7,447
|
(33.3)
|
5,067
|
(22.7)
|
3,094
|
(13.8)
|
1,883
|
(8.4)
|
648
|
(2.9)
|
22,340
|
(99.9)
|
|
Minnesota
|
46
|
(0.4)
|
1,740
|
(14.0)
|
4,187
|
(33.8)
|
3,131
|
(25.3)
|
1,781
|
(14.4)
|
1,082
|
(8.7)
|
420
|
(3.4)
|
12,387
|
(100.0)
|
|
Mississippi
|
19
|
(0.8)
|
365
|
(15.0)
|
883
|
(36.2)
|
652
|
(26.7)
|
326
|
(13.4)
|
151
|
(6.2)
|
42
|
(1.7)
|
2,438
|
(100.0)
|
|
Missouri
|
22
|
(0.3)
|
1,089
|
(15.8)
|
2,429
|
(35.3)
|
1,631
|
(23.7)
|
978
|
(14.2)
|
525
|
(7.6)
|
207
|
(3.0)
|
6,881
|
(100.0)
|
|
Montana
|
8
|
(0.4)
|
395
|
(17.8)
|
736
|
(33.1)
|
540
|
(24.3)
|
285
|
(12.8)
|
188
|
(8.5)
|
70
|
(3.2)
|
2,222
|
(100.0)
|
|
Nebraska
|
10
|
(0.4)
|
407
|
(16.0)
|
880
|
(34.5)
|
578
|
(22.7)
|
376
|
(14.7)
|
207
|
(8.1)
|
93
|
(3.6)
|
2,551
|
(100.0)
|
|
Nevada
|
45
|
(0.5)
|
1,392
|
(15.1)
|
2,763
|
(30.0)
|
2,255
|
(24.5)
|
1,480
|
(16.1)
|
965
|
(10.5)
|
321
|
(3.5)
|
9,221
|
(96.7)
|
|
New Jersey††
|
86
|
(0.3)
|
3,994
|
(14.0)
|
8,981
|
(31.5)
|
7,174
|
(25.2)
|
4,444
|
(15.6)
|
2,674
|
(9.4)
|
1,162
|
(4.1)
|
28,515
|
(100.0)
|
|
New Mexico
|
39
|
(0.8)
|
935
|
(18.6)
|
1,663
|
(33.1)
|
1,163
|
(23.2)
|
626
|
(12.5)
|
361
|
(7.2)
|
235
|
(4.7)
|
5,022
|
(100.0)
|
|
New York
|
621
|
(0.5)
|
19,768
|
(16.6)
|
36,617
|
(30.7)
|
29,085
|
(24.4)
|
18,434
|
(15.4)
|
10,710
|
(9.0)
|
4,203
|
(3.5)
|
119,438
|
(99.5)
|
|
New York City
|
461
|
(0.5)
|
13,577
|
(15.6)
|
25,365
|
(29.2)
|
21,702
|
(25.0)
|
14,330
|
(16.5)
|
8,324
|
(9.6)
|
3,176
|
(3.7)
|
86,935
|
(99.6)
|
|
New York State
|
160
|
(0.5)
|
6,191
|
(19.0)
|
11,252
|
(34.6)
|
7,383
|
(22.7)
|
4,104
|
(12.6)
|
2,386
|
(7.3)
|
1,027
|
(3.2)
|
32,503
|
(99.3)
|
|
North Carolina
|
159
|
(0.5)
|
4,635
|
(15.7)
|
10,045
|
(34.0)
|
7,136
|
(24.2)
|
4,322
|
(14.6)
|
2,459
|
(8.3)
|
755
|
(2.6)
|
29,511
|
(96.5)
|
|
North Dakota
|
7
|
(0.5)
|
212
|
(16.4)
|
473
|
(36.7)
|
334
|
(25.9)
|
153
|
(11.9)
|
85
|
(6.6)
|
26
|
(2.0)
|
1,290
|
(100.0)
|
|
Ohio
|
190
|
(0.7)
|
4,743
|
(16.7)
|
9,739
|
(34.3)
|
6,547
|
(23.1)
|
4,021
|
(14.2)
|
2,389
|
(8.4)
|
766
|
(2.7)
|
28,395
|
(98.9)
|
|
Oklahoma
|
62
|
(1.0)
|
1,059
|
(16.7)
|
2,123
|
(33.5)
|
1,467
|
(23.1)
|
928
|
(14.6)
|
508
|
(8.0)
|
192
|
(3.0)
|
6,339
|
(98.6)
|
|
Oregon
|
37
|
(0.3)
|
1,737
|
(16.1)
|
3,373
|
(31.4)
|
2,619
|
(24.3)
|
1,595
|
(14.8)
|
1,022
|
(9.5)
|
374
|
(3.5)
|
10,757
|
(99.6)
|
|
Pennsylvania**
|
201
|
(0.6)
|
5,869
|
(16.5)
|
12,438
|
(34.9)
|
8,276
|
(23.2)
|
4,876
|
(13.7)
|
2,877
|
(8.1)
|
1,135
|
(3.2)
|
35,672
|
(100.0)
|
|
Rhode Island
|
27
|
(0.6)
|
705
|
(16.3)
|
1,516
|
(35.0)
|
973
|
(22.5)
|
611
|
(14.1)
|
388
|
(9.0)
|
106
|
(2.5)
|
4,326
|
(100.0)
|
|
South Carolina
|
37
|
(0.5)
|
1,202
|
(17.4)
|
2,255
|
(32.7)
|
1,647
|
(23.9)
|
1,003
|
(14.5)
|
562
|
(8.1)
|
199
|
(2.9)
|
6,905
|
(99.9)
|
|
South Dakota
|
—§§
|
—
|
131
|
(17.0)
|
266
|
(34.6)
|
185
|
(24.1)
|
106
|
(13.8)
|
59
|
(7.7)
|
—
|
—
|
769
|
(100.0)
|
|
Tennessee
|
83
|
(0.5)
|
2,622
|
(15.1)
|
5,921
|
(34.1)
|
4,408
|
(25.4)
|
2,448
|
(14.1)
|
1,460
|
(8.4)
|
440
|
(2.5)
|
17,382
|
(99.5)
|
|
Texas
|
210
|
(0.3)
|
9,446
|
(12.2)
|
25,948
|
(33.5)
|
20,232
|
(26.1)
|
11,834
|
(15.3)
|
7,093
|
(9.2)
|
2,707
|
(3.5)
|
77,470
|
(99.8)
|
|
Utah
|
21
|
(0.6)
|
519
|
(14.3)
|
1,152
|
(31.8)
|
868
|
(24.0)
|
570
|
(15.7)
|
366
|
(10.1)
|
128
|
(3.5)
|
3,624
|
(98.9)
|
|
Virginia
|
116
|
(0.4)
|
3,519
|
(13.0)
|
8,843
|
(32.5)
|
6,908
|
(25.4)
|
4,289
|
(15.8)
|
2,585
|
(9.5)
|
909
|
(3.3)
|
27,169
|
(99.0)
|
|
Washington
|
82
|
(0.4)
|
3,841
|
(17.0)
|
7,430
|
(32.8)
|
5,388
|
(23.8)
|
3,131
|
(13.8)
|
1,957
|
(8.6)
|
821
|
(3.6)
|
22,650
|
(99.9)
|
|
West Virginia
|
10
|
(0.6)
|
302
|
(17.1)
|
589
|
(33.3)
|
433
|
(24.4)
|
270
|
(15.2)
|
129
|
(7.3)
|
38
|
(2.1)
|
1,771
|
(99.9)
|
|
Wisconsin**
|
51
|
(0.6)
|
1,318
|
(15.9)
|
2,851
|
(34.4)
|
2,119
|
(25.5)
|
1,078
|
(13.0)
|
630
|
(7.6)
|
252
|
(3.0)
|
8,299
|
(100.0)
|
|
Total
|
3,377¶¶
|
(0.5)
|
107,325
|
(15.5)
|
225,585
|
(32.7)
|
168,758
|
(24.4)
|
101,818
|
(14.7)
|
60,993
|
(8.8)
|
22,541¶¶
|
(3.3)
|
690,419
|
(99.4)
|
|
Abortion rate***
|
1.1
|
|
13.0
|
|
27.4
|
|
20.4
|
|
13.3
|
|
7.6
|
|
2.7
|
|
14.2
|
|
|
Abortion ratio†††
|
827
|
|
327
|
|
280
|
|
182
|
|
137
|
|
171
|
|
272
|
|
213
|
|
|
Age (yrs)
|
Year
|
% change
|
|
2000
|
2001
|
2002
|
2003
|
2004
|
2005
|
2006
|
2007
|
2008
|
2009
|
2000 to 2004
|
2005 to 2009
|
2008 to 2009
|
2000 to 2009
|
|
% of abortions
|
|
<15
|
0.6
|
0.6
|
0.6
|
0.6
|
0.6
|
0.6
|
0.5
|
0.5
|
0.5
|
0.5
|
0.0
|
-16.7
|
0.0
|
-16.7
|
|
15–19
|
18.2
|
17.6
|
16.9
|
16.8
|
16.7
|
16.6
|
16.6
|
16.6
|
16.2
|
15.6
|
-8.2
|
-6.0
|
-3.7
|
-14.3
|
|
20–24
|
33.0
|
33.5
|
33.5
|
33.7
|
33.3
|
33.0
|
32.9
|
32.8
|
32.9
|
32.8
|
0.9
|
-0.6
|
-0.3
|
-0.6
|
|
25–29
|
23.1
|
22.7
|
22.8
|
22.8
|
23.2
|
23.7
|
24.2
|
24.3
|
24.5
|
24.6
|
0.4
|
3.8
|
0.4
|
6.5
|
|
30–34
|
14.3
|
14.8
|
15.0
|
15.0
|
14.9
|
14.7
|
14.3
|
14.2
|
14.4
|
14.8
|
4.2
|
0.7
|
2.8
|
3.5
|
|
35–39
|
8.5
|
8.5
|
8.5
|
8.5
|
8.6
|
8.8
|
8.9
|
8.9
|
8.9
|
8.9
|
1.2
|
1.1
|
0.0
|
4.7
|
|
≥40
|
2.9
|
3.0
|
3.2
|
3.2
|
3.2
|
3.3
|
3.2
|
3.2
|
3.1
|
3.3
|
10.3
|
0.0
|
6.5
|
13.8
|
|
Abortion rate†
|
|
<15
|
1.6
|
1.5
|
1.4
|
1.4
|
1.3
|
1.3
|
1.2
|
1.2
|
1.2
|
1.1
|
-18.8
|
-15.4
|
-8.3
|
-31.3
|
|
15–19
|
17.4
|
16.8
|
16.1
|
15.9
|
15.4
|
14.8
|
15.0
|
14.7
|
14.4
|
13.2
|
-11.5
|
-10.8
|
-8.3
|
-24.1
|
|
20–24
|
33.3
|
32.5
|
31.8
|
31.2
|
30.2
|
29.4
|
30.3
|
29.8
|
30.0
|
27.7
|
-9.3
|
-5.8
|
-7.7
|
-16.8
|
|
25–29
|
22.7
|
22.9
|
23.2
|
22.9
|
22.4
|
21.8
|
22.5
|
21.8
|
21.9
|
20.6
|
-1.3
|
-5.5
|
-5.9
|
-9.3
|
|
30–34
|
13.4
|
13.6
|
13.7
|
13.8
|
13.7
|
13.5
|
13.9
|
13.7
|
13.9
|
13.5
|
2.2
|
0.0
|
-2.9
|
0.7
|
|
35–39
|
7.1
|
7.2
|
7.4
|
7.5
|
7.6
|
7.7
|
8.0
|
7.9
|
7.9
|
7.7
|
7.0
|
0.0
|
-2.5
|
8.5
|
|
≥40
|
2.4
|
2.5
|
2.6
|
2.6
|
2.6
|
2.6
|
2.6
|
2.7
|
2.7
|
2.8
|
8.3
|
7.7
|
3.7
|
16.7
|
|
Abortion ratio§
|
|
<15
|
714
|
751
|
769
|
846
|
790
|
774
|
764
|
781
|
810
|
838
|
10.6
|
8.3
|
3.5
|
17.4
|
|
15–19
|
365
|
370
|
374
|
380
|
372
|
363
|
357
|
343
|
344
|
333
|
1.9
|
-8.3
|
-3.2
|
-8.8
|
|
20–24
|
303
|
307
|
307
|
304
|
297
|
287
|
284
|
279
|
288
|
286
|
-2.0
|
-0.3
|
-0.7
|
-5.6
|
|
25–29
|
199
|
201
|
202
|
197
|
194
|
189
|
191
|
185
|
189
|
185
|
-2.5
|
-2.1
|
-2.1
|
-7.0
|
|
30–34
|
147
|
148
|
150
|
146
|
144
|
142
|
143
|
138
|
142
|
138
|
-2.0
|
-2.8
|
-2.8
|
-6.1
|
|
35–39
|
183
|
183
|
183
|
177
|
173
|
172
|
174
|
171
|
175
|
172
|
-5.5
|
0.0
|
-1.7
|
-6.0
|
|
≥40
|
307
|
310
|
317
|
299
|
293
|
285
|
284
|
280
|
273
|
274
|
-4.6
|
-3.9
|
0.4
|
-10.7
|
|
Total (no.)
|
724,575
|
724,167
|
722,786
|
722,071
|
710,085
|
698,263
|
718,048
|
708,350
|
712,061
|
678,974
|
—
|
—
|
—
|
—
|
|
State/Area
|
Age (yrs)
|
Total no.
|
|
<15
|
15
|
16
|
17
|
18
|
19
|
|
No.
|
(%)†
|
No.
|
(%)
|
No.
|
(%)
|
No.
|
(%)
|
No.
|
(%)
|
No.
|
(%)
|
|
Alabama
|
84
|
(4.5)
|
134
|
(7.2)
|
218
|
(11.6)
|
293
|
(15.6)
|
489
|
(26.1)
|
656
|
(35.0)
|
1,874
|
|
Alaska
|
7
|
(2.0)
|
17
|
(4.9)
|
37
|
(10.7)
|
64
|
(18.4)
|
106
|
(30.5)
|
116
|
(33.4)
|
347
|
|
Arizona
|
24
|
(1.6)
|
75
|
(4.9)
|
130
|
(8.4)
|
214
|
(13.9)
|
512
|
(33.2)
|
587
|
(38.1)
|
1,542
|
|
Arkansas
|
35
|
(4.5)
|
49
|
(6.3)
|
95
|
(12.3)
|
131
|
(16.9)
|
229
|
(29.6)
|
235
|
(30.4)
|
774
|
|
Colorado
|
50
|
(2.6)
|
88
|
(4.5)
|
202
|
(10.4)
|
303
|
(15.7)
|
591
|
(30.5)
|
701
|
(36.2)
|
1,935
|
|
Connecticut
|
60
|
(2.5)
|
123
|
(5.2)
|
251
|
(10.5)
|
480
|
(20.1)
|
631
|
(26.4)
|
843
|
(35.3)
|
2,388
|
|
District of Columbia§
|
15
|
(3.4)
|
36
|
(8.2)
|
45
|
(10.2)
|
95
|
(21.5)
|
100
|
(22.7)
|
150
|
(34.0)
|
441
|
|
Georgia
|
213
|
(4.4)
|
302
|
(6.3)
|
536
|
(11.1)
|
742
|
(15.4)
|
1,316
|
(27.3)
|
1,703
|
(35.4)
|
4,812
|
|
Hawaii
|
22
|
(3.6)
|
37
|
(6.0)
|
73
|
(11.9)
|
97
|
(15.8)
|
179
|
(29.1)
|
207
|
(33.7)
|
615
|
|
Idaho
|
6
|
(2.1)
|
11
|
(3.8)
|
34
|
(11.8)
|
40
|
(13.8)
|
85
|
(29.4)
|
113
|
(39.1)
|
289
|
|
Indiana
|
61
|
(3.5)
|
122
|
(7.0)
|
180
|
(10.4)
|
265
|
(15.3)
|
515
|
(29.7)
|
589
|
(34.0)
|
1,732
|
|
Iowa
|
35
|
(3.3)
|
46
|
(4.3)
|
123
|
(11.5)
|
174
|
(16.2)
|
313
|
(29.2)
|
380
|
(35.5)
|
1,071
|
|
Kansas
|
43
|
(2.9)
|
87
|
(5.9)
|
166
|
(11.3)
|
234
|
(15.9)
|
387
|
(26.3)
|
553
|
(37.6)
|
1,470
|
|
Kentucky
|
28
|
(3.9)
|
34
|
(4.7)
|
93
|
(12.9)
|
137
|
(19.1)
|
201
|
(28.0)
|
225
|
(31.3)
|
718
|
|
Maine
|
7
|
(1.7)
|
18
|
(4.5)
|
50
|
(12.4)
|
64
|
(15.8)
|
127
|
(31.4)
|
138
|
(34.2)
|
404
|
|
Massachusetts
|
72
|
(2.1)
|
180
|
(5.3)
|
297
|
(8.7)
|
534
|
(15.7)
|
968
|
(28.4)
|
1,359
|
(39.9)
|
3,410
|
|
Michigan
|
107
|
(2.5)
|
247
|
(5.9)
|
433
|
(10.3)
|
682
|
(16.2)
|
1,226
|
(29.2)
|
1,506
|
(35.8)
|
4,201
|
|
Minnesota
|
46
|
(2.6)
|
82
|
(4.6)
|
173
|
(9.7)
|
278
|
(15.6)
|
504
|
(28.2)
|
703
|
(39.4)
|
1,786
|
|
Mississippi
|
19
|
(4.9)
|
19
|
(4.9)
|
24
|
(6.3)
|
53
|
(13.8)
|
116
|
(30.2)
|
153
|
(39.8)
|
384
|
|
Missouri
|
22
|
(2.0)
|
75
|
(6.8)
|
112
|
(10.1)
|
144
|
(13.0)
|
338
|
(30.4)
|
420
|
(37.8)
|
1,111
|
|
Montana
|
8
|
(2.0)
|
21
|
(5.2)
|
44
|
(10.9)
|
78
|
(19.4)
|
113
|
(28.0)
|
139
|
(34.5)
|
403
|
|
Nebraska
|
10
|
(2.4)
|
30
|
(7.2)
|
53
|
(12.7)
|
57
|
(13.7)
|
105
|
(25.2)
|
162
|
(38.8)
|
417
|
|
Nevada
|
45
|
(3.1)
|
82
|
(5.7)
|
141
|
(9.8)
|
284
|
(19.8)
|
421
|
(29.3)
|
464
|
(32.3)
|
1,437
|
|
New Jersey¶
|
86
|
(2.1)
|
203
|
(5.0)
|
472
|
(11.6)
|
751
|
(18.4)
|
1,130
|
(27.7)
|
1,438
|
(35.2)
|
4,080
|
|
New Mexico
|
39
|
(4.0)
|
59
|
(6.1)
|
120
|
(12.3)
|
193
|
(19.8)
|
265
|
(27.2)
|
298
|
(30.6)
|
974
|
|
New York
|
621
|
(3.0)
|
1,167
|
(5.7)
|
2,349
|
(11.5)
|
3,930
|
(19.3)
|
5,528
|
(27.1)
|
6,794
|
(33.3)
|
20,389
|
|
New York City
|
461
|
(3.3)
|
829
|
(5.9)
|
1,663
|
(11.8)
|
2,693
|
(19.2)
|
3,777
|
(26.9)
|
4,615
|
(32.9)
|
14,038
|
|
New York State
|
160
|
(2.5)
|
338
|
(5.3)
|
686
|
(10.8)
|
1,237
|
(19.5)
|
1,751
|
(27.6)
|
2,179
|
(34.3)
|
6,351
|
|
North Carolina
|
159
|
(3.3)
|
298
|
(6.2)
|
450
|
(9.4)
|
729
|
(15.2)
|
1,376
|
(28.7)
|
1,782
|
(37.2)
|
4,794
|
|
North Dakota
|
7
|
(3.2)
|
15
|
(6.8)
|
18
|
(8.2)
|
41
|
(18.7)
|
56
|
(25.6)
|
82
|
(37.4)
|
219
|
|
Ohio
|
190
|
(3.9)
|
327
|
(6.6)
|
522
|
(10.6)
|
780
|
(15.8)
|
1,395
|
(28.3)
|
1,719
|
(34.8)
|
4,933
|
|
Oklahoma
|
62
|
(5.5)
|
73
|
(6.5)
|
127
|
(11.3)
|
172
|
(15.3)
|
301
|
(26.9)
|
386
|
(34.4)
|
1,121
|
|
Oregon
|
37
|
(2.1)
|
93
|
(5.2)
|
181
|
(10.2)
|
313
|
(17.6)
|
511
|
(28.8)
|
639
|
(36.0)
|
1,774
|
|
Rhode Island
|
27
|
(3.7)
|
33
|
(4.5)
|
58
|
(7.9)
|
108
|
(14.8)
|
227
|
(31.0)
|
279
|
(38.1)
|
732
|
|
South Carolina
|
37
|
(3.0)
|
72
|
(5.8)
|
118
|
(9.5)
|
269
|
(21.7)
|
333
|
(26.9)
|
410
|
(33.1)
|
1,239
|
|
South Dakota
|
—**
|
—
|
—
|
—
|
11
|
(8.3)
|
27
|
(20.3)
|
40
|
(30.1)
|
50
|
(37.6)
|
133
|
|
Tennessee
|
83
|
(3.1)
|
164
|
(6.1)
|
298
|
(11.0)
|
433
|
(16.0)
|
717
|
(26.5)
|
1,010
|
(37.3)
|
2,705
|
|
Texas
|
210
|
(2.2)
|
443
|
(4.6)
|
914
|
(9.5)
|
1,513
|
(15.7)
|
2,598
|
(26.9)
|
3,978
|
(41.2)
|
9,656
|
|
Utah
|
21
|
(3.9)
|
30
|
(5.6)
|
45
|
(8.3)
|
77
|
(14.3)
|
161
|
(29.8)
|
206
|
(38.1)
|
540
|
|
Virginia
|
116
|
(3.2)
|
188
|
(5.2)
|
353
|
(9.7)
|
519
|
(14.3)
|
1,080
|
(29.7)
|
1,379
|
(37.9)
|
3,635
|
|
Washington
|
82
|
(2.1)
|
211
|
(5.4)
|
413
|
(10.5)
|
753
|
(19.2)
|
1,118
|
(28.5)
|
1,346
|
(34.3)
|
3,923
|
|
West Virginia
|
10
|
(3.2)
|
20
|
(6.4)
|
30
|
(9.6)
|
50
|
(16.0)
|
105
|
(33.7)
|
97
|
(31.1)
|
312
|
|
Wisconsin††
|
51
|
(3.7)
|
84
|
(6.1)
|
149
|
(10.9)
|
211
|
(15.4)
|
384
|
(28.0)
|
490
|
(35.8)
|
1,369
|
|
Total
|
2,857§§
|
(3.0)
|
5,395§§
|
(5.6)
|
10,138
|
(10.6)
|
16,312
|
(17.0)
|
26,897
|
(28.0)
|
34,485
|
(35.9)
|
96,089
|
|
Abortion rate¶¶
|
1.0
|
|
3.9
|
|
7.2
|
|
11.3
|
|
18.4
|
|
22.9
|
|
9.7
|
|
Abortion ratio***
|
785
|
|
491
|
|
380
|
|
324
|
|
321
|
|
288
|
|
326
|
|
Age (yrs)
|
Year
|
% change
|
|
2000
|
2001
|
2002
|
2003
|
2004
|
2005
|
2006
|
2007
|
2008
|
2009
|
2000 to 2004
|
2005 to 2009
|
2008 to 2009
|
2000 to 2009
|
|
% of abortions
|
|
<15
|
3.4
|
3.3
|
3.4
|
3.4
|
3.3
|
3.3
|
3.0
|
3.1
|
3.0
|
3.0
|
-2.9
|
-9.1
|
0.0
|
-11.8
|
|
15
|
6.3
|
6.0
|
6.2
|
6.2
|
6.1
|
6.4
|
6.1
|
5.9
|
5.8
|
5.6
|
-3.2
|
-12.5
|
-3.4
|
-11.1
|
|
16
|
11.4
|
11.4
|
11.6
|
11.7
|
11.5
|
11.5
|
11.7
|
11.3
|
10.8
|
10.6
|
0.9
|
-7.8
|
-1.9
|
-7.0
|
|
17
|
17.4
|
17.4
|
17.5
|
17.5
|
17.2
|
17.4
|
17.4
|
17.5
|
17.3
|
17.0
|
-1.1
|
-2.3
|
-1.7
|
-2.3
|
|
18
|
28.1
|
27.8
|
27.6
|
28.0
|
28.0
|
27.6
|
27.8
|
28.0
|
28.2
|
27.9
|
-0.4
|
1.1
|
-1.1
|
-0.7
|
|
19
|
33.5
|
34.1
|
33.8
|
33.2
|
33.9
|
33.8
|
33.9
|
34.2
|
34.9
|
35.9
|
1.2
|
6.2
|
2.9
|
7.2
|
|
Abortion rate†
|
|
<15
|
1.5
|
1.4
|
1.4
|
1.3
|
1.3
|
1.3
|
1.2
|
1.2
|
1.1
|
1.0
|
-13.3
|
-23.1
|
-9.1
|
-33.3
|
|
15
|
5.7
|
5.2
|
5.1
|
5.1
|
4.8
|
4.8
|
4.6
|
4.5
|
4.3
|
3.9
|
-15.8
|
-18.8
|
-9.3
|
-31.6
|
|
16
|
10.5
|
9.9
|
9.6
|
9.6
|
9.1
|
8.8
|
8.7
|
8.4
|
7.9
|
7.2
|
-13.3
|
-18.2
|
-8.9
|
-31.4
|
|
17
|
15.7
|
15.2
|
14.5
|
14.5
|
13.7
|
13.4
|
13.5
|
12.8
|
12.5
|
11.3
|
-12.7
|
-15.7
|
-9.6
|
-28.0
|
|
18
|
25.2
|
24.2
|
23.1
|
23.2
|
22.2
|
21.5
|
22.2
|
21.5
|
20.4
|
18.4
|
-11.9
|
-14.4
|
-9.8
|
-27.0
|
|
19
|
29.2
|
29.3
|
28.2
|
27.6
|
26.8
|
26.1
|
27.0
|
26.4
|
25.9
|
23.0
|
-8.2
|
-11.9
|
-11.2
|
-21.2
|
|
Abortion ratio§
|
|
<15
|
693
|
731
|
744
|
825
|
754
|
766
|
735
|
750
|
759
|
781
|
8.8
|
2.0
|
2.9
|
12.7
|
|
15
|
503
|
511
|
545
|
553
|
523
|
538
|
522
|
493
|
507
|
495
|
4.0
|
-8.0
|
-2.4
|
-1.6
|
|
16
|
412
|
424
|
440
|
460
|
432
|
432
|
428
|
406
|
389
|
381
|
4.9
|
-11.8
|
-2.1
|
-7.5
|
|
17
|
348
|
367
|
367
|
378
|
362
|
360
|
353
|
342
|
334
|
326
|
4.0
|
-9.4
|
-2.4
|
-6.3
|
|
18
|
368
|
370
|
377
|
385
|
373
|
362
|
353
|
337
|
336
|
321
|
1.4
|
-11.3
|
-4.5
|
-12.8
|
|
19
|
324
|
329
|
325
|
329
|
321
|
312
|
306
|
294
|
297
|
289
|
-0.9
|
-7.4
|
-2.7
|
-10.8
|
|
Total (no.)
|
119,846
|
115,308
|
111,271
|
110,554
|
107,451
|
105,516
|
107,711
|
105,883
|
103,056
|
94,699
|
—
|
—
|
—
|
—
|
|
State/Area
|
Weeks of gestation
|
Total abortions reported by known gestational age
|
|
≤8
|
9–13
|
14–15
|
16–17
|
18–20
|
≥21
|
No.
|
% of all reported abortions¶
|
|
No.
|
(%)§
|
No.
|
(%)
|
No.
|
(%)
|
No.
|
(%)
|
No.
|
(%)
|
No.
|
(%)
|
|
Alabama
|
6,569
|
(60.4)
|
3,336
|
(30.7)
|
423
|
(3.9)
|
281
|
(2.6)
|
246
|
(2.3)
|
12
|
(0.1)
|
10,867
|
(99.9)
|
|
Alaska
|
1,184
|
(61.1)
|
732
|
(37.8)
|
—**
|
—
|
0
|
(0.0)
|
—
|
—
|
16
|
(0.8)
|
1,937
|
(99.9)
|
|
Arizona
|
7,472
|
(74.4)
|
2,159
|
(21.5)
|
204
|
(2.0)
|
120
|
(1.2)
|
66
|
(0.7)
|
27
|
(0.3)
|
10,048
|
(97.8)
|
|
Arkansas
|
2,792
|
(61.0)
|
1,236
|
(27.0)
|
204
|
(4.5)
|
156
|
(3.4)
|
192
|
(4.2)
|
0
|
(0.0)
|
4,580
|
(100.0)
|
|
Colorado
|
8,068
|
(69.9)
|
2,709
|
(23.5)
|
342
|
(3.0)
|
189
|
(1.6)
|
128
|
(1.1)
|
102
|
(0.9)
|
11,538
|
(99.5)
|
|
District of Columbia††
|
1,729
|
(67.2)
|
483
|
(18.8)
|
118
|
(4.6)
|
158
|
(6.1)
|
86
|
(3.3)
|
0
|
(0.0)
|
2,574
|
(99.2)
|
|
Georgia
|
18,793
|
(57.1)
|
10,150
|
(30.8)
|
1,360
|
(4.1)
|
776
|
(2.4)
|
851
|
(2.6)
|
995
|
(3.0)
|
32,925
|
(100.0)
|
|
Hawaii
|
1,745
|
(52.8)
|
1,208
|
(36.5)
|
115
|
(3.5)
|
79
|
(2.4)
|
134
|
(4.1)
|
27
|
(0.8)
|
3,308
|
(99.0)
|
|
Idaho
|
1,056
|
(64.0)
|
566
|
(34.3)
|
7
|
(0.4)
|
6
|
(0.4)
|
8
|
(0.5)
|
6
|
(0.4)
|
1,649
|
(99.9)
|
|
Indiana
|
6,573
|
(62.3)
|
3,784
|
(35.9)
|
87
|
(0.8)
|
69
|
(0.7)
|
41
|
(0.4)
|
0
|
(0.0)
|
10,554
|
(100.0)
|
|
Iowa
|
4,260
|
(73.3)
|
1,256
|
(21.6)
|
139
|
(2.4)
|
116
|
(2.0)
|
—
|
—
|
—
|
—
|
5,811
|
(99.8)
|
|
Kansas
|
5,839
|
(62.1)
|
2,578
|
(27.4)
|
335
|
(3.6)
|
243
|
(2.6)
|
244
|
(2.6)
|
171
|
(1.8)
|
9,410
|
(100.0)
|
|
Kentucky
|
2,589
|
(62.8)
|
1,098
|
(26.7)
|
175
|
(4.2)
|
99
|
(2.4)
|
111
|
(2.7)
|
48
|
(1.2)
|
4,120
|
(100.0)
|
|
Louisiana
|
4,417
|
(54.6)
|
2,734
|
(33.8)
|
421
|
(5.2)
|
211
|
(2.6)
|
180
|
(2.2)
|
127
|
(1.6)
|
8,090
|
(99.1)
|
|
Maine
|
1,613
|
(67.0)
|
761
|
(31.6)
|
20
|
(0.8)
|
—
|
—
|
7
|
(0.3)
|
—
|
—
|
2,407
|
(99.8)
|
|
Michigan
|
13,977
|
(62.7)
|
6,400
|
(28.7)
|
904
|
(4.1)
|
458
|
(2.1)
|
372
|
(1.7)
|
183
|
(0.8)
|
22,294
|
(99.7)
|
|
Minnesota
|
8,101
|
(65.4)
|
3,255
|
(26.3)
|
379
|
(3.1)
|
229
|
(1.8)
|
342
|
(2.8)
|
80
|
(0.6)
|
12,386
|
(100.0)
|
|
Mississippi
|
1,206
|
(57.3)
|
860
|
(40.8)
|
30
|
(1.4)
|
8
|
(0.4)
|
—
|
—
|
—
|
—
|
2,106
|
(86.4)
|
|
Missouri
|
3,697
|
(53.9)
|
2,518
|
(36.7)
|
266
|
(3.9)
|
184
|
(2.7)
|
148
|
(2.2)
|
43
|
(0.6)
|
6,856
|
(99.6)
|
|
Montana
|
1,506
|
(67.8)
|
546
|
(24.6)
|
75
|
(3.4)
|
46
|
(2.1)
|
39
|
(1.8)
|
10
|
(0.5)
|
2,222
|
(100.0)
|
|
Nevada
|
5,067
|
(61.2)
|
2,445
|
(29.6)
|
360
|
(4.4)
|
193
|
(2.3)
|
137
|
(1.7)
|
71
|
(0.9)
|
8,273
|
(86.7)
|
|
New Jersey§§
|
17,492
|
(61.4)
|
6,748
|
(23.7)
|
1,454
|
(5.1)
|
1,119
|
(3.9)
|
930
|
(3.3)
|
749
|
(2.6)
|
28,492
|
(99.9)
|
|
New Mexico
|
3,280
|
(65.3)
|
1,101
|
(21.9)
|
173
|
(3.4)
|
113
|
(2.3)
|
111
|
(2.2)
|
244
|
(4.9)
|
5,022
|
(100.0)
|
|
New York
|
68,024
|
(59.4)
|
34,232
|
(29.9)
|
3,914
|
(3.4)
|
2,718
|
(2.4)
|
2,988
|
(2.6)
|
2,615
|
(2.3)
|
114,491
|
(95.4)
|
|
New York City
|
56,384
|
(65.4)
|
20,732
|
(24.0)
|
2,633
|
(3.1)
|
2,105
|
(2.4)
|
2,402
|
(2.8)
|
1,979
|
(2.3)
|
86,235
|
(98.8)
|
|
New York State
|
11,640
|
(41.2)
|
13,500
|
(47.8)
|
1,281
|
(4.5)
|
613
|
(2.2)
|
586
|
(2.1)
|
636
|
(2.3)
|
28,256
|
(86.3)
|
|
North Carolina
|
18,381
|
(65.3)
|
7,530
|
(26.8)
|
1,147
|
(4.1)
|
696
|
(2.5)
|
—
|
—
|
—
|
—
|
28,128
|
(91.9)
|
|
North Dakota
|
851
|
(66.0)
|
403
|
(31.3)
|
33
|
(2.6)
|
—
|
—
|
—
|
—
|
0
|
(0.0)
|
1,289
|
(99.9)
|
|
Ohio
|
16,264
|
(57.2)
|
9,165
|
(32.2)
|
1,265
|
(4.4)
|
721
|
(2.5)
|
550
|
(1.9)
|
480
|
(1.7)
|
28,445
|
(99.0)
|
|
Oklahoma
|
4,256
|
(66.2)
|
1,693
|
(26.3)
|
303
|
(4.7)
|
124
|
(1.9)
|
37
|
(0.6)
|
17
|
(0.3)
|
6,430
|
(100.0)
|
|
Oregon
|
6,711
|
(64.1)
|
2,746
|
(26.2)
|
300
|
(2.9)
|
256
|
(2.4)
|
284
|
(2.7)
|
179
|
(1.7)
|
10,476
|
(97.0)
|
|
Rhode Island
|
2,963
|
(69.1)
|
1,042
|
(24.3)
|
126
|
(2.9)
|
92
|
(2.1)
|
—
|
—
|
—
|
—
|
4,285
|
(99.1)
|
|
South Carolina
|
5,060
|
(73.3)
|
1,790
|
(25.9)
|
25
|
(0.4)
|
—
|
—
|
—
|
—
|
17
|
(0.2)
|
6,907
|
(99.9)
|
|
South Dakota
|
444
|
(57.7)
|
310
|
(40.3)
|
—
|
—
|
0
|
(0.0)
|
—
|
—
|
10
|
(1.3)
|
769
|
(100.0)
|
|
Tennessee
|
11,272
|
(65.5)
|
5,435
|
(31.6)
|
445
|
(2.6)
|
24
|
(0.1)
|
—
|
—
|
—
|
—
|
17,200
|
(98.4)
|
|
Texas
|
57,072
|
(73.5)
|
16,647
|
(21.5)
|
2,649
|
(3.4)
|
259
|
(0.3)
|
541
|
(0.7)
|
435
|
(0.6)
|
77,603
|
(100.0)
|
|
Utah
|
2,435
|
(67.3)
|
875
|
(24.2)
|
132
|
(3.7)
|
82
|
(2.3)
|
82
|
(2.3)
|
10
|
(0.3)
|
3,616
|
(98.7)
|
|
Virginia
|
18,896
|
(69.2)
|
7,990
|
(29.2)
|
212
|
(0.8)
|
58
|
(0.2)
|
146
|
(0.5)
|
24
|
(0.1)
|
27,326
|
(99.6)
|
|
Washington
|
14,887
|
(65.9)
|
5,645
|
(25.0)
|
644
|
(2.9)
|
447
|
(2.0)
|
499
|
(2.2)
|
465
|
(2.1)
|
22,587
|
(99.6)
|
|
West Virginia
|
1,068
|
(60.3)
|
589
|
(33.3)
|
65
|
(3.7)
|
18
|
(1.0)
|
25
|
(1.4)
|
6
|
(0.3)
|
1,771
|
(99.9)
|
|
Total
|
357,609
|
(64.0)
|
154,755
|
(27.7)
|
18,855
|
(3.4)
|
10,355
|
(1.9)
|
10,012
|
(1.8)
|
7,206
|
(1.3)
|
558,792
|
(98.0)
|
|
Weeks of gestation
|
Year
|
% change
|
|
2000
|
2001
|
2002
|
2003
|
2004
|
2005
|
2006
|
2007
|
2008
|
2009
|
2000 to 2004
|
2005 to 2009
|
2008 to 2009
|
2000 to 2009
|
|
≤13 weeks' gestation (%)
|
90.8
|
91.1
|
91.2
|
91.0
|
91.5
|
91.5
|
91.6
|
91.6
|
91.5
|
91.9
|
0.8
|
0.4
|
0.4
|
1.2
|
|
≤6–8
|
58.3
|
59.9
|
61.6
|
61.9
|
63.3
|
63.6
|
63.7
|
64.0
|
64.4
|
65.5
|
8.6
|
3.0
|
1.7
|
12.3
|
|
9–13
|
32.5
|
31.2
|
29.6
|
29.1
|
28.3
|
27.9
|
27.9
|
27.6
|
27.1
|
26.4
|
-12.9
|
-5.4
|
-2.6
|
-18.8
|
|
>13 weeks' gestation (%)
|
9.2
|
8.9
|
8.8
|
9.0
|
8.5
|
8.5
|
8.4
|
8.4
|
8.5
|
8.1
|
-7.6
|
-4.7
|
-4.7
|
-12.0
|
|
14–15
|
3.2
|
3.2
|
3.1
|
3.2
|
3.2
|
3.2
|
3.2
|
3.3
|
3.3
|
3.2
|
0.0
|
0.0
|
-3.0
|
0.0
|
|
16–17
|
2.2
|
2.1
|
2.1
|
2.1
|
1.8
|
1.9
|
1.8
|
1.8
|
1.9
|
1.8
|
-18.2
|
-5.3
|
-5.3
|
-18.2
|
|
18–20
|
2.3
|
2.1
|
2.2
|
2.2
|
1.9
|
2.0
|
1.9
|
1.9
|
1.9
|
1.8
|
-17.4
|
-10.0
|
-5.3
|
-21.7
|
|
≥21
|
1.5
|
1.5
|
1.5
|
1.6
|
1.5
|
1.5
|
1.4
|
1.4
|
1.4
|
1.3
|
0.0
|
-13.3
|
-7.1
|
-13.3
|
|
Total (no.)
|
509,028
|
503,140
|
504,940
|
505,342
|
494,864
|
487,956
|
498,618
|
493,758
|
495,536
|
473,372
|
—
|
—
|
—
|
—
|
|
State/Area
|
Week of gestation
|
Total no. of abortions at ≤13 weeks
|
|
≤6
|
7
|
8
|
9
|
10
|
11
|
12
|
13
|
|
No.
|
(%)§
|
No.
|
(%)
|
No.
|
(%)
|
No.
|
(%)
|
No.
|
(%)
|
No.
|
(%)
|
No.
|
(%)
|
No.
|
(%)
|
|
Alabama
|
3,100
|
(31.3)
|
2,045
|
(20.6)
|
1,424
|
(14.4)
|
1,041
|
(10.5)
|
700
|
(7.1)
|
647
|
(6.5)
|
534
|
(5.4)
|
414
|
(4.2)
|
9,905
|
|
Alaska
|
586
|
(30.6)
|
306
|
(16.0)
|
292
|
(15.2)
|
236
|
(12.3)
|
160
|
(8.4)
|
131
|
(6.8)
|
95
|
(5.0)
|
110
|
(5.7)
|
1,916
|
|
Arizona
|
3,764
|
(39.1)
|
2,272
|
(23.6)
|
1,436
|
(14.9)
|
770
|
(8.0)
|
524
|
(5.4)
|
391
|
(4.1)
|
285
|
(3.0)
|
189
|
(2.0)
|
9,631
|
|
Arkansas
|
1,450
|
(36.0)
|
797
|
(19.8)
|
545
|
(13.5)
|
401
|
(10.0)
|
330
|
(8.2)
|
243
|
(6.0)
|
149
|
(3.7)
|
113
|
(2.8)
|
4,028
|
|
Colorado
|
4,461
|
(41.4)
|
1,998
|
(18.5)
|
1,609
|
(14.9)
|
1,040
|
(9.7)
|
539
|
(5.0)
|
475
|
(4.4)
|
353
|
(3.3)
|
302
|
(2.8)
|
10,777
|
|
District of Columbia¶
|
1,029
|
(46.5)
|
451
|
(20.4)
|
249
|
(11.3)
|
161
|
(7.3)
|
106
|
(4.8)
|
111
|
(5.0)
|
50
|
(2.3)
|
55
|
(2.5)
|
2,212
|
|
Georgia
|
7,974
|
(27.6)
|
6,411
|
(22.2)
|
4,408
|
(15.2)
|
3,259
|
(11.3)
|
2,552
|
(8.8)
|
2,063
|
(7.1)
|
1,334
|
(4.6)
|
942
|
(3.3)
|
28,943
|
|
Hawaii
|
688
|
(23.3)
|
511
|
(17.3)
|
546
|
(18.5)
|
350
|
(11.9)
|
287
|
(9.7)
|
195
|
(6.6)
|
217
|
(7.3)
|
159
|
(5.4)
|
2,953
|
|
Idaho
|
447
|
(27.6)
|
328
|
(20.2)
|
281
|
(17.3)
|
178
|
(11.0)
|
131
|
(8.1)
|
102
|
(6.3)
|
97
|
(6.0)
|
58
|
(3.6)
|
1,622
|
|
Indiana
|
2,358
|
(22.8)
|
2,190
|
(21.1)
|
2,025
|
(19.6)
|
1,348
|
(13.0)
|
904
|
(8.7)
|
724
|
(7.0)
|
563
|
(5.4)
|
245
|
(2.4)
|
10,357
|
|
Iowa
|
2,468
|
(44.7)
|
905
|
(16.4)
|
887
|
(16.1)
|
399
|
(7.2)
|
337
|
(6.1)
|
279
|
(5.1)
|
164
|
(3.0)
|
77
|
(1.4)
|
5,516
|
|
Kansas
|
2,849
|
(33.8)
|
1,762
|
(20.9)
|
1,228
|
(14.6)
|
933
|
(11.1)
|
569
|
(6.8)
|
514
|
(6.1)
|
333
|
(4.0)
|
229
|
(2.7)
|
8,417
|
|
Kentucky
|
1,080
|
(29.3)
|
873
|
(23.7)
|
636
|
(17.3)
|
319
|
(8.7)
|
296
|
(8.0)
|
238
|
(6.5)
|
162
|
(4.4)
|
80
|
(2.2)
|
3,684
|
|
Louisiana
|
2,111
|
(29.5)
|
1,156
|
(16.2)
|
1,150
|
(16.1)
|
840
|
(11.7)
|
772
|
(10.8)
|
458
|
(6.4)
|
363
|
(5.1)
|
301
|
(4.2)
|
7,151
|
|
Maine
|
751
|
(31.6)
|
485
|
(20.4)
|
377
|
(15.9)
|
259
|
(10.9)
|
166
|
(7.0)
|
135
|
(5.7)
|
105
|
(4.4)
|
96
|
(4.0)
|
2,374
|
|
Michigan
|
6,994
|
(34.3)
|
3,890
|
(19.1)
|
3,093
|
(15.2)
|
2,259
|
(11.1)
|
1,354
|
(6.6)
|
1,195
|
(5.9)
|
880
|
(4.3)
|
712
|
(3.5)
|
20,377
|
|
Minnesota
|
3,839
|
(33.8)
|
2,510
|
(22.1)
|
1,752
|
(15.4)
|
1,241
|
(10.9)
|
686
|
(6.0)
|
575
|
(5.1)
|
384
|
(3.4)
|
369
|
(3.2)
|
11,356
|
|
Mississippi
|
369
|
(17.9)
|
412
|
(19.9)
|
425
|
(20.6)
|
312
|
(15.1)
|
244
|
(11.8)
|
175
|
(8.5)
|
75
|
(3.6)
|
54
|
(2.6)
|
2,066
|
|
Missouri
|
1,029
|
(16.6)
|
1,453
|
(23.4)
|
1,215
|
(19.5)
|
864
|
(13.9)
|
592
|
(9.5)
|
500
|
(8.0)
|
344
|
(5.5)
|
218
|
(3.5)
|
6,215
|
|
Montana
|
873
|
(42.5)
|
358
|
(17.4)
|
275
|
(13.4)
|
155
|
(7.6)
|
133
|
(6.5)
|
89
|
(4.3)
|
101
|
(4.9)
|
68
|
(3.3)
|
2,052
|
|
Nevada
|
2,023
|
(26.9)
|
1,605
|
(21.4)
|
1,439
|
(19.2)
|
1,017
|
(13.5)
|
512
|
(6.8)
|
402
|
(5.4)
|
322
|
(4.3)
|
192
|
(2.6)
|
7,512
|
|
New Jersey**
|
8,009
|
(33.0)
|
5,376
|
(22.2)
|
4,107
|
(16.9)
|
2,121
|
(8.8)
|
1,570
|
(6.5)
|
941
|
(3.9)
|
996
|
(4.1)
|
1120
|
(4.6)
|
24,240
|
|
New Mexico
|
1,948
|
(44.5)
|
746
|
(17.0)
|
586
|
(13.4)
|
384
|
(8.8)
|
258
|
(5.9)
|
156
|
(3.6)
|
165
|
(3.8)
|
138
|
(3.1)
|
4,381
|
|
New York
|
32,493
|
(18.9)
|
19,318
|
(18.9)
|
16,213
|
(15.9)
|
12,014
|
(11.7)
|
8,328
|
(8.1)
|
6,323
|
(6.2)
|
4,693
|
(4.6)
|
2,874
|
(2.8)
|
102,256
|
|
New York City
|
30,249
|
(39.2)
|
14,989
|
(19.4)
|
11,146
|
(14.5)
|
7,556
|
(9.8)
|
4,965
|
(6.4)
|
3,723
|
(4.8)
|
2,870
|
(3.7)
|
1,618
|
(2.1)
|
77,116
|
|
New York State
|
2,244
|
(8.9)
|
4,329
|
(17.2)
|
5,067
|
(20.2)
|
4,458
|
(17.7)
|
3,363
|
(13.4)
|
2,600
|
(10.3)
|
1,823
|
(7.3)
|
1,256
|
(5.0)
|
25,140
|
|
North Carolina
|
9,006
|
(34.8)
|
5,387
|
(20.8)
|
3,988
|
(15.4)
|
2,440
|
(9.4)
|
1,805
|
(7.0)
|
1,448
|
(5.6)
|
1,079
|
(4.2)
|
758
|
(2.9)
|
25,911
|
|
North Dakota
|
412
|
(32.9)
|
277
|
(22.1)
|
162
|
(12.9)
|
121
|
(9.6)
|
72
|
(5.7)
|
84
|
(6.7)
|
72
|
(5.7)
|
54
|
(4.3)
|
1,254
|
|
Ohio
|
7,278
|
(28.6)
|
4,879
|
(19.2)
|
4,107
|
(16.2)
|
2,805
|
(11.0)
|
2,133
|
(8.4)
|
1,686
|
(6.6)
|
1,347
|
(5.3)
|
1194
|
(4.7)
|
25,429
|
|
Oklahoma
|
2,432
|
(40.9)
|
950
|
(16.0)
|
874
|
(14.7)
|
503
|
(8.5)
|
511
|
(8.6)
|
382
|
(6.4)
|
164
|
(2.8)
|
133
|
(2.2)
|
5,949
|
|
Oregon
|
3,647
|
(38.6)
|
1,687
|
(17.8)
|
1,377
|
(14.6)
|
909
|
(9.6)
|
585
|
(6.2)
|
545
|
(5.8)
|
393
|
(4.2)
|
314
|
(3.3)
|
9,457
|
|
Rhode Island
|
1,650
|
(41.2)
|
795
|
(19.9)
|
518
|
(12.9)
|
321
|
(8.0)
|
256
|
(6.4)
|
195
|
(4.9)
|
137
|
(3.4)
|
133
|
(3.3)
|
4,005
|
|
South Carolina
|
2,844
|
(41.5)
|
1,357
|
(19.8)
|
859
|
(12.5)
|
576
|
(8.4)
|
389
|
(5.7)
|
364
|
(5.3)
|
310
|
(4.5)
|
151
|
(2.2)
|
6,850
|
|
South Dakota
|
156
|
(20.7)
|
137
|
(18.2)
|
151
|
(20.0)
|
91
|
(12.1)
|
94
|
(12.5)
|
50
|
(6.6)
|
27
|
(3.6)
|
48
|
(6.4)
|
754
|
|
Tennessee
|
5,746
|
(34.4)
|
3,294
|
(19.7)
|
2,232
|
(13.4)
|
1,620
|
(9.7)
|
1,233
|
(7.4)
|
1,087
|
(6.5)
|
1,084
|
(6.5)
|
411
|
(2.5)
|
16,707
|
|
Texas
|
36,017
|
(48.9)
|
11,484
|
(15.6)
|
9,571
|
(13.0)
|
5,921
|
(8.0)
|
3,946
|
(5.4)
|
2,953
|
(4.0)
|
2,036
|
(2.8)
|
1791
|
(2.4)
|
73,719
|
|
Utah
|
1,195
|
(36.1)
|
753
|
(22.7)
|
487
|
(14.7)
|
283
|
(8.5)
|
197
|
(6.0)
|
142
|
(4.3)
|
129
|
(3.9)
|
124
|
(3.7)
|
3,310
|
|
Virginia
|
9,102
|
(33.9)
|
5,598
|
(20.8)
|
4,196
|
(15.6)
|
2,683
|
(10.0)
|
1,926
|
(7.2)
|
1,466
|
(5.5)
|
1,251
|
(4.7)
|
664
|
(2.5)
|
26,886
|
|
Washington
|
7,791
|
(37.9)
|
4,111
|
(20.0)
|
2,985
|
(14.5)
|
1,816
|
(8.8)
|
1,352
|
(6.6)
|
1,029
|
(5.0)
|
867
|
(4.2)
|
581
|
(2.8)
|
20,532
|
|
West Virginia
|
422
|
(25.5)
|
376
|
(22.7)
|
270
|
(16.3)
|
187
|
(11.3)
|
142
|
(8.6)
|
129
|
(7.8)
|
92
|
(5.6)
|
39
|
(2.4)
|
1,657
|
|
Total
|
180,391
|
(35.2)
|
99,243
|
(19.4)
|
77,975
|
(15.2)
|
52,177
|
(10.2)
|
36,691
|
(7.2)
|
28,622
|
(5.6)
|
21,752
|
(4.2)
|
15,510
|
(3.0)
|
512,361
|
|
Weeks of gestation
|
Year
|
% change
|
|
2000
|
2001
|
2002
|
2003
|
2004
|
2005
|
2006
|
2007
|
2008
|
2009
|
2000 to 2004
|
2005 to 2009
|
2008 to 2009
|
2000 to 2009
|
|
% among abortions reported at ≤13 weeks
|
|
≤6
|
25.1
|
28.0
|
30.5
|
31.3
|
33.1
|
34.3
|
34.4
|
35.4
|
35.8
|
37.0
|
31.6
|
7.8
|
3.3
|
47.2
|
|
7
|
20.1
|
20.0
|
20.1
|
20.1
|
19.8
|
19.7
|
20.0
|
19.9
|
19.8
|
19.4
|
-1.6
|
-1.2
|
-2.0
|
-3.5
|
|
8
|
18.9
|
17.8
|
17.0
|
16.7
|
16.2
|
15.5
|
15.2
|
14.6
|
14.7
|
14.9
|
-14.2
|
-3.9
|
0.8
|
-21.4
|
|
9
|
12.5
|
11.9
|
11.3
|
11.0
|
10.5
|
10.4
|
10.4
|
10.1
|
10.0
|
9.7
|
-15.8
|
-6.3
|
-2.5
|
-22.4
|
|
10
|
9.2
|
8.6
|
8.0
|
7.8
|
7.6
|
7.5
|
7.4
|
7.3
|
7.1
|
6.7
|
-17.1
|
-10.2
|
-4.8
|
-26.4
|
|
11
|
6.4
|
6.2
|
5.8
|
5.7
|
5.5
|
5.4
|
5.3
|
5.4
|
5.4
|
5.3
|
-13.7
|
-2.0
|
-2.8
|
-16.9
|
|
12
|
4.7
|
4.5
|
4.3
|
4.4
|
4.2
|
4.2
|
4.2
|
4.2
|
4.2
|
4.1
|
-8.9
|
-3.6
|
-2.9
|
-12.5
|
|
13
|
3.2
|
3.1
|
3.0
|
3.0
|
3.0
|
3.1
|
3.1
|
3.0
|
3.0
|
2.9
|
-3.9
|
-5.3
|
-2.4
|
-8.4
|
|
Total (no.)
|
578,661
|
576,735
|
578,442
|
578,863
|
572,072
|
554,656
|
578,388
|
569,432
|
574,074
|
512,367
|
—
|
—
|
—
|
—
|
|
State/Area
|
Curettage†
|
Medical
|
Intrauterine instillation§
|
Other¶
|
Total abortions reported by known method type
|
|
Curettage,
≤13 weeks' gestation
|
Curettage,
>13 weeks' gestation
|
Curettage,
unknown gestational age
|
Medical,
≤8 weeks' gestation
|
Medical,
>8 weeks' gestation
|
Medical,
unknown gestational age
|
|
No.
|
% of all reported abortions††
|
|
No.
|
(%)**
|
No.
|
(%)
|
No.
|
(%)
|
No.
|
(%)
|
No.
|
(%)
|
No.
|
(%)
|
No.
|
(%)
|
No.
|
(%)
|
|
Alabama§§
|
8,191
|
(75.4)
|
927
|
(8.5)
|
12
|
(0.1)
|
N/A
|
N/A
|
N/A
|
N/A
|
N/A
|
N/A
|
5
|
(0.0)
|
1,730
|
(15.9)
|
10,865
|
(99.8)
|
|
Alaska
|
1,416
|
(74.0)
|
10
|
(0.5)
|
0
|
(0.0)
|
462
|
(24.1)
|
26
|
(1.4)
|
0
|
(0.0)
|
0
|
(0.0)
|
0
|
(0.0)
|
1,914
|
(98.8)
|
|
Arizona
|
4,494
|
(44.6)
|
404
|
(4.0)
|
170
|
(1.7)
|
4,780
|
(47.4)
|
190
|
(1.9)
|
44
|
(0.4)
|
0
|
(0.0)
|
0
|
(0.0)
|
10,082
|
(98.2)
|
|
Arkansas
|
3,508
|
(76.6)
|
551
|
(12.0)
|
0
|
(0.0)
|
510
|
(11.1)
|
11
|
(0.2)
|
0
|
(0.0)
|
0
|
(0.0)
|
0
|
(0.0)
|
4,580
|
(100.0)
|
|
Colorado
|
6,441
|
(55.5)
|
685
|
(5.9)
|
—¶¶
|
—
|
3,938
|
(34.0)
|
204
|
(1.8)
|
37
|
(0.3)
|
—
|
—
|
267
|
(2.3)
|
11,598
|
(100.0)
|
|
Connecticut***
|
N/A
|
N/A
|
N/A
|
N/A
|
10,226
|
(74.5)
|
N/A
|
N/A
|
N/A
|
N/A
|
3,505
|
(25.5)
|
—
|
—
|
—
|
—
|
13,732
|
(100.0)
|
|
District of Columbia†††
|
1,494
|
(57.6)
|
362
|
(13.9)
|
0
|
(0.0)
|
714
|
(27.5)
|
—
|
—
|
0
|
(0.0)
|
—
|
—
|
22
|
(0.8)
|
2,596
|
(100.0)
|
|
Georgia
|
25,941
|
(80.4)
|
3,902
|
(12.1)
|
0
|
(0.0)
|
2,269
|
(7.0)
|
116
|
(0.4)
|
—
|
—
|
—
|
—
|
17
|
(0.1)
|
32,248
|
(97.9)
|
|
Hawaii§§
|
2,764
|
(84.6)
|
355
|
(10.9)
|
28
|
(0.9)
|
N/A
|
N/A
|
N/A
|
N/A
|
N/A
|
N/A
|
0
|
(0.0)
|
122
|
(3.7)
|
3,269
|
(97.8)
|
|
Idaho
|
1,067
|
(64.7)
|
0
|
(0.0)
|
—
|
—
|
540
|
(32.7)
|
16
|
(1.0)
|
0
|
(0.0)
|
—
|
—
|
25
|
(1.5)
|
1,650
|
(100.0)
|
|
Indiana
|
8,755
|
(83.4)
|
180
|
(1.7)
|
—
|
—
|
1,427
|
(13.6)
|
33
|
(0.3)
|
0
|
(0.0)
|
—
|
—
|
100
|
(1.0)
|
10,498
|
(99.4)
|
|
Iowa
|
2,654
|
(45.6)
|
275
|
(4.7)
|
—
|
—
|
2,757
|
(47.4)
|
125
|
(2.1)
|
7
|
(0.1)
|
0
|
(0.0)
|
—
|
—
|
5,820
|
(100.0)
|
|
Kansas
|
6,464
|
(68.7)
|
868
|
(9.2)
|
0
|
(0.0)
|
1,929
|
(20.5)
|
146
|
(1.6)
|
0
|
(0.0)
|
—
|
—
|
—
|
—
|
9,410
|
(100.0)
|
|
Kentucky
|
3,094
|
(75.2)
|
426
|
(10.3)
|
0
|
(0.0)
|
588
|
(14.3)
|
—
|
—
|
—
|
—
|
0
|
(0.0)
|
5
|
(0.1)
|
4,116
|
(99.9)
|
|
Louisiana§§
|
5,296
|
(65.8)
|
926
|
(11.5)
|
45
|
(0.6)
|
N/A
|
N/A
|
N/A
|
N/A
|
N/A
|
N/A
|
0
|
(0.0)
|
1,784
|
(22.2)
|
8,051
|
(98.6)
|
|
Maine
|
1,954
|
(81.0)
|
18
|
(0.7)
|
—
|
—
|
412
|
(17.1)
|
23
|
(1.0)
|
—
|
—
|
0
|
(0.0)
|
0
|
(0.0)
|
2,413
|
(100.0)
|
|
Massachusetts***
|
N/A
|
N/A
|
N/A
|
N/A
|
17,720
|
(77.2)
|
N/A
|
N/A
|
N/A
|
N/A
|
5,037
|
(22.0)
|
13
|
(0.1)
|
175
|
(0.8)
|
22,945
|
(100.0)
|
|
Michigan
|
17,636
|
(78.9)
|
1,881
|
(8.4)
|
59
|
(0.3)
|
2,626
|
(11.8)
|
117
|
(0.5)
|
—
|
—
|
—
|
—
|
20
|
(0.1)
|
22,348
|
(100.0)
|
|
Minnesota
|
9,040
|
(73.0)
|
1,013
|
(8.2)
|
—
|
—
|
2,176
|
(17.6)
|
138
|
(1.1)
|
—
|
—
|
7
|
(0.1)
|
12
|
(0.1)
|
12,388
|
(100.0)
|
|
Mississippi
|
2,066
|
(84.7)
|
40
|
(1.6)
|
331
|
(13.6)
|
0
|
(0.0)
|
0
|
(0.0)
|
0
|
(0.0)
|
—
|
—
|
—
|
—
|
2,438
|
(100.0)
|
|
Missouri
|
4,539
|
(66.0)
|
632
|
(9.2)
|
13
|
(0.2)
|
1,529
|
(22.2)
|
153
|
(2.2)
|
11
|
(0.2)
|
0
|
(0.0)
|
0
|
(0.0)
|
6,877
|
(99.9)
|
|
Montana
|
1,281
|
(57.8)
|
168
|
(7.6)
|
—
|
—
|
754
|
(34.0)
|
10
|
(0.5)
|
0
|
(0.0)
|
—
|
—
|
—
|
—
|
2,217
|
(99.7)
|
|
Nebraska***
|
N/A
|
N/A
|
N/A
|
N/A
|
2,320
|
(90.9)
|
N/A
|
N/A
|
N/A
|
N/A
|
231
|
(9.1)
|
0
|
(0.0)
|
0
|
(0.0)
|
2,551
|
(100.0)
|
|
Nevada§§
|
6,872
|
(75.8)
|
721
|
(8.0)
|
1,063
|
(11.7)
|
N/A
|
N/A
|
N/A
|
N/A
|
N/A
|
N/A
|
0
|
(0.0)
|
409
|
(4.5)
|
9,065
|
(95.0)
|
|
New Jersey§§§
|
23,020
|
(80.7)
|
3,999
|
(14.0)
|
16
|
(0.1)
|
1,179
|
(4.1)
|
41
|
(0.1)
|
11
|
(0.0)
|
11
|
(0.0)
|
237
|
(0.8)
|
28,514
|
(100.0)
|
|
New Mexico
|
3,725
|
(74.9)
|
554
|
(11.1)
|
0
|
(0.0)
|
531
|
(10.7)
|
157
|
(3.2)
|
0
|
(0.0)
|
—
|
—
|
—
|
—
|
4,970
|
(99.0)
|
|
New York
|
88,401
|
(74.5)
|
11,723
|
(9.9)
|
3,904
|
(3.3)
|
11,405
|
(9.6)
|
1,828
|
(1.5)
|
1,190
|
(1.0)
|
53
|
(0.0)
|
219
|
(0.2)
|
118,723
|
(98.9)
|
|
New York City
|
67,912
|
(78.2)
|
8,919
|
(10.3)
|
844
|
(1.0)
|
8,601
|
(9.9)
|
357
|
(0.4)
|
161
|
(0.2)
|
22
|
(0.0)
|
9
|
(0.0)
|
86,825
|
(99.5)
|
|
New York State
|
20,489
|
(64.2)
|
2,804
|
(8.8)
|
3,060
|
(9.6)
|
2,804
|
(8.8)
|
1,471
|
(4.6)
|
1,029
|
(3.2)
|
31
|
(0.1)
|
210
|
(0.7)
|
31,898
|
(97.5)
|
|
North Carolina
|
20,395
|
(69.3)
|
2,086
|
(7.1)
|
1,791
|
(6.1)
|
4,594
|
(15.6)
|
122
|
(0.4)
|
353
|
(1.2)
|
38
|
(0.1)
|
32
|
(0.1)
|
29,411
|
(96.1)
|
|
North Dakota
|
965
|
(75.0)
|
35
|
(2.7)
|
0
|
(0.0)
|
282
|
(21.9)
|
—
|
—
|
—
|
—
|
0
|
(0.0)
|
0
|
(0.0)
|
1,286
|
(99.7)
|
|
Ohio
|
19,297
|
(69.2)
|
2,946
|
(10.6)
|
145
|
(0.5)
|
5,169
|
(18.5)
|
547
|
(2.0)
|
96
|
(0.3)
|
36
|
(0.1)
|
760
|
(2.7)
|
27,903¶¶¶
|
(97.2)
|
|
Oklahoma
|
3,950
|
(61.4)
|
479
|
(7.4)
|
0
|
(0.0)
|
1,992
|
(31.0)
|
9
|
(0.1)
|
0
|
(0.0)
|
0
|
(0.0)
|
0
|
(0.0)
|
6,430
|
(100.0)
|
|
Oregon
|
7,789
|
(72.3)
|
992
|
(9.2)
|
270
|
(2.5)
|
1,588
|
(14.7)
|
62
|
(0.6)
|
49
|
(0.5)
|
0
|
(0.0)
|
28
|
(0.3)
|
10,778
|
(99.8)
|
|
Pennsylvania***,****
|
N/A
|
N/A
|
N/A
|
N/A
|
29,892
|
(83.8)
|
N/A
|
N/A
|
N/A
|
N/A
|
5,776
|
(16.2)
|
0
|
(0.0)
|
16
|
(0.0)
|
35,684
|
(100.0)
|
|
Rhode Island
|
3,578
|
(82.8)
|
274
|
(6.3)
|
35
|
(0.8)
|
418
|
(9.7)
|
11
|
(0.3)
|
6
|
(0.1)
|
—
|
—
|
—
|
—
|
4,323
|
(99.9)
|
|
South Carolina
|
4,208
|
(61.0)
|
40
|
(0.6)
|
—
|
—
|
2,610
|
(37.8)
|
38
|
(0.6)
|
—
|
—
|
—
|
—
|
—
|
—
|
6,904
|
(99.9)
|
|
South Dakota
|
531
|
(69.1)
|
—
|
—
|
0
|
(0.0)
|
216
|
(28.1)
|
20
|
(2.6)
|
0
|
(0.0)
|
0
|
(0.0)
|
—
|
—
|
769
|
(100.0)
|
|
Tennessee§§
|
12,431
|
(72.7)
|
447
|
(2.6)
|
158
|
(0.9)
|
N/A
|
N/A
|
N/A
|
N/A
|
N/A
|
N/A
|
0
|
(0.0)
|
4,054
|
(23.7)
|
17,090
|
(97.8)
|
|
Texas
|
57,817
|
(74.5)
|
3,751
|
(4.8)
|
23
|
(0.0)
|
15,710
|
(20.2)
|
278
|
(0.4)
|
—
|
—
|
—
|
—
|
43
|
(0.1)
|
77,630
|
(100.0)
|
|
Utah
|
2,024
|
(55.2)
|
284
|
(7.8)
|
24
|
(0.7)
|
1,246
|
(34.0)
|
58
|
(1.6)
|
—
|
—
|
0
|
(0.0)
|
—
|
—
|
3,664
|
(100.0)
|
|
Virginia
|
23,417
|
(85.8)
|
400
|
(1.5)
|
83
|
(0.3)
|
3,243
|
(11.9)
|
55
|
(0.2)
|
32
|
(0.1)
|
9
|
(0.0)
|
59
|
(0.2)
|
27,298
|
(99.5)
|
|
Washington
|
15,844
|
(70.0)
|
1,994
|
(8.8)
|
36
|
(0.2)
|
4,605
|
(20.3)
|
88
|
(0.4)
|
23
|
(0.1)
|
28
|
(0.1)
|
12
|
(0.1)
|
22,630
|
(99.8)
|
|
West Virginia
|
1,494
|
(84.6)
|
50
|
(2.8)
|
—
|
—
|
56
|
(3.2)
|
6
|
(0.3)
|
0
|
(0.0)
|
—
|
—
|
158
|
(8.9)
|
1,767
|
(99.7)
|
|
State/Area
|
Curettage†
|
Medical
|
Intrauterine instillation§
|
Other¶
|
Total abortions reported by known method type
|
|
Curettage,
≤13 weeks' gestation
|
Curettage,
>13 weeks' gestation
|
Curettage,
unknown gestational age
|
Medical,
≤8 weeks' gestation
|
Medical,
>8 weeks' gestation
|
Medical,
unknown gestational age
|
|
No.
|
% of all reported abortions††
|
|
No.
|
(%)**
|
No.
|
(%)
|
No.
|
(%)
|
No.
|
(%)
|
No.
|
(%)
|
No.
|
(%)
|
No.
|
(%)
|
No.
|
(%)
|
|
Total
|
475,627
|
(74.4)
|
51,025††††
|
(8.0)
|
—§§§§
|
—§§§§
|
97,825
|
(15.3)
|
5,516
|
(0.9)
|
—¶¶¶¶
|
—¶¶¶¶
|
225
|
(0.0)
|
10,318
|
(1.6)
|
639,445*****
|
(99.1)
|
|
Total among states with medical abortion on reporting form†††††
|
438,830
|
(74.2)
|
47,586††††
|
(8.1)
|
—§§§§
|
—§§§§
|
97,825
|
(16.5)
|
5,516
|
(0.9)
|
—¶¶¶¶
|
—¶¶¶¶
|
220
|
(0.0)
|
2,219
|
(0.4)
|
591,111*****
|
(99.2)
|
|
State/Area
|
Non-Hispanic
|
Hispanic
|
Total abortions reported by known race/ethnicity
|
|
White
|
Black
|
Other
|
No.
|
% of all reported abortions§
|
|
No.
|
(%)†
|
No.
|
(%)
|
No.
|
(%)
|
No.
|
(%)
|
|
Alabama
|
3,918
|
(36.2)
|
6,254
|
(57.8)
|
215
|
(2.0)
|
428
|
(4.0)
|
10,815
|
(99.4)
|
|
Alaska
|
968
|
(57.9)
|
107
|
(6.4)
|
542
|
(32.4)
|
54
|
(3.2)
|
1,671
|
(86.2)
|
|
Arizona
|
4,677
|
(47.5)
|
696
|
(7.1)
|
885
|
(9.0)
|
3,593
|
(36.5)
|
9,851
|
(95.9)
|
|
Arkansas
|
2,500
|
(54.6)
|
1,608
|
(35.1)
|
195
|
(4.3)
|
274
|
(6.0)
|
4,577
|
(99.9)
|
|
Colorado
|
6,549
|
(57.9)
|
860
|
(7.6)
|
967
|
(8.5)
|
2,938
|
(26.0)
|
11,314
|
(97.6)
|
|
District of Columbia¶
|
599
|
(23.4)
|
1,375
|
(53.8)
|
258
|
(10.1)
|
323
|
(12.6)
|
2,555
|
(98.4)
|
|
Georgia
|
8,162
|
(26.5)
|
18,856
|
(61.2)
|
1,323
|
(4.3)
|
2,490
|
(8.1)
|
30,831
|
(93.6)
|
|
Idaho
|
1,301
|
(79.6)
|
21
|
(1.3)
|
81
|
(5.0)
|
231
|
(14.1)
|
1,634
|
(99.0)
|
|
Indiana
|
6,187
|
(61.5)
|
2,785
|
(27.7)
|
377
|
(3.7)
|
715
|
(7.1)
|
10,064
|
(95.3)
|
|
Kansas
|
5,698
|
(60.7)
|
2,125
|
(22.6)
|
678
|
(7.2)
|
887
|
(9.4)
|
9,388
|
(99.8)
|
|
Kentucky
|
2,783
|
(67.5)
|
981
|
(23.8)
|
255
|
(6.2)
|
101
|
(2.5)
|
4,120
|
(100.0)
|
|
Maine
|
1,856
|
(88.1)
|
59
|
(2.8)
|
123
|
(5.8)
|
69
|
(3.3)
|
2,107
|
(87.3)
|
|
Minnesota
|
7,010
|
(58.1)
|
2,799
|
(23.2)
|
1,542
|
(12.8)
|
711
|
(5.9)
|
12,062
|
(97.4)
|
|
Mississippi
|
499
|
(20.5)
|
1,871
|
(76.8)
|
35
|
(1.4)
|
31
|
(1.3)
|
2,436
|
(99.9)
|
|
Missouri
|
3,457
|
(50.6)
|
2,866
|
(41.9)
|
343
|
(5.0)
|
170
|
(2.5)
|
6,836
|
(99.3)
|
|
Montana
|
1,735
|
(85.4)
|
9
|
(0.4)
|
204
|
(10.0)
|
83
|
(4.1)
|
2,031
|
(91.4)
|
|
New Jersey**
|
7,011
|
(25.6)
|
9,517
|
(34.8)
|
4,571
|
(16.7)
|
6,261
|
(22.9)
|
27,360
|
(95.9)
|
|
New York††
|
25,810
|
(22.8)
|
48,391
|
(42.8)
|
6,146
|
(5.4)
|
32,657
|
(28.9)
|
113,004
|
(94.2)
|
|
New York City
|
9,853
|
(11.6)
|
40,798
|
(48.2)
|
5,561
|
(6.6)
|
28,364
|
(33.5)
|
84,576
|
(96.9)
|
|
New York State
|
15,957
|
(56.1)
|
7,593
|
(26.7)
|
585
|
(2.1)
|
4,293
|
(15.1)
|
28,428
|
(86.9)
|
|
North Dakota
|
790
|
(71.5)
|
50
|
(4.5)
|
213
|
(19.3)
|
52
|
(4.7)
|
1,105
|
(85.7)
|
|
Ohio
|
15,164
|
(55.4)
|
10,485
|
(38.3)
|
662
|
(2.4)
|
1,041
|
(3.8)
|
27,352
|
(95.2)
|
|
Oregon
|
7,827
|
(75.2)
|
556
|
(5.3)
|
777
|
(7.5)
|
1,248
|
(12.0)
|
10,408
|
(96.4)
|
|
South Carolina
|
3,330
|
(49.4)
|
2,767
|
(41.0)
|
254
|
(3.8)
|
394
|
(5.8)
|
6,745
|
(97.6)
|
|
South Dakota
|
555
|
(72.2)
|
61
|
(7.9)
|
116
|
(15.1)
|
37
|
(4.8)
|
769
|
(100.0)
|
|
Tennessee
|
7,548
|
(44.6)
|
8,291
|
(49.0)
|
437
|
(2.6)
|
656
|
(3.9)
|
16,932
|
(96.9)
|
|
Texas§§
|
24,457
|
(31.7)
|
19,152
|
(24.8)
|
3,967
|
(5.1)
|
29,576
|
(38.3)
|
77,152
|
(99.4)
|
|
Utah
|
2,122
|
(67.3)
|
68
|
(2.2)
|
164
|
(5.2)
|
797
|
(25.3)
|
3,151
|
(86.0)
|
|
Virginia
|
9,964
|
(36.3)
|
11,429
|
(41.6)
|
2,034
|
(7.4)
|
4,015
|
(14.6)
|
27,442
|
(100.0)
|
|
West Virginia
|
1,498
|
(84.7)
|
227
|
(12.8)
|
29
|
(1.6)
|
14
|
(0.8)
|
1,768
|
(99.8)
|
|
Total
|
163,975
|
(37.7)
|
154,266
|
(35.4)
|
27,393
|
(6.3)
|
89,846
|
(20.6)
|
435,480
|
(96.4)
|
|
Abortion rate¶¶
|
8.5
|
|
32.5
|
|
17.7
|
|
19.3
|
|
14.3
|
|
|
Abortion ratio***
|
140
|
|
477
|
|
243
|
|
195
|
|
210
|
|
|
State/Area
|
White
|
Black
|
Other
|
Total abortions reported by known race
|
|
No.
|
(%)†
|
No.
|
(%)
|
No.
|
(%)
|
No.
|
% all reported abortions§
|
|
Alabama
|
4,316
|
(39.8)
|
6,270
|
(57.8)
|
267
|
(2.5)
|
10,853
|
(99.7)
|
|
Alaska
|
1,076
|
(59.3)
|
128
|
(7.1)
|
609
|
(33.6)
|
1,813
|
(93.6)
|
|
Arizona
|
6,835
|
(74.3)
|
737
|
(8.0)
|
1,623
|
(17.7)
|
9,195
|
(89.5)
|
|
Arkansas
|
2,596
|
(56.7)
|
1,608
|
(35.1)
|
373
|
(8.1)
|
4,577
|
(99.9)
|
|
Colorado
|
8,543
|
(75.1)
|
877
|
(7.7)
|
1,954
|
(17.2)
|
11,374
|
(98.1)
|
|
District of Columbia¶
|
607
|
(23.8)
|
1,382
|
(54.1)
|
565
|
(22.1)
|
2,554
|
(98.4)
|
|
Georgia
|
8,367
|
(29.0)
|
19,116
|
(66.2)
|
1,391
|
(4.8)
|
28,874
|
(87.7)
|
|
Idaho
|
1,500
|
(92.0)
|
22
|
(1.3)
|
109
|
(6.7)
|
1,631
|
(98.8)
|
|
Indiana
|
6,657
|
(64.7)
|
3,155
|
(30.6)
|
484
|
(4.7)
|
10,296
|
(97.5)
|
|
Iowa
|
4,554
|
(78.2)
|
666
|
(11.4)
|
601
|
(10.3)
|
5,821
|
(100.0)
|
|
Kansas
|
6,183
|
(66.0)
|
2,155
|
(23.0)
|
1,035
|
(11.0)
|
9,373
|
(99.6)
|
|
Louisiana
|
2,696
|
(37.1)
|
4,419
|
(60.8)
|
159
|
(2.2)
|
7,274
|
(89.1)
|
|
Maine
|
2,201
|
(91.7)
|
71
|
(3.0)
|
129
|
(5.4)
|
2,401
|
(99.5)
|
|
Michigan
|
11,395
|
(52.3)
|
9,457
|
(43.4)
|
929
|
(4.3)
|
21,781
|
(97.4)
|
|
Minnesota
|
7,468
|
(61.2)
|
2,919
|
(23.9)
|
1,824
|
(14.9)
|
12,211
|
(98.6)
|
|
Mississippi
|
529
|
(21.7)
|
1,871
|
(76.8)
|
35
|
(1.4)
|
2,435
|
(99.9)
|
|
Missouri
|
3,619
|
(52.9)
|
2,876
|
(42.0)
|
351
|
(5.1)
|
6,846
|
(99.5)
|
|
Montana
|
1,904
|
(88.9)
|
9
|
(0.4)
|
228
|
(10.6)
|
2,141
|
(96.3)
|
|
New Jersey**
|
9,373
|
(33.8)
|
12,628
|
(45.6)
|
5,696
|
(20.6)
|
27,697
|
(97.1)
|
|
North Carolina
|
11,850
|
(43.1)
|
14,518
|
(52.8)
|
1,146
|
(4.2)
|
27,514
|
(89.9)
|
|
North Dakota
|
996
|
(78.1)
|
53
|
(4.2)
|
227
|
(17.8)
|
1,276
|
(98.9)
|
|
Ohio
|
15,683
|
(58.1)
|
10,647
|
(39.4)
|
679
|
(2.5)
|
27,009
|
(94.0)
|
|
Oklahoma
|
4,665
|
(72.6)
|
1,095
|
(17.0)
|
670
|
(10.4)
|
6,430
|
(100.0)
|
|
Oregon
|
8,830
|
(86.0)
|
568
|
(5.5)
|
874
|
(8.5)
|
10,272
|
(95.1)
|
|
Pennsylvania††
|
18,403
|
(53.0)
|
15,127
|
(43.6)
|
1,196
|
(3.4)
|
34,726
|
(97.3)
|
|
South Carolina
|
3,788
|
(55.3)
|
2,801
|
(40.9)
|
261
|
(3.8)
|
6,850
|
(99.1)
|
|
South Dakota
|
573
|
(75.8)
|
61
|
(8.1)
|
122
|
(16.1)
|
756
|
(98.3)
|
|
Tennessee
|
8,159
|
(48.2)
|
8,300
|
(49.0)
|
477
|
(2.8)
|
16,936
|
(96.9)
|
|
Virginia
|
13,414
|
(48.9)
|
11,726
|
(42.7)
|
2,302
|
(8.4)
|
27,442
|
(100.0)
|
|
West Virginia
|
1,511
|
(85.5)
|
228
|
(12.9)
|
29
|
(1.6)
|
1,768
|
(99.8)
|
|
Total
|
178,291
|
(52.4)
|
135,490
|
(39.8)
|
26,345
|
(7.7)
|
340,126
|
(95.7)
|
|
Abortion rate§§
|
8.1
|
|
27.8
|
|
19.4
|
|
12.1
|
|
|
Abortion ratio¶¶
|
127
|
|
388
|
|
258
|
|
183
|
|
|
Race
|
Year
|
% change
|
|
2000
|
2001
|
2002
|
2003
|
2004
|
2005
|
2006
|
2007
|
2008
|
2009
|
2000 to 2004
|
2005 to 2009
|
2008 to 2009
|
2000 to 2009
|
|
% of abortions
|
|
White
|
54.1
|
53.7
|
53.9
|
54.2
|
54.2
|
53.6
|
53.4
|
53.2
|
52.0
|
51.2
|
0.2
|
-4.5
|
-1.5
|
-5.4
|
|
Black
|
38.7
|
38.2
|
38.3
|
38.2
|
38.1
|
38.4
|
38.7
|
38.7
|
40.3
|
41.2
|
-1.6
|
7.3
|
2.2
|
6.5
|
|
Other
|
7.2
|
8.0
|
7.7
|
7.6
|
7.7
|
8.0
|
7.9
|
8.1
|
7.7
|
7.6
|
6.9
|
-5.0
|
-1.3
|
5.6
|
|
Abortion rate†
|
|
White
|
9.3
|
9.2
|
9.1
|
9.4
|
9.2
|
8.9
|
9.2
|
9.0
|
8.9
|
8.4
|
-1.1
|
-5.6
|
-5.6
|
-9.7
|
|
Black
|
31.6
|
30.7
|
30.2
|
30.4
|
29.5
|
28.8
|
29.5
|
28.6
|
30.1
|
29.0
|
-6.6
|
0.7
|
-3.7
|
-8.2
|
|
Other
|
26.6
|
28.1
|
25.6
|
25.1
|
24.3
|
24.4
|
23.8
|
23.8
|
23.0
|
21.0
|
-8.6
|
-13.9
|
-8.7
|
-21.1
|
|
Abortion ratio§
|
|
White
|
149
|
148
|
147
|
147
|
144
|
139
|
138
|
134
|
135
|
131
|
-3.4
|
-5.8
|
-3.0
|
-12.1
|
|
Black
|
445
|
449
|
453
|
451
|
429
|
413
|
401
|
385
|
404
|
405
|
-3.6
|
-1.9
|
0.2
|
-9.0
|
|
Other
|
395
|
428
|
385
|
366
|
343
|
342
|
329
|
310
|
298
|
282
|
-13.2
|
-17.5
|
-5.4
|
-28.6
|
|
Total (no.)
|
176,902
|
174,886
|
172,208
|
174,327
|
170,002
|
165,301
|
168,403
|
164,111
|
161,107
|
152,004
|
—
|
—
|
—
|
—
|
|
State/Area
|
Hispanic
|
Non-Hispanic
|
Total abortions reported by known ethnicity
|
|
No.
|
(%)†
|
No.
|
(%)
|
No.
|
% of all reported abortions§
|
|
Alabama
|
428
|
(4.0)
|
10,401
|
(96.0)
|
10,829
|
(99.5)
|
|
Alaska
|
54
|
(3.2)
|
1,645
|
(96.8)
|
1,699
|
(87.7)
|
|
Arizona
|
3,593
|
(35.7)
|
6,474
|
(64.3)
|
10,067
|
(98.0)
|
|
Arkansas
|
274
|
(6.0)
|
4,303
|
(94.0)
|
4,577
|
(99.9)
|
|
Colorado
|
2,938
|
(25.8)
|
8,471
|
(74.2)
|
11,409
|
(98.4)
|
|
District of Columbia¶
|
323
|
(12.6)
|
2,232
|
(87.4)
|
2,555
|
(98.4)
|
|
Georgia
|
2,490
|
(7.8)
|
29,533
|
(92.2)
|
32,023
|
(97.3)
|
|
Hawaii
|
235
|
(7.2)
|
3,007
|
(92.8)
|
3,242
|
(97.0)
|
|
Idaho
|
231
|
(14.1)
|
1,406
|
(85.9)
|
1,637
|
(99.2)
|
|
Indiana
|
715
|
(7.1)
|
9,416
|
(92.9)
|
10,131
|
(96.0)
|
|
Kansas
|
887
|
(9.4)
|
8,511
|
(90.6)
|
9,398
|
(99.9)
|
|
Kentucky
|
101
|
(2.5)
|
4,019
|
(97.5)
|
4,120
|
(100.0)
|
|
Maine
|
69
|
(3.3)
|
2,045
|
(96.7)
|
2,114
|
(87.6)
|
|
Minnesota
|
711
|
(5.9)
|
11,385
|
(94.1)
|
12,096
|
(97.6)
|
|
Mississippi
|
31
|
(1.3)
|
2,407
|
(98.7)
|
2,438
|
(100.0)
|
|
Missouri
|
170
|
(2.5)
|
6,693
|
(97.5)
|
6,863
|
(99.7)
|
|
Montana
|
83
|
(4.1)
|
1,958
|
(95.9)
|
2,041
|
(91.8)
|
|
New Jersey**
|
6,261
|
(22.7)
|
21,356
|
(77.3)
|
27,617
|
(96.8)
|
|
New York††
|
32,657
|
(27.2)
|
87,339
|
(72.8)
|
119,996
|
(100.0)
|
|
New York City
|
28,364
|
(32.5)
|
58,909
|
(67.5)
|
87,273
|
(100.0)
|
|
New York State
|
4,293
|
(13.1)
|
28,430
|
(86.9)
|
32,723
|
(100.0)
|
|
North Dakota
|
52
|
(4.7)
|
1,056
|
(95.3)
|
1,108
|
(85.9)
|
|
Ohio
|
1,041
|
(3.7)
|
27,321
|
(96.3)
|
28,362
|
(98.8)
|
|
Oregon
|
1,248
|
(11.7)
|
9,449
|
(88.3)
|
10,697
|
(99.0)
|
|
South Carolina
|
394
|
(5.8)
|
6,351
|
(94.2)
|
6,745
|
(97.6)
|
|
South Dakota
|
37
|
(4.8)
|
732
|
(95.2)
|
769
|
(100.0)
|
|
Tennessee
|
656
|
(3.8)
|
16,539
|
(96.2)
|
17,195
|
(98.4)
|
|
Texas
|
29,576
|
(38.3)
|
47,576
|
(61.7)
|
77,152
|
(99.4)
|
|
Utah
|
797
|
(24.4)
|
2,475
|
(75.6)
|
3,272
|
(89.3)
|
|
Virginia
|
4,015
|
(14.6)
|
23,427
|
(85.4)
|
27,442
|
(100.0)
|
|
West Virginia
|
14
|
(0.8)
|
1,756
|
(99.2)
|
1,770
|
(99.9)
|
|
Wisconsin§§
|
809
|
(9.7)
|
7,490
|
(90.3)
|
8,299
|
(100.0)
|
|
Total
|
90,890
|
(19.9)
|
366,773
|
(80.1)
|
457,663
|
(98.7)
|
|
Abortion rate¶¶
|
18.8
|
|
13.3
|
|
14.1
|
|
|
Abortion ratio***
|
189
|
|
212
|
|
207
|
|
|
Ethnicity
|
Year
|
% change
|
|
2000
|
2001
|
2002
|
2003
|
2004
|
2005
|
2006
|
2007
|
2008
|
2009
|
2000 to 2004
|
2005 to 2009
|
2008 to 2009
|
2000 to 2009
|
|
% of abortions
|
|
Hispanic
|
20.9
|
21.5
|
22.4
|
22.6
|
22.8
|
22.6
|
23.4
|
23.2
|
23.6
|
23.3
|
9.1
|
3.1
|
-1.3
|
11.5
|
|
Non-Hispanic
|
79.1
|
78.5
|
77.6
|
77.4
|
77.2
|
77.4
|
76.6
|
76.8
|
76.4
|
76.7
|
-2.4
|
-0.9
|
0.4
|
-3.0
|
|
Abortion rate†
|
|
Hispanic
|
24.2
|
23.8
|
24.0
|
23.7
|
23.0
|
21.9
|
22.6
|
21.8
|
21.6
|
20.2
|
-5.0
|
-7.8
|
-6.5
|
-16.5
|
|
Non-Hispanic
|
15.6
|
15.5
|
15.4
|
15.3
|
15.0
|
14.9
|
15.2
|
14.9
|
14.8
|
14.3
|
-3.8
|
-4.0
|
-3.4
|
-8.3
|
|
Abortion ratio§
|
|
Hispanic
|
249
|
246
|
246
|
239
|
229
|
218
|
220
|
210
|
211
|
206
|
-8.0
|
-5.5
|
-2.4
|
-17.3
|
|
Non-Hispanic
|
196
|
195
|
193
|
188
|
183
|
181
|
177
|
171
|
171
|
170
|
-6.6
|
-6.1
|
-0.6
|
-13.3
|
|
Total (no.)
|
389,872
|
380,542
|
382,137
|
379,193
|
376,880
|
362,629
|
361,153
|
377,047
|
372,685
|
370,069
|
—
|
—
|
—
|
—
|
|
State/Area
|
Marital status
|
Total abortions reported by known marital status
|
|
Married
|
Unmarried
|
No.
|
% of all reported abortions§
|
|
No.
|
(%)†
|
No.
|
(%)
|
|
Alabama
|
1,189
|
(11.0)
|
9,664
|
(89.0)
|
10,853
|
(99.7)
|
|
Alaska
|
366
|
(19.2)
|
1,543
|
(80.8)
|
1,909
|
(98.5)
|
|
Arizona
|
1,485
|
(14.5)
|
8,786
|
(85.5)
|
10,271
|
(100.0)
|
|
Arkansas
|
649
|
(14.2)
|
3,927
|
(85.8)
|
4,576
|
(99.9)
|
|
Colorado
|
2,013
|
(17.5)
|
9,467
|
(82.5)
|
11,480
|
(99.0)
|
|
District of Columbia¶
|
244
|
(9.6)
|
2,308
|
(90.4)
|
2,552
|
(98.3)
|
|
Hawaii
|
601
|
(18.3)
|
2,689
|
(81.7)
|
3,290
|
(98.4)
|
|
Idaho
|
318
|
(19.3)
|
1,331
|
(80.7)
|
1,649
|
(99.9)
|
|
Illinois**
|
4,905
|
(12.3)
|
35,035
|
(87.7)
|
39,940
|
(96.7)
|
|
Indiana
|
1,676
|
(15.9)
|
8,844
|
(84.1)
|
10,520
|
(99.6)
|
|
Iowa
|
965
|
(16.6)
|
4,850
|
(83.4)
|
5,815
|
(99.9)
|
|
Kansas
|
1,454
|
(15.5)
|
7,948
|
(84.5)
|
9,402
|
(99.9)
|
|
Kentucky
|
519
|
(12.6)
|
3,601
|
(87.4)
|
4,120
|
(100.0)
|
|
Maine
|
331
|
(13.9)
|
2,051
|
(86.1)
|
2,382
|
(98.7)
|
|
Michigan
|
2,359
|
(10.6)
|
19,980
|
(89.4)
|
22,339
|
(99.9)
|
|
Minnesota
|
1,789
|
(14.7)
|
10,384
|
(85.3)
|
12,173
|
(98.3)
|
|
Mississippi
|
178
|
(7.3)
|
2,259
|
(92.7)
|
2,437
|
(100.0)
|
|
Missouri
|
1,082
|
(15.9)
|
5,722
|
(84.1)
|
6,804
|
(98.9)
|
|
Montana
|
378
|
(17.4)
|
1,792
|
(82.6)
|
2,170
|
(97.6)
|
|
New Jersey††
|
3,619
|
(12.8)
|
24,707
|
(87.2)
|
28,326
|
(99.3)
|
|
New Mexico
|
672
|
(13.7)
|
4,218
|
(86.3)
|
4,890
|
(97.4)
|
|
New York City
|
12,395
|
(14.5)
|
72,962
|
(85.5)
|
85,357
|
(97.8)
|
|
North Carolina
|
5,555
|
(18.9)
|
23,799
|
(81.1)
|
29,354
|
(95.9)
|
|
North Dakota
|
198
|
(15.4)
|
1,087
|
(84.6)
|
1,285
|
(99.6)
|
|
Ohio
|
3,771
|
(13.7)
|
23,779
|
(86.3)
|
27,550
|
(95.9)
|
|
Oklahoma
|
1,307
|
(20.3)
|
5,123
|
(79.7)
|
6,430
|
(100.0)
|
|
Oregon
|
1,990
|
(19.1)
|
8,438
|
(80.9)
|
10,428
|
(96.5)
|
|
Pennsylvania**
|
4,500
|
(12.6)
|
31,182
|
(87.4)
|
35,682
|
(100.0)
|
|
Rhode Island
|
701
|
(17.5)
|
3,310
|
(82.5)
|
4,011
|
(92.7)
|
|
South Carolina
|
983
|
(14.3)
|
5,886
|
(85.7)
|
6,869
|
(99.4)
|
|
South Dakota
|
125
|
(16.3)
|
644
|
(83.7)
|
769
|
(100.0)
|
|
Tennessee
|
2,311
|
(13.8)
|
14,462
|
(86.2)
|
16,773
|
(96.0)
|
|
Texas
|
13,332
|
(17.2)
|
64,160
|
(82.8)
|
77,492
|
(99.8)
|
|
Utah
|
859
|
(25.3)
|
2,531
|
(74.7)
|
3,390
|
(92.5)
|
|
Virginia
|
4,488
|
(17.9)
|
20,571
|
(82.1)
|
25,059
|
(91.3)
|
|
West Virginia
|
317
|
(17.9)
|
1,451
|
(82.1)
|
1,768
|
(99.8)
|
|
Wisconsin**
|
1,190
|
(14.3)
|
7,104
|
(85.7)
|
8,294
|
(99.9)
|
|
Total
|
80,814
|
(15.0)
|
457,595
|
(85.0)
|
538,409
|
(98.0)
|
|
State/Area
|
No. of previous live births
|
Total abortions reported by known no. of previous live births
|
|
0
|
1
|
2
|
3
|
≥4
|
No.
|
% of all reported abortions§
|
|
No.
|
(%)†
|
No.
|
(%)
|
No.
|
(%)
|
No.
|
(%)
|
No.
|
(%)
|
|
Alabama
|
4,259
|
(39.1)
|
3,231
|
(29.7)
|
2,140
|
(19.7)
|
834
|
(7.7)
|
417
|
(3.8)
|
10,881
|
(100.0)
|
|
Alaska
|
823
|
(42.7)
|
478
|
(24.8)
|
335
|
(17.4)
|
184
|
(9.5)
|
109
|
(5.7)
|
1,929
|
(99.5)
|
|
Arizona
|
4,487
|
(43.8)
|
2,339
|
(22.8)
|
1,886
|
(18.4)
|
938
|
(9.2)
|
601
|
(5.9)
|
10,251
|
(99.8)
|
|
Arkansas
|
1,690
|
(36.9)
|
1,311
|
(28.6)
|
992
|
(21.7)
|
387
|
(8.4)
|
200
|
(4.4)
|
4,580
|
(100.0)
|
|
Colorado
|
5,561
|
(49.4)
|
2,491
|
(22.1)
|
1,911
|
(17.0)
|
857
|
(7.6)
|
441
|
(3.9)
|
11,261
|
(97.1)
|
|
Hawaii
|
1,447
|
(50.7)
|
609
|
(21.3)
|
459
|
(16.1)
|
212
|
(7.4)
|
126
|
(4.4)
|
2,853
|
(85.4)
|
|
Idaho
|
759
|
(46.0)
|
371
|
(22.5)
|
306
|
(18.6)
|
139
|
(8.4)
|
74
|
(4.5)
|
1,649
|
(99.9)
|
|
Indiana
|
3,883
|
(36.8)
|
2,822
|
(26.8)
|
2,319
|
(22.0)
|
949
|
(9.0)
|
573
|
(5.4)
|
10,546
|
(99.9)
|
|
Iowa
|
2,527
|
(43.4)
|
1,399
|
(24.1)
|
1,120
|
(19.3)
|
501
|
(8.6)
|
270
|
(4.6)
|
5,817
|
(99.9)
|
|
Kansas
|
3,715
|
(39.5)
|
2,480
|
(26.4)
|
1,928
|
(20.5)
|
834
|
(8.9)
|
453
|
(4.8)
|
9,410
|
(100.0)
|
|
Kentucky
|
1,648
|
(40.0)
|
1,175
|
(28.5)
|
797
|
(19.3)
|
331
|
(8.0)
|
169
|
(4.1)
|
4,120
|
(100.0)
|
|
Louisiana
|
3,309
|
(42.7)
|
2,056
|
(26.5)
|
1,444
|
(18.6)
|
610
|
(7.9)
|
332
|
(4.3)
|
7,751
|
(94.9)
|
|
Maine
|
1,269
|
(52.6)
|
557
|
(23.1)
|
395
|
(16.4)
|
132
|
(5.5)
|
60
|
(2.5)
|
2,413
|
(100.0)
|
|
Michigan¶
|
8,953
|
(40.0)
|
5,938
|
(26.6)
|
4,309
|
(19.3)
|
1,966
|
(8.8)
|
1,191
|
(5.3)
|
22,357
|
(100.0)
|
|
Minnesota
|
5,208
|
(42.1)
|
3,007
|
(24.3)
|
2,420
|
(19.6)
|
1,034
|
(8.4)
|
709
|
(5.7)
|
12,378
|
(99.9)
|
|
Mississippi
|
760
|
(31.2)
|
814
|
(33.4)
|
547
|
(22.4)
|
209
|
(8.6)
|
107
|
(4.4)
|
2,437
|
(100.0)
|
|
Missouri
|
2,732
|
(39.7)
|
1,816
|
(26.4)
|
1,391
|
(20.2)
|
572
|
(8.3)
|
370
|
(5.4)
|
6,881
|
(100.0)
|
|
Montana
|
1,038
|
(46.7)
|
541
|
(24.3)
|
386
|
(17.4)
|
162
|
(7.3)
|
96
|
(4.3)
|
2,223
|
(100.0)
|
|
Nebraska
|
1,066
|
(41.8)
|
663
|
(26.0)
|
475
|
(18.6)
|
228
|
(8.9)
|
119
|
(4.7)
|
2,551
|
(100.0)
|
|
Nevada
|
4,015
|
(42.9)
|
2,260
|
(24.2)
|
1,723
|
(18.4)
|
816
|
(8.7)
|
536
|
(5.7)
|
9,350
|
(98.0)
|
|
New Jersey**
|
11,174
|
(39.6)
|
7,810
|
(27.7)
|
5,389
|
(19.1)
|
2,256
|
(8.0)
|
1,562
|
(5.5)
|
28,191
|
(98.8)
|
|
New York City
|
34,074
|
(40.3)
|
23,307
|
(27.5)
|
16,345
|
(19.3)
|
6,858
|
(8.1)
|
4,065
|
(4.8)
|
84,649
|
(97.0)
|
|
North Carolina
|
10,932
|
(40.3)
|
6,910
|
(25.5)
|
5,118
|
(18.9)
|
2,405
|
(8.9)
|
1,750
|
(6.5)
|
27,115
|
(88.6)
|
|
North Dakota
|
516
|
(40.0)
|
321
|
(24.9)
|
251
|
(19.5)
|
131
|
(10.2)
|
71
|
(5.5)
|
1,290
|
(100.0)
|
|
Ohio††
|
9,890
|
(35.7)
|
7,932
|
(28.6)
|
5,855
|
(21.1)
|
2,549
|
(9.2)
|
1484
|
(5.4)
|
27,710
|
(96.5)
|
|
Oklahoma
|
2,505
|
(39.0)
|
1,663
|
(25.9)
|
1,375
|
(21.4)
|
606
|
(9.4)
|
281
|
(4.4)
|
6,430
|
(100.0)
|
|
Oregon
|
5,109
|
(48.3)
|
2,428
|
(23.0)
|
1,854
|
(17.5)
|
760
|
(7.2)
|
422
|
(4.0)
|
10,573
|
(97.9)
|
|
Pennsylvania
|
15,161
|
(40.7)
|
10,085
|
(27.0)
|
7,116
|
(19.1)
|
3,137
|
(8.4)
|
1,785
|
(4.8)
|
37,284
|
(100.0)
|
|
South Carolina
|
3,013
|
(43.6)
|
1,923
|
(27.8)
|
1,249
|
(18.1)
|
510
|
(7.4)
|
216
|
(3.1)
|
6,911
|
(100.0)
|
|
South Dakota
|
325
|
(42.3)
|
192
|
(25.0)
|
151
|
(19.7)
|
63
|
(8.2)
|
37
|
(4.8)
|
768
|
(99.9)
|
|
Tennessee
|
5,756
|
(33.4)
|
4,787
|
(27.8)
|
3,646
|
(21.2)
|
1,802
|
(10.5)
|
1,235
|
(7.2)
|
17,226
|
(98.6)
|
|
Texas
|
29,006
|
(37.4)
|
20,784
|
(26.8)
|
16,608
|
(21.4)
|
7,277
|
(9.4)
|
3,882
|
(5.0)
|
77,557
|
(99.9)
|
|
Utah
|
1,516
|
(42.0)
|
835
|
(23.1)
|
698
|
(19.3)
|
349
|
(9.7)
|
210
|
(5.8)
|
3,608
|
(98.4)
|
|
Virginia
|
10,486
|
(38.8)
|
7,409
|
(27.4)
|
5,607
|
(20.8)
|
2,326
|
(8.6)
|
1,179
|
(4.4)
|
27,007
|
(98.4)
|
|
Washington
|
10,655
|
(47.2)
|
5,483
|
(24.3)
|
3,910
|
(17.3)
|
1,675
|
(7.4)
|
865
|
(3.8)
|
22,588
|
(99.6)
|
|
West Virginia
|
629
|
(35.5)
|
565
|
(31.9)
|
364
|
(20.5)
|
158
|
(8.9)
|
56
|
(3.2)
|
1,772
|
(100.0)
|
|
Total
|
209,896
|
(40.2)
|
138,792
|
(26.6)
|
102,819
|
(19.7)
|
44,757
|
(8.6)
|
26,053
|
(5.0)
|
522,317
|
(98.1)
|
|
State/Area
|
No. of previous induced abortions
|
Total abortions reported by known no. of previous induced abortions
|
|
0
|
1
|
2
|
≥3
|
No.
|
% of all reported abortions§
|
|
No.
|
(%)†
|
No.
|
(%)
|
No.
|
(%)
|
No.
|
(%)
|
|
Alabama
|
6,978
|
(64.1)
|
2,725
|
(25.0)
|
846
|
(7.8)
|
332
|
(3.1)
|
10,881
|
(100.0)
|
|
Alaska
|
1,173
|
(61.6)
|
435
|
(22.9)
|
214
|
(11.2)
|
81
|
(4.3)
|
1,903
|
(98.2)
|
|
Arizona
|
6,023
|
(58.8)
|
2,824
|
(27.6)
|
1,001
|
(9.8)
|
397
|
(3.9)
|
10,245
|
(99.7)
|
|
Arkansas
|
2,919
|
(65.6)
|
980
|
(22.0)
|
383
|
(8.6)
|
166
|
(3.7)
|
4,448
|
(97.1)
|
|
Colorado
|
7,363
|
(64.6)
|
2,771
|
(24.3)
|
876
|
(7.7)
|
383
|
(3.4)
|
11,393
|
(98.2)
|
|
Idaho
|
1,174
|
(71.2)
|
347
|
(21.1)
|
89
|
(5.4)
|
38
|
(2.3)
|
1,648
|
(99.9)
|
|
Indiana
|
6,600
|
(62.6)
|
2,552
|
(24.2)
|
891
|
(8.4)
|
505
|
(4.8)
|
10,548
|
(99.9)
|
|
Iowa
|
3,768
|
(64.8)
|
1,434
|
(24.7)
|
403
|
(6.9)
|
206
|
(3.5)
|
5,811
|
(99.8)
|
|
Kansas
|
5,716
|
(60.7)
|
2,251
|
(23.9)
|
917
|
(9.7)
|
526
|
(5.6)
|
9,410
|
(100.0)
|
|
Kentucky
|
2,537
|
(61.6)
|
1,013
|
(24.6)
|
358
|
(8.7)
|
211
|
(5.1)
|
4,119
|
(100.0)
|
|
Louisiana
|
5,567
|
(69.8)
|
1,681
|
(21.1)
|
541
|
(6.8)
|
187
|
(2.3)
|
7,976
|
(97.7)
|
|
Maine
|
1,477
|
(62.1)
|
589
|
(24.7)
|
230
|
(9.7)
|
84
|
(3.5)
|
2,380
|
(98.6)
|
|
Michigan
|
11,538
|
(51.6)
|
5,806
|
(26.0)
|
2,914
|
(13.0)
|
2,099
|
(9.4)
|
22,357
|
(100.0)
|
|
Minnesota
|
7,351
|
(59.3)
|
2,890
|
(23.3)
|
1,198
|
(9.7)
|
949
|
(7.7)
|
12,388
|
(100.0)
|
|
Mississippi
|
1,499
|
(61.5)
|
663
|
(27.2)
|
202
|
(8.3)
|
73
|
(3.0)
|
2,437
|
(100.0)
|
|
Missouri
|
4,105
|
(59.7)
|
1,702
|
(24.7)
|
656
|
(9.5)
|
416
|
(6.0)
|
6,879
|
(100.0)
|
|
Montana
|
736
|
(33.1)
|
826
|
(37.2)
|
387
|
(17.4)
|
274
|
(12.3)
|
2,223
|
(100.0)
|
|
Nebraska
|
1,729
|
(67.8)
|
576
|
(22.6)
|
168
|
(6.6)
|
78
|
(3.1)
|
2,551
|
(100.0)
|
|
Nevada
|
5,030
|
(53.6)
|
2,542
|
(27.1)
|
1,092
|
(11.6)
|
722
|
(7.7)
|
9,386
|
(98.4)
|
|
New Jersey¶
|
18,356
|
(65.1)
|
4,984
|
(17.7)
|
2,633
|
(9.3)
|
2,218
|
(7.9)
|
28,191
|
(98.8)
|
|
New York
|
49,873
|
(44.4)
|
28,806
|
(25.6)
|
16,858
|
(15.0)
|
16,872
|
(15.0)
|
112,409
|
(93.7)
|
|
New York City
|
35,774
|
(42.4)
|
21,797
|
(25.8)
|
13,131
|
(15.6)
|
13,699
|
(16.2)
|
84,401
|
(96.7)
|
|
New York State
|
14,099
|
(50.3)
|
7,009
|
(25.0)
|
3,727
|
(13.3)
|
3,173
|
(11.3)
|
28,008
|
(85.6)
|
|
North Carolina
|
16,372
|
(60.7)
|
6,644
|
(24.6)
|
2,635
|
(9.8)
|
1,330
|
(4.9)
|
26,981
|
(88.2)
|
|
North Dakota
|
887
|
(68.8)
|
262
|
(20.3)
|
90
|
(7.0)
|
51
|
(4.0)
|
1,290
|
(100.0)
|
|
Ohio
|
14,027
|
(52.9)
|
7,279
|
(27.5)
|
3,147
|
(11.9)
|
2,050
|
(7.7)
|
26,503
|
(92.3)
|
|
Oklahoma
|
4,132
|
(64.3)
|
1,496
|
(23.3)
|
510
|
(7.9)
|
292
|
(4.5)
|
6,430
|
(100.0)
|
|
Oregon
|
6,180
|
(58.0)
|
2,557
|
(24.0)
|
1,059
|
(9.9)
|
855
|
(8.0)
|
10,651
|
(98.6)
|
|
Pennsylvania
|
20,263
|
(56.5)
|
9,401
|
(26.2)
|
4,401
|
(12.3)
|
1,829
|
(5.1)
|
35,894
|
(96.3)
|
|
Rhode Island
|
2,311
|
(54.1)
|
1,091
|
(25.5)
|
476
|
(11.1)
|
393
|
(9.2)
|
4,271
|
(98.7)
|
|
South Carolina
|
3,850
|
(55.7)
|
1,746
|
(25.3)
|
800
|
(11.6)
|
515
|
(7.5)
|
6,911
|
(100.0)
|
|
South Dakota
|
537
|
(69.8)
|
158
|
(20.5)
|
49
|
(6.4)
|
25
|
(3.3)
|
769
|
(100.0)
|
|
Tennessee
|
8,990
|
(52.2)
|
4,631
|
(26.9)
|
2,116
|
(12.3)
|
1,491
|
(8.7)
|
17,228
|
(98.6)
|
|
Texas
|
44,345
|
(57.2)
|
20,355
|
(26.3)
|
8,172
|
(10.5)
|
4,660
|
(6.0)
|
77,532
|
(99.9)
|
|
Utah
|
2,500
|
(69.8)
|
734
|
(20.5)
|
237
|
(6.6)
|
111
|
(3.1)
|
3,582
|
(97.7)
|
|
Virginia
|
14,597
|
(53.8)
|
7,399
|
(27.2)
|
3,184
|
(11.7)
|
1,977
|
(7.3)
|
27,157
|
(99.0)
|
|
Washington
|
12,445
|
(55.1)
|
5,637
|
(25.0)
|
2,573
|
(11.4)
|
1,915
|
(8.5)
|
22,570
|
(99.6)
|
|
West Virginia
|
983
|
(55.5)
|
467
|
(26.4)
|
198
|
(11.2)
|
124
|
(7.0)
|
1,772
|
(100.0)
|
|
Total
|
303,931
|
(55.3)
|
138,254
|
(25.2)
|
62,504
|
(11.4)
|
44,435
|
(8.1)
|
549,124
|
(97.0)
|
|
Characteristic
|
White
|
Black
|
Other
|
Total
|
|
No.
|
(%)*
|
No.
|
(%)
|
No.
|
(%)
|
No.
|
(%)
|
|
Age group (yrs)†
|
|
<15
|
645
|
(0.4)
|
779
|
(0.7)
|
81
|
(0.3)
|
1,505
|
(0.5)
|
|
15–19
|
24,523
|
(15.7)
|
18,635
|
(16.2)
|
2,913
|
(11.7)
|
46,071
|
(15.6)
|
|
15
|
1,318
|
(0.8)
|
1,294
|
(1.1)
|
152
|
(0.6)
|
2,764
|
(0.9)
|
|
16
|
2,522
|
(1.6)
|
2,156
|
(1.9)
|
304
|
(1.2)
|
4,982
|
(1.7)
|
|
17
|
4,065
|
(2.6)
|
3,146
|
(2.7)
|
453
|
(1.8)
|
7,664
|
(2.6)
|
|
18
|
7,415
|
(4.7)
|
5,232
|
(4.5)
|
872
|
(3.5)
|
13,519
|
(4.6)
|
|
19
|
9,203
|
(5.9)
|
6,807
|
(5.9)
|
1,132
|
(4.6)
|
17,142
|
(5.8)
|
|
20–24
|
52,792
|
(33.8)
|
38,391
|
(33.3)
|
7,190
|
(28.9)
|
98,373
|
(33.2)
|
|
25–29
|
36,574
|
(23.4)
|
29,358
|
(25.5)
|
6,239
|
(25.1)
|
72,171
|
(24.4)
|
|
30–34
|
21,725
|
(13.9)
|
17,083
|
(14.8)
|
4,414
|
(17.8)
|
43,222
|
(14.6)
|
|
35–39
|
14,403
|
(9.2)
|
8,679
|
(7.5)
|
2,808
|
(11.3)
|
25,890
|
(8.7)
|
|
≥40
|
5,480
|
(3.5)
|
2,295
|
(2.0)
|
1,210
|
(4.9)
|
8,985
|
(3.0)
|
|
Marital status§
|
|
Married
|
24,518
|
(16.9)
|
8,255
|
(8.7)
|
6,536
|
(28.1)
|
39,309
|
(14.9)
|
|
Unmarried
|
120,957
|
(83.1)
|
86,382
|
(91.3)
|
16,716
|
(71.9)
|
224,055
|
(85.1)
|
|
Characteristic
|
Non-Hispanic
|
Hispanic
|
Total
|
|
White
|
Black
|
Other
|
|
No.
|
(%)*
|
No.
|
(%)
|
No.
|
(%)
|
No.
|
(%)
|
No.
|
(%)
|
|
Age group (yrs)†
|
|
<15
|
550
|
(0.3)
|
928
|
(0.6)
|
72
|
(0.3)
|
436
|
(0.5)
|
1,986
|
(0.5)
|
|
15–19
|
24,307
|
(15.1)
|
24,408
|
(16.0)
|
2,751
|
(10.1)
|
13,071
|
(14.6)
|
64,537
|
(15.0)
|
|
15
|
1,235
|
(0.8)
|
1,626
|
(1.1)
|
126
|
(0.5)
|
740
|
(0.8)
|
3,727
|
(0.9)
|
|
16
|
2,444
|
(1.5)
|
2,899
|
(1.9)
|
291
|
(1.1)
|
1,440
|
(1.6)
|
7,074
|
(1.6)
|
|
17
|
4,162
|
(2.6)
|
4,460
|
(2.9)
|
448
|
(1.6)
|
2,211
|
(2.5)
|
11,281
|
(2.6)
|
|
18
|
7,241
|
(4.5)
|
6,777
|
(4.4)
|
806
|
(3.0)
|
3,693
|
(4.1)
|
18,517
|
(4.3)
|
|
19
|
9,225
|
(5.7)
|
8,646
|
(5.7)
|
1,080
|
(4.0)
|
4,987
|
(5.6)
|
23,938
|
(5.6)
|
|
20–24
|
53,912
|
(33.6)
|
49,506
|
(32.4)
|
7,296
|
(26.9)
|
28,770
|
(32.2)
|
139,484
|
(32.4)
|
|
25–29
|
38,195
|
(23.8)
|
38,777
|
(25.4)
|
6,848
|
(25.2)
|
22,996
|
(25.7)
|
106,816
|
(24.8)
|
|
30–34
|
22,344
|
(13.9)
|
23,243
|
(15.2)
|
5,016
|
(18.5)
|
13,950
|
(15.6)
|
64,553
|
(15.0)
|
|
35–39
|
15,121
|
(9.4)
|
12,239
|
(8.0)
|
3,600
|
(13.3)
|
7,471
|
(8.4)
|
38,431
|
(8.9)
|
|
≥40
|
6,076
|
(3.8)
|
3,758
|
(2.5)
|
1,582
|
(5.8)
|
2,623
|
(2.9)
|
14,039
|
(3.3)
|
|
Marital status§
|
|
Married
|
22,917
|
(16.7)
|
11,751
|
(9.4)
|
8,544
|
(34.0)
|
13,148
|
(16.2)
|
56,360
|
(15.3)
|
|
Unmarried
|
114,448
|
(83.3)
|
113,700
|
(90.6)
|
16,590
|
(66.0)
|
68,053
|
(83.8)
|
312,791
|
(84.7)
|
|
Characteristic
|
Weeks of gestation
|
|
≤8
|
9–13
|
14–15
|
16–17
|
18–20
|
≥21
|
|
No.
|
(%)
|
No.
|
(%)
|
No.
|
(%)
|
No.
|
(%)
|
No.
|
(%)
|
No.
|
(%)
|
|
Age group (yrs) *,†
|
|
<15
|
1,224
|
(46.5)
|
909
|
(34.5)
|
161
|
(6.1)
|
105
|
(4.0)
|
125
|
(4.7)
|
108
|
(4.1)
|
|
15–19
|
45,994
|
(54.3)
|
28,668
|
(33.9)
|
3,936
|
(4.7)
|
2,229
|
(2.6)
|
2,182
|
(2.6)
|
1,630
|
(1.9)
|
|
20–24
|
111,704
|
(62.1)
|
52,436
|
(29.2)
|
6,639
|
(3.7)
|
3,492
|
(1.9)
|
3,244
|
(1.8)
|
2,262
|
(1.3)
|
|
25–29
|
90,606
|
(66.8)
|
35,360
|
(26.1)
|
4,036
|
(3.0)
|
2,100
|
(1.5)
|
2,033
|
(1.5)
|
1,532
|
(1.1)
|
|
30–34
|
56,453
|
(68.9)
|
20,104
|
(24.6)
|
2,108
|
(2.6)
|
1,209
|
(1.5)
|
1,162
|
(1.4)
|
854
|
(1.0)
|
|
35–39
|
34,130
|
(69.9)
|
11,438
|
(23.4)
|
1,211
|
(2.5)
|
750
|
(1.5)
|
787
|
(1.6)
|
503
|
(1.0)
|
|
≥40
|
12,686
|
(71.2)
|
3,757
|
(21.1)
|
480
|
(2.7)
|
302
|
(1.7)
|
330
|
(1.9)
|
253
|
(1.4)
|
|
Total
|
352,797
|
(64.0)
|
152,672
|
(27.7)
|
18,571
|
(3.4)
|
10,187
|
(1.8)
|
9,863
|
(1.8)
|
7,142
|
(1.3)
|
|
Race*,§
|
|
White
|
106,978
|
(67.7)
|
40,774
|
(25.8)
|
4,160
|
(2.6)
|
2,480
|
(1.6)
|
2,142
|
(1.4)
|
1,385
|
(0.9)
|
|
Black
|
66,788
|
(56.3)
|
40,114
|
(33.8)
|
5,027
|
(4.2)
|
2,986
|
(2.5)
|
2,368
|
(2.0)
|
1,318
|
(1.1)
|
|
Other
|
17,077
|
(68.4)
|
5,817
|
(23.3)
|
822
|
(3.3)
|
480
|
(1.9)
|
495
|
(2.0)
|
267
|
(1.1)
|
|
Total
|
190,843
|
(63.3)
|
86,705
|
(28.8)
|
10,009
|
(3.3)
|
5,946
|
(2.0)
|
5,005
|
(1.7)
|
2,970
|
(1.0)
|
|
Race/Ethnicity*,¶
|
|
Non-Hispanic
|
|
White
|
105,518
|
(66.5)
|
42,188
|
(26.6)
|
4,289
|
(2.7)
|
2,312
|
(1.5)
|
2,415
|
(1.5)
|
1,957
|
(1.2)
|
|
Black
|
88,540
|
(58.4)
|
48,288
|
(31.9)
|
5,878
|
(3.9)
|
3,305
|
(2.2)
|
3,226
|
(2.1)
|
2,342
|
(1.5)
|
|
Other
|
19,050
|
(70.8)
|
5,711
|
(21.2)
|
765
|
(2.8)
|
434
|
(1.6)
|
562
|
(2.1)
|
390
|
(1.4)
|
|
Hispanic
|
59,739
|
(67.3)
|
22,044
|
(24.8)
|
2,937
|
(3.3)
|
1,405
|
(1.6)
|
1,493
|
(1.7)
|
1,102
|
(1.2)
|
|
Total
|
272,847
|
(64.1)
|
118,231
|
(27.8)
|
13,869
|
(3.3)
|
7,456
|
(1.8)
|
7,696
|
(1.8)
|
5,791
|
(1.4)
|
|
Characteristic
|
Weeks of gestation
|
|
≤6
|
7
|
8
|
9
|
10
|
11
|
12
|
13
|
|
No.
|
(%)
|
No.
|
(%)
|
No.
|
(%)
|
No.
|
(%)
|
No.
|
(%)
|
No.
|
(%)
|
No.
|
(%)
|
No.
|
(%)
|
|
Age group (yrs) *,†
|
|
<15
|
539
|
(25.3)
|
356
|
(16.7)
|
329
|
(15.4)
|
256
|
(12.0)
|
219
|
(10.3)
|
179
|
(8.4)
|
140
|
(6.6)
|
115
|
(5.4)
|
|
15–19
|
20,870
|
(28.0)
|
13,275
|
(17.8)
|
11,849
|
(15.9)
|
9,148
|
(12.3)
|
6,678
|
(8.9)
|
5,453
|
(7.3)
|
4,367
|
(5.8)
|
3,022
|
(4.0)
|
|
20–24
|
55,501
|
(33.8)
|
30,874
|
(18.8)
|
25,329
|
(15.4)
|
17,229
|
(10.5)
|
12,539
|
(7.6)
|
9,846
|
(6.0)
|
7,432
|
(4.5)
|
5,390
|
(3.3)
|
|
25–29
|
46,783
|
(37.1)
|
24,923
|
(19.8)
|
18,900
|
(15.0)
|
12,176
|
(9.7)
|
8,427
|
(6.7)
|
6,426
|
(5.1)
|
4,910
|
(3.9)
|
3,421
|
(2.7)
|
|
30–34
|
29,432
|
(38.4)
|
15,669
|
(20.5)
|
11,352
|
(14.8)
|
7,206
|
(9.4)
|
4,736
|
(6.2)
|
3,602
|
(4.7)
|
2,633
|
(3.4)
|
1,927
|
(2.5)
|
|
35–39
|
18,055
|
(39.6)
|
9,319
|
(20.5)
|
6,756
|
(14.8)
|
4,122
|
(9.0)
|
2,684
|
(5.9)
|
2,066
|
(4.5)
|
1,472
|
(3.2)
|
1,094
|
(2.4)
|
|
≥40
|
7,020
|
(42.7)
|
3,323
|
(20.2)
|
2,343
|
(14.2)
|
1,383
|
(8.4)
|
894
|
(5.4)
|
618
|
(3.8)
|
500
|
(3.0)
|
362
|
(2.2)
|
|
Total
|
178,200
|
(35.3)
|
97,739
|
(19.3)
|
76,858
|
(15.2)
|
51,520
|
(10.2)
|
36,177
|
(7.2)
|
28,190
|
(5.6)
|
21,454
|
(4.2)
|
15,331
|
(3.0)
|
|
Race*,§
|
|
White
|
54,896
|
(37.2)
|
29,794
|
(20.2)
|
22,288
|
(15.1)
|
13,901
|
(9.4)
|
9,575
|
(6.5)
|
7,610
|
(5.2)
|
5,610
|
(3.8)
|
4,078
|
(2.8)
|
|
Black
|
27,491
|
(25.7)
|
21,805
|
(20.4)
|
17,492
|
(16.4)
|
12,580
|
(11.8)
|
9,528
|
(8.9)
|
7,671
|
(7.2)
|
6,161
|
(5.8)
|
4,174
|
(3.9)
|
|
Other
|
8,998
|
(39.3)
|
4,768
|
(20.8)
|
3,311
|
(14.5)
|
2,025
|
(8.8)
|
1,269
|
(5.5)
|
977
|
(4.3)
|
735
|
(3.2)
|
811
|
(3.5)
|
|
Total
|
91,385
|
(32.9)
|
56,367
|
(20.3)
|
43,091
|
(15.5)
|
28,506
|
(10.3)
|
20,372
|
(7.3)
|
16,258
|
(5.9)
|
12,506
|
(4.5)
|
9,063
|
(3.3)
|
|
Race/Ethnicity*,¶
|
|
Non-Hispanic
|
|
White
|
54,129
|
(36.6)
|
28,876
|
(19.5)
|
22,513
|
(15.2)
|
14,484
|
(9.8)
|
9,890
|
(6.7)
|
7,858
|
(5.3)
|
5,693
|
(3.9)
|
4,263
|
(2.9)
|
|
Black
|
39,848
|
(29.1)
|
26,822
|
(19.6)
|
21,870
|
(16.0)
|
15,768
|
(11.5)
|
11,495
|
(8.4)
|
9,225
|
(6.7)
|
7,245
|
(5.3)
|
4,555
|
(3.3)
|
|
Other
|
10,814
|
(43.7)
|
4,911
|
(19.8)
|
3,325
|
(13.4)
|
2,061
|
(8.3)
|
1,295
|
(5.2)
|
883
|
(3.6)
|
722
|
(2.9)
|
750
|
(3.0)
|
|
Hispanic
|
33,106
|
(40.5)
|
15,151
|
(18.5)
|
11,482
|
(14.0)
|
7,723
|
(9.4)
|
5,260
|
(6.4)
|
3,843
|
(4.7)
|
2,975
|
(3.6)
|
2,243
|
(2.7)
|
|
Total
|
137,897
|
(35.3)
|
75,760
|
(19.4)
|
59,190
|
(15.1)
|
40,036
|
(10.2)
|
27,940
|
(7.1)
|
21,809
|
(5.6)
|
16,635
|
(4.3)
|
11,811
|
(3.0)
|
|
Type of procedure
|
Weeks of gestation
|
Total
|
|
≤8
|
9–13
|
14–15
|
16–17
|
18–20
|
≥ 21
|
|
No.
|
(%)†
|
No.
|
(%)
|
No.
|
(%)
|
No.
|
(%)
|
No.
|
(%)
|
No.
|
(%)
|
No.
|
(%)
|
|
Curettage§
|
|
≤13 weeks' gestation
|
243,451
|
(74.5)
|
134,848
|
(97.1)
|
NA
|
NA
|
NA
|
NA
|
NA
|
NA
|
NA
|
NA
|
378,299
|
(74.4)
|
|
>13 weeks' gestation
|
NA
|
NA
|
NA
|
NA
|
16,751
|
(98.3)
|
9,181
|
(96.4)
|
8,789
|
(94.7)
|
6,303
|
(91.4)
|
41,024
|
(8.1)
|
|
Medical¶
|
|
≤8 weeks' gestation
|
82,255
|
(25.2)
|
NA
|
NA
|
NA
|
NA
|
NA
|
NA
|
NA
|
NA
|
NA
|
NA
|
82,255
|
(16.2)
|
|
>8 weeks' gestation
|
NA
|
NA
|
3,615
|
(2.6)
|
142
|
(0.8)
|
137
|
(1.4)
|
265
|
(2.9)
|
476
|
(6.9)
|
4,635
|
(0.9)
|
|
Intrauterine instillation
|
—**
|
—
|
17
|
(0.0)
|
28
|
(0.2)
|
24
|
(0.3)
|
56
|
(0.6)
|
59
|
(0.9)
|
184
|
(0.0)
|
|
Other
|
1,036
|
(0.3)
|
392
|
(0.3)
|
114
|
(0.7)
|
178
|
(1.9)
|
173
|
(1.9)
|
60
|
(0.9)
|
1,953
|
(0.4)
|
|
Total
|
326,742
|
(100.0)
|
138,872
|
(100.0)
|
17,035
|
(100.0)
|
9,520
|
(100.0)
|
9,283
|
(100.0)
|
6,898
|
(100.0)
|
508,350
|
(100.0)
|
|
Year
|
Type of abortion
|
Total
|
Case-fatality rate per 100,000
|
|
Induced
|
Unknown**
|
|
Legal§
|
Illegal¶
|
|
1973–1978
|
|
|
|
|
1.78
|
|
1973
|
25
|
19
|
3
|
47
|
|
|
1974
|
26
|
6
|
1
|
33
|
|
|
1975
|
29
|
4
|
1
|
34
|
|
|
1976
|
11
|
2
|
1
|
14
|
|
|
1977
|
17
|
4
|
0
|
21
|
|
|
1978
|
9
|
7
|
0
|
16
|
|
|
1979–1983
|
|
|
|
|
0.78
|
|
1979
|
22
|
0
|
0
|
22
|
|
|
1980
|
9
|
1
|
2
|
12
|
|
|
1981
|
8
|
1
|
0
|
9
|
|
|
1982
|
11
|
1
|
0
|
12
|
|
|
1983
|
11
|
1
|
0
|
12
|
|
|
1984–1988
|
|
|
|
|
0.72
|
|
1984
|
12
|
0
|
0
|
12
|
|
|
1985
|
11
|
1
|
1
|
13
|
|
|
1986
|
11
|
0
|
2
|
13
|
|
|
1987
|
7
|
2
|
0
|
9
|
|
|
1988
|
16
|
0
|
0
|
16
|
|
|
1989–1993
|
|
|
|
|
0.62
|
|
1989
|
12
|
1
|
0
|
13
|
|
|
1990
|
9
|
0
|
0
|
9
|
|
|
1991
|
11
|
1
|
0
|
12
|
|
|
1992
|
10
|
0
|
0
|
10
|
|
|
1993
|
6
|
1
|
2
|
9
|
|
|
1994–1998
|
|
|
|
|
0.57
|
|
1994
|
10
|
2
|
0
|
12
|
|
|
1995
|
4
|
0
|
0
|
4
|
|
|
1996
|
9
|
0
|
0
|
9
|
|
|
1997
|
7
|
0
|
0
|
7
|
|
|
1998
|
9
|
0
|
0
|
9
|
|
|
1999–2003
|
|
|
|
|
0.64
|
|
1999
|
4
|
0
|
0
|
4
|
|
|
2000
|
11
|
0
|
0
|
11
|
|
|
2001
|
7
|
1
|
0
|
8
|
|
|
2002
|
10
|
0
|
0
|
10
|
|
|
2003
|
10
|
0
|
0
|
10
|
|
|
2004–2008
|
|
|
|
|
0.64
|
|
2004
|
7
|
1
|
0
|
8
|
|
|
2005
|
7
|
0
|
0
|
7
|
|
|
2006
|
7
|
0
|
0
|
7
|
|
|
2007
|
6
|
0
|
0
|
6
|
|
|
2008
|
12
|
0
|
0
|
12
|
|
|
Total
|
403
|
56
|
13
|
472
|
0.82
|
