Persons using assistive technology might not be able to fully access information in this file. For assistance, please send e-mail to: mmwrq@cdc.gov. Type 508 Accommodation and the title of the report in the subject line of e-mail.
Surveillance of Demographic Characteristics and Health Behaviors Among Adult Cancer Survivors — Behavioral Risk Factor Surveillance System, United States, 2009
Corresponding author: J. Michael Underwood, PhD, CDC, 4770 Buford Hwy NE, MS K-57, Atlanta, GA 30341. E-mail: jmunderwood@cdc.gov; Telephone: 770-488-3029; Fax: 770-488-4335.
Abstract
Problem/Condition: Approximately 12 million people are living with cancer in the United States. Limited information is available on national and state assessments of health behaviors among cancer survivors. Using data from the Behavioral Risk Factor Surveillance System (BRFSS), this report provides a descriptive state-level assessment of demographic characteristics and health behaviors among cancer survivors aged ≥18 years.
Reporting Period Covered: 2009
Description of System: BRFSS is an ongoing, state-based, random-digit–dialed telephone survey of the noninstitutionalized U.S. population aged ≥18 years. BRFSS collects information on health risk behaviors and use of preventive health services related to leading causes of death and morbidity. In 2009, BRFSS added questions about previous cancer diagnoses to the core module. The 2009 BRFSS also included an optional cancer survivorship module that assessed cancer treatment history and health insurance coverage for cancer survivors. In 2009, all 50 states, the District of Columbia, Guam, Puerto Rico, and the U.S. Virgin Islands administered the core cancer survivorship questions, and 10 states administered the optional supplemental cancer survivorship module. Five states added questions on mammography and Papanicolaou (Pap) test use, eight states included questions on colorectal screening, and five states included questions on prostate cancer screening.
Results: An estimated 7.2% of the U.S. general population aged ≥18 years reported having received a previous cancer diagnosis (excluding nonmelanoma skin cancer). A total of 78.8% of cancer survivors were aged ≥50 years, and 39.2% had received a diagnosis of cancer >10 years previously. A total of 57.8% reported receiving an influenza vaccination during the previous year, and 48.3% reported ever receiving a pneumococcal vaccination. At the time of the interview, 6.8% of cancer survivors had no health insurance, and 12% had been denied health insurance, life insurance, or both because of their cancer diagnosis. The prevalence of cardiovascular disease was higher among male cancer survivors (23.4%) than female cancer survivors (14.3%), as was the prevalence of diabetes (19.6% and 14.7%, respectively). Overall, approximately 15.1% of cancer survivors were current cigarette smokers, 27.5% were obese, and 31.5% had not engaged in any leisure-time physical activity during the past 30 days. Demographic characteristics and health behaviors among cancer survivors varied substantially by state.
Interpretation: Health behaviors and preventive health care practices among cancer survivors vary by state and demographic characteristics. A large proportion of cancer survivors have comorbid conditions, currently smoke, do not participate in any leisure-time physical activity, and are obese. In addition, many are not receiving recommended preventive care, including cancer screening and influenza and pneumococcal vaccinations.
Public Health Action: Health-care providers and patients should be aware of the importance of preventive care, smoking cessation, regular physical activity, and maintaining a healthy weight for cancer survivors. The findings in this report can help public health practitioners, researchers, and comprehensive cancer control programs evaluate the effectiveness of program activities for cancer survivors, assess the needs of cancer survivors at the state level, and allocate appropriate resources to address those needs.
Introduction
A cancer survivor is a person who has received a diagnosis of cancer, from the time of diagnosis throughout the person's life (1–3). The aging of the U.S. population has resulted in an increase in the number of cancer diagnoses (4), and because of improvements in early detection and treatment, the number of cancer survivors has steadily increased during the last 3 decades. As of 2007, nearly 12 million cancer survivors were living in the United States (5).
Cancer survivors often face long-term adverse physical, psychosocial, and financial effects from their cancer diagnosis and treatment (2,6–10); the impact of cancer on family members, friends, and caregivers of survivors is considered a part of cancer survivorship (1). Cancer survivors have a greater risk for new cancers compared with persons who have never had cancer (11,12). Various healthy lifestyle behaviors have been shown to prevent new malignancies and decrease the chances of recurrence among cancer survivors (2,13). Prevention and cessation of tobacco use (primarily cigarette smoking) (14), regular physical activity (15), maintenance of a healthy weight (16–18), and routine consultation with health-care providers about follow-up care after a cancer diagnosis (i.e., survivorship care plans) (19) have shown evidence of the ability to prevent new cancers or cancer recurrence, increase survival, and strengthen quality of life after a cancer diagnosis. Survivor-specific resources and support are necessary to promote positive health outcomes and improve quality of life.
Increased recognition of the potential benefits of healthy lifestyle behaviors among persons with cancer contributed to the development of responsive public health strategies such as the National Action Plan for Cancer Survivorship: Advancing Public Health Strategies (2), a publication cosponsored by Livestrong (formerly the Lance Armstrong Foundation) and CDC, and From Cancer Patient to Cancer Survivor: Lost in Transition (13), by the Institute of Medicine. In addition, CDC's National Comprehensive Cancer Control Program (NCCCP) funds states, the District of Columbia (DC), tribes and tribal organizations, selected U.S. territories, and associated Pacific Island jurisdictions to develop and implement local comprehensive cancer control plans (20), most of which include specific goals and objectives about survivorship (21). NCCCP programs use population-based data sources to assess the effectiveness of activities related to survivorship and to conduct state-specific analyses of cancer survivor health behaviors. Population-based information about survivors also is useful for public health practitioners, program implementers, and researchers who assess and develop interventions to improve the health and quality of life of cancer survivors.
The Behavioral Risk Factor Surveillance System (BRFSS) survey is a state-based surveillance system that monitors health behaviors, chronic diseases, injuries, access to health care, and preventive health care. Core module questions are asked of all survey respondents in each state and territory, and each state and territory may include select optional modules in their surveys. In 2009, BRFSS added questions about previous cancer diagnoses to the core survey module. The survey also included an optional cancer survivorship module that assessed cancer treatment history and health insurance coverage of cancer treatment for cancer survivors. Because BRFSS data are obtained through respondent interviews, the cancer survivors described in this report are all classified as cancer survivors on the basis of self-reporting; cancer diagnoses were not confirmed. Therefore, these data might differ from data reported by the CDC's National Program of Cancer Registries or the National Cancer Institute's Surveillance, Epidemiology, and End Results (SEER) program, which both confirm diagnoses (5).
This report provides a descriptive analysis of the 2009 BRFSS data among cancer survivors, including demographic characteristics and health behaviors, as well as cancer treatment history and health insurance coverage of treatment in states that included the optional module in the 2009 survey. Although the effects of cancer on those who know and care for cancer survivors are a component of cancer survivorship, the analyses in this report include only the persons who received the cancer diagnosis (1).
Methods
BRFSS is an ongoing, cross-sectional, random-digit–dial telephone survey of noninstitutionalized adults aged ≥18 years. Trained interviewers use the standard core and optional questionnaire modules to collect uniform data from all states, DC, and select U.S. territories. In 2009, BRFSS was conducted in all 50 states, DC, Guam, Puerto Rico, and the U.S. Virgin Islands. The optional module on cancer survivorship was administered by 10 states (California, Connecticut, Maryland, Massachusetts, Nebraska, New Jersey, North Carolina, Oklahoma, Vermont, and Virginia). Detailed BRFSS methods have been described in previous publications (22,23).
Questionnaire
The standard BRFSS questionnaire consists of three parts: 1) core questions, 2) optional supplemental modules that include sets of questions on specific topics, and 3) state-added questions. All jurisdictions ask the same core questions. Individual jurisdictions may opt to include optional modules and jurisdiction-added questions to address specific health-care concerns.
As part of the core module, respondents were asked whether they had ever been told by a doctor, nurse, or other health-care professional that they had cancer. Respondents who answered yes were asked how many different types of cancer they had, the age when they were told that they had cancer, and which type of cancer they had. If respondents reported having had more than one type of cancer, only the most recently diagnosed type was recorded. Respondents who were unsure about their history of cancer, who refused to answer the question, or who reported nonmelanoma skin cancer were excluded from the analysis.
Of 432,607 BRFSS respondents, 411,654 answered the question regarding previous cancer diagnoses. Among these respondents, 4,252 either refused to answer the question or were not sure that they had ever been diagnosed with cancer and were excluded from the analysis; in addition, 13,632 reported having had nonmelanoma skin cancer and were excluded from the analysis. Nonmelanoma skin cancers (i.e., basal and squamous cell skin cancers) are not routinely collected in cancer registries because they do not require treatment beyond surgery (5).
Years since diagnosis (0–5, 6–10, and >10 years) were calculated using the respondents' current age and age at first cancer diagnosis. Type of cancer was categorized as breast, female genital system (cancers of the cervix, uterus, and ovary), head or neck (cancers of the head, neck, mouth, and throat), gastrointestinal (cancers of the colon, esophagus, liver, pancreas, stomach, and rectum), leukemia or lymphoma (Hodgkin's lymphoma, non-Hodgkin's lymphoma, and leukemia), male genital system (cancers of the prostate and testis), skin (melanoma), lung, urinary tract (bladder and kidney), other cancer types (thyroid, bone, brain, heart, neuroblastoma, and other), and unknown or refused to answer.
Using data from the core module, the following characteristics were compared among cancer survivors: age at interview, sex, race/ethnicity (non-Hispanic white, non-Hispanic black, Hispanic, Asian/Pacific Islander [A/PI], American Indian/Alaska Native [AI/AN], other/multiracial [preferred race not asked], unknown or refused to answer), marital status (married or living together, divorced, never married, widowed, or separated), education level (did not graduate high school, high school graduate, some college, or college graduate), employment status (employment for wages, out of work or unable to work, retired, or other), insurance coverage (yes or no), and U.S. Census region of residence (Northeast, South, Midwest, West, or the U.S. territories). Quality of life was measured by self-reported health status (excellent, very good, good, fair, or poor), number of physically unhealthy days during the past 30 days, receipt of social support (always, usually, sometimes, rarely, or never), and life satisfaction (very satisfied, satisfied, dissatisfied, or very dissatisfied).
In addition, the following health risk behaviors were analyzed: current smoking (smoking cigarettes every day or some days and having smoked >100 cigarettes during lifetime), obesity (body mass index [BMI] ≥30 kg/m2), and no leisure-time physical activity during the past 30 days. The presence of the following chronic health conditions was assessed: cardiovascular disease (history of myocardial infarction, angina or coronary heart disease, or stroke), diabetes, current asthma ("Have you ever been told by a doctor, nurse, or other health professional that you had asthma?" "Do you still have asthma?"), and disability (activity limitations from physical, mental, and emotional problems). The following preventive health care measures also were examined: ever having received pneumococcal vaccine and receipt of injected influenza vaccine during the past 12 months. (Receipt of live, attenuated influenza vaccine [LAIV] was not analyzed because most cancer survivors in this analysis were not eligible to receive LAIV.)
Five states (Georgia, Hawaii, New Jersey, Tennessee, and Wyoming) added questions on mammography and Papanicolaou (Pap) test use among women. Mammography use within the past 2 years and Pap test use (excluding women who had received a hysterectomy) within the past 3 years were analyzed among female cancer survivors aged ≥40 years and aged ≥18 years, respectively. Eight states (Delaware, Hawaii, Maine, Massachusetts, Nebraska, New Jersey, Oklahoma, and Wyoming) included questions on colorectal screening, and five states (Delaware, Hawaii, Kentucky, Nebraska, and New Jersey) included questions on prostate cancer screening. Cancer survivors aged ≥50 years were considered up to date with screening for colorectal cancer if they had received a fecal occult blood test within the previous year, sigmoidoscopy within the past 5 years, or colonoscopy within the past 10 years.
Data from the 10 states that administered the cancer survivorship optional module (California, Connecticut, Maryland, Massachusetts, Nebraska, New Jersey, North Carolina, Oklahoma, Vermont, and Virginia) were examined for the following cancer-related health care experience variables: type of physician providing the majority of their care, receipt of treatment summary or follow-up instructions, insurance coverage of cancer treatment, and denial of health or life insurance coverage because of a cancer diagnosis. Variables related to cancer treatments also were examined, including current receipt of cancer treatment, whether respondent had ever participated in a clinical trial, current pain from cancer or treatment, and current control of cancer-related pain.
Data Collection and Processing
Trained interviewers administer the BRFSS questionnaire using a computer-assisted telephone interviewing system. Data are collected monthly by each state and territory using disproportionate stratified random sampling in all states and DC and simple random sampling in Guam, Puerto Rico, and the U.S. Virgin Islands (24). According to the guidelines of the Council of American Survey Research Organizations (CASRO), the median cooperation rate (defined as the percentage of persons who completed interviews among all eligible persons who were contacted) for the 2009 BRFSS was 75%; the CASRO response rate (defined as the percentage of persons who completed interviews among all eligible persons, including those who were not successfully contacted) was 52.5% (25).
Data Weighting and Statistical Analysis
Statistical software was used to account for the complex sampling design. Statistics are not presented if the sample size for the numerator was <50 or if the half-width of the confidence interval was >10; however, the values are included in overall total calculations. Each sample is weighted to the respondent's probability of selection and the age- and sex-specific population or the age-, sex-, and race/ethnicity-specific population by using the 2009 postcensus projections for each state. Using the public-use BRFSS data file, all estimates were weighted to represent noninstitutionalized adults aged ≥18 years living within their respective state, DC, or U.S. territory. Some of the 17 states that administered either the optional cancer survivorship module or the women's health, colorectal cancer screening, or prostate cancer screening modules used multiple questionnaires. For these states, the survey weights provided in the multiple questionnaire data files were used. A new weight variable was created so that records from states using multiple questionnaires could be analyzed along with records from states that either included these modules on their common BRFSS survey or did not use multiple questionnaires. This allowed states that used optional modules on multiple questionnaire versions to be included in the analysis, thereby increasing the sample size for these modules.
Results
Demographic Characteristics
Of 432,607 BRFSS respondents, 411,654 answered the question regarding whether they had ever been told by a doctor, nurse, or other health-care professional that they had cancer. Among these respondents, 45,541 reported ever having cancer (7.2% of all respondents in all 50 states, DC, and the U.S. territories), not including nonmelanoma skin cancer (Table 1). A greater proportion of women (8.4%) than men (6.0%) reported ever receiving a diagnosis of cancer. A greater proportion of cancer survivors reported having received the diagnosis >10 years before the survey (39.2%) than in the past 5 years (36.2%) or 6–10 years before the survey (20.8%). Men were more likely to have received the diagnosis within the last 5 years (42.1%) compared with other time periods, whereas women were more likely to have received the diagnosis >10 years before the survey (44.0%). Most cancer survivors were non-Hispanic white (81.2%) and aged ≥50 years (78.8%). More male cancer survivors (74.9%) than female cancer survivors (57.0%) were married or living with a significant other. Approximately 10% of all cancer survivors had not graduated from high school. A total of 42.4% of cancer survivors were retired, and 93% had insurance coverage at the time of the survey.
Among male cancer survivors, the prevalences of cardiovascular disease (23.4%) and diabetes (19.6%) were higher than the prevalence of cardiovascular disease (14.3%) and diabetes (14.7%) among female cancer survivors. Current asthma was more prevalent among female cancer survivors (13.3%) than male cancer survivors (7.5%).
Preventive Care
Among cancer survivors in the eight states (Delaware, Hawaii, Maine, Massachusetts, Nebraska, New Jersey, Oklahoma, and Wyoming) that included colorectal cancer screening questions on the survey, 77.9% (1,138) of men and 73.1% (1,912) of women reported having been screened for colorectal cancer within the recommended period. Among the five states (Georgia, Hawaii, New Jersey, Tennessee, and Wyoming) that included questions on mammography and Pap test use among women on the survey, 79.4% (823) of women reported having been screened for cervical cancer, and 80.4% (1,517) reported having been screened for breast cancer within the recommended period. Approximately 57.8% of cancer survivors reported receiving an injected influenza vaccination during the previous year, and 48.3% reported ever receiving a pneumococcal vaccination.
Types of Cancer
Cancers of the breast (19.5%) were the most common cancers among all survivors, followed by female (14.8%) and male (14.6%) genital cancers (Table 2). Among women, the most common primary cancer types were breast (32.4%); cervix, uterus, ovary (24.8%); and melanoma (9.6%). The most common primary cancer types among men were prostate and testis (36.1%), melanoma, (16.2%), and gastrointestinal (10.5%). Breast cancer was the most commonly reported cancer in all racial/ethnic populations (19.3%, non-Hispanic white; 23.9%, non-Hispanic black; 25.8%, A/PI; 16.1%, AI/AN; and 17.3% Hispanic) (Table 3). Of the male genital cancers, prostate cancer (33.3%) was the most commonly reported cancer among all male racial/ethnic populations. Percentages of prostate cancer were highest among non-Hispanic black men (53.6%), followed by Hispanic (34.1%) and non-Hispanic white men (31.3%). Cervical cancer (14.5%) was the most commonly reported genital cancer among women. Percentages were highest among AI/AN women (28.9%), followed by Hispanic (20.4%), non-Hispanic black (14.7%), and non-Hispanic white women (13.8%).
Regional Differences
Cancer prevalences were similar in the Northeast (7.8%), Midwest (7.6%), and South (7.5%) U.S. Census regions; the prevalence was slightly lower in the West (6.2%) (Table 4). Whereas cancer prevalence was higher among women than men overall in the United States, states with the highest ratio of female-male cancer prevalence were Indiana (1.70), Oklahoma (1.66), Maine (1.57), and Montana (1.52). Breast cancer was most prevalent among women in the Northeast (36.4%). Cervical cancer (17.1%) and melanoma (13.2%) were most prevalent in the South. Prostate (34.8%) and female genital cancers (excluding cervical cancer) were highest in the West (11.3%).
Quality of Life
When asked to describe overall health status, 68.5% of cancer survivors indicated that their overall health was excellent, very good, or good (Table 5). Approximately one third (31.8%) of cancer survivors reported experiencing ≥5 physically unhealthy days during the past 30 days, with wide variations by state. The highest percentage of survivors reporting ≥5 unhealthy days was reported among survivors living in Kentucky (44.1%), and the lowest was among those living in Iowa (24.7%). Half (50.2%) of cancer survivors living in the United States reported always receiving needed social or emotional support, and 92.7% of all cancer survivors reported being very satisfied or satisfied with their life.
Health Behaviors
Smoking
Approximately 15.1% of cancer survivors aged ≥18 years in the 50 states and DC were current cigarette smokers (Figure 1). Smoking prevalence among cancer survivors was highest in Oklahoma (23.9%) and lowest in California (10.3%). Regional differences also were observed, with the highest prevalence in the South (17.2%), followed by the Midwest (15.8%), Northeast (15.1%), and West (13.0%).
Obesity
A total of 27.5% of cancer survivors were obese (BMI ≥30 kg/m2) (Figure 2); however, the prevalence varied widely by state, ranging from 15.7% in Colorado to 33.8% in Missouri. Similarly, obesity prevalence among cancer survivors varied by geographic region. Obesity was most prevalent among cancer survivors in the Midwest (29.8%), followed by the South (28.4%), Northeast (26.0%), and West (24.5%).
Leisure-Time Physical Activity
Approximately 31.5% of cancer survivors had not participated in any leisure-time physical activity during the past 30 days (Figure 3). The highest proportion of cancer survivors reporting no leisure-time physical activity lived in the South (34.3%), followed by the Midwest (32.5%), Northeast (31.3%), and West (25.5%). Among states, percentages of inactivity were highest in West Virginia (42.3%) and lowest in Oregon (21.4%).
Treatment Regimens and Pain
Among the 6,384 respondents in the 10 states that included the optional module, 12% of cancer survivors reported that they were currently receiving treatment, with estimates ranging from 9.1% to 14.0% among states (Table 6). A total of 7.5% of cancer survivors reported ever having participated in a clinical trial. Whereas 10.1% of survivors reported current pain that they attributed to cancer or cancer treatment, approximately 80.9% of these survivors reported that the pain was currently well controlled.
Health-Care Experience
Among the 5,593 respondents not currently undergoing treatment from the 10 states that included the optional module, 21.2% of cancer survivors reported that the type of physician who provided the majority of their health care was either an oncologist or another cancer specialist, ranging from 14.3% in North Carolina to 29.3% in California (Table 7). Approximately 40.2% of cancer survivors reported receipt of a written summary of their cancer treatments, and 73.9% reported receipt of instructions on follow-up care. Approximately 90.7% of respondents reported that insurance covered all or part of their cancer treatment. Overall, 12.0% of respondents said they had been denied health or life insurance coverage because of their cancer diagnosis.
Discussion
Cancer is among the most prevalent diseases diagnosed and the second leading cause of death in the United States (26). This report presents the first population-based survey with state-level assessment of health behaviors and demographic characteristics among cancer survivors. Although previous studies also have examined state-level preventive health practices among cancer survivors (e.g., cancer screenings and influenza and pneumococcal vaccinations) (27,28), this is the only report with data from all 50 states, DC, and U.S. territories.
Research has indicated that cancer survivors might benefit from higher levels of recommended screenings and increased vaccine coverage because of their increased susceptibility to future illness (2,10). All cancer survivors in this report were recommended to have received the flu vaccine (which is recommended for all persons aged >6 months), and most were candidates for the pneumococcal vaccination (which is recommended for adults aged > 65 years and for persons with certain chronic medical conditions which put them at risk for pneumococcal infection); however, a substantial proportion of cancer survivors did not receive these vaccines. A previous study of the Medicare population indicated that breast cancer survivors are less likely to receive preventive care (e.g., influenza vaccination, cholesterol screening, colorectal cancer screening, bone densitometry, and mammography) than age-, ethnicity- and sex-matched controls (29). Other studies also have shown that cancer survivors are less likely to receive recommended preventive care for a broad range of chronic medical conditions, and cancer screening rates decrease significantly as oncologists are less involved in patient treatment (30,31).
Demographic Characteristics and Use of Preventive Care
Approximately 7% of all 2009 BRFSS respondents reported ever receiving a diagnosis of cancer from a health-care professional. This prevalence is slightly lower than the estimated 10% found in a recent BRFSS study (32), likely because nonmelanoma skin cancers were included in that study. Cases of nonmelanoma skin cancer account for nearly one fifth of all reported cancer cases. Approximately 3.5 million basal and squamous skin cancers occurred in 2006 (33).
This report confirms findings from previous studies: the majority of cancer survivors are older (5), female (5,34), non-Hispanic white (35–37), and married (36). Cancer is strongly associated with aging (38), and researchers expect the cancer survivor population to continue increasing as the U.S. population ages (39).
There are more female than male cancer survivors, possibly because certain cancers among women (e.g., breast and cervical cancer) can be detected earlier through effective screening methods and treated more successfully than many other cancers, leading to longer survival (40). Minority populations have higher cancer incidence rates than whites for some but not all cancers (41). The potential lack of BRFSS respondent representativeness compared with the total U.S. population, in addition to a lower death rate among white cancer survivors compared with all other racial groups, might contribute to the higher proportion of cancer survivors among non-Hispanic whites observed in this study (41). Approximately 64% of cancer survivors were married, and nearly 27% were divorced or widowed, consistent with a previous study of cancer survivors (36). In contrast, 90% of cancer survivors in this report graduated from high school, whereas approximately 80% of cancer survivors in previous studies reported graduating (35–37). This difference might be associated with a previous finding that households with landline telephones (which are required for BRFSS participation) are associated with higher educational attainment (42).
Breast cancer is the most common invasive cancer among U.S. women (43), and incidence rates are high across all racial/ethnic groups. Black women tend to have more deaths from breast cancer (43), and the results in this report showed a higher prevalence of breast cancer among non-Hispanic black women than among non-Hispanic white women. Through the combination of widespread mammography screening programs and improvements in therapeutic treatment agents, the proportion of long-term breast cancer survivors has increased considerably over the last several decades (5,44). For prostate cancer, a significantly higher proportion of non-Hispanic black men were prostate cancer survivors than were men of other races/ethnicities, consistent with incidence data showing prostate cancer is more common among black men (43). Although black men also tend to have higher death rates than other racial populations from prostate cancer, the high proportion of indolent disease contributes to the relatively high (99%) overall 5-year relative survival (45).
Types of Cancer
The patterns of cancer by type among cancer survivors in this report differ from estimates that are based on cancer registry data. In one such report, prostate, colorectal, and female breast cancer survivors accounted for the majority of survivors (5). In this analysis, although prostate and female breast cancers also account for the majority of cancer types among male and female cancer survivors, respectively, melanoma survivors are the third largest group. A plausible explanation for these differences is that national estimates of survivors, which are based on SEER data (45), do not include in situ melanoma cases. In contrast, BRFSS respondents may report all types of cancer, regardless of whether the cancer was invasive. In addition, common noncancer diagnoses such as cervical dysplasia and uterine fibroids might be misreported as cancer by BRFSS respondents (46). Variations in cancer prevalence by cancer type also might reflect differences in incidence, risk, availability of screening tests and effective treatment for each cancer, and whether the cancer is likely to be curable.
Health Behaviors
Despite significant decreases in cigarette smoking since 1980, a 2011 CDC study indicated that 20% of U.S. adults aged ≥18 years in the general population currently smoke (47), compared with 15% of cancer survivors in this report. Cigarette smoking continues to be the leading preventable cause of morbidity and mortality, resulting in approximately 443,000 deaths annually (47). Cancer survivors are at increased risk for subsequent cancers, including tobacco-related cancers (48,49). Adverse health conditions from smoking include compromised cancer treatment efforts, delayed healing after surgery, and impeded recovery of optimal daily functioning (48). In this report, current smoking was reported by cancer survivors and varied substantially by state; however, certain states, such as California and Massachusetts, had a relatively low prevalence.
The low smoking prevalence among cancer survivors in California and Massachusetts is partially attributable to implementation of the long-running comprehensive tobacco control program in California and mandated tobacco cessation coverage in the Massachusetts Medicaid program (47,50,51). Because of the hazardous effects of smoking, especially among persons with cancer, promotion of smoking cessation and initiation of smoking prevention measures among cancer survivors are especially important. Studies have shown that health-care providers might miss opportunities to counsel cancer survivors about healthy behaviors, including smoking cessation (30,52). Health-care professionals should promote smoking cessation resources and treatments to persons who continue to smoke after receiving a cancer diagnosis. CDC recently recommended use of the U.S. Public Health Service Guidelines for Treating Tobacco Use and Dependence to decrease tobacco use among current smokers (53). CDC recommends a comprehensive approach to tobacco control, which includes evidence-based tobacco prevention and cessation strategies (e.g., targeted media campaigns, smoking cessation counseling interventions, quit lines, and medications) that are proven to be effective (53).
The obesity prevalence among cancer survivors in this report is similar to the obesity prevalence in the general U.S. population (54). Although the association between obesity and numerous chronic diseases has been well established, increasing numbers of studies are linking obesity to cancer. Obese cancer survivors have an increased risk for recurrence or death from colon, breast, prostate, esophageal, uterine, ovarian, kidney, and pancreatic cancers (55–58). In addition, studies have shown that obese cancer survivors with leukemia, non-Hodgkin's lymphoma, and multiple myeloma are more likely to experience new cancers than those who are not obese (59).
Research also associates physical activity with a reduced risk for recurrence and death from certain cancers, and the evidence is increasing. The results in this report indicate that approximately one of three cancer survivors in the United States did not participate in any leisure-time physical activity during the past 30 days. Several studies reported a 30%–60% reduction in risk for breast cancer recurrence, cancer-specific death, or overall mortality with moderate physical activity, equivalent to average-paced walking 2–3 hours a week (60–63). Studies also have found a 50%–60% reduction in risk for colorectal cancer recurrence, cancer-specific death, or overall mortality from regular physical activity after receiving a cancer diagnosis; however, these protective effects only occurred with the highest physical activity intensity and longest duration (64,65).
Many of the studies investigating the effect of physical activity on cancer recurrence and mortality are observational; additional data are needed to evaluate the association. However, evidence describing the positive effects of physical activity on other cancer outcomes such as overall functioning, aerobic and strength capacity, psychological well-being, and quality of life, is more consistent (66,67). On the basis of this evidence, the American College of Sports Medicine released physical activity guidelines for cancer survivors, which are consistent with the U.S. Department of Health and Human Services 2008 Physical Activity Guidelines for Americans. These guidelines support the safety and efficacy of physical activity for cancer survivors (68). The findings in this report indicate that many U.S. cancer survivors do not follow current physical activity recommendations, possibly increasing the risk for poor outcomes. In addition, rates of inactivity are higher among cancer survivors than in the general population. In 2009, 24.2% of the general population reported no leisure-time activity (69), compared with 31.3% of cancer survivors in this report. Because cancer survivors are at a higher risk for inactivity than the general population, additional effort is needed to increase physical activity among cancer survivors (68).
Although the reported variation in health-related behaviors and use of clinical preventive services across the states might be a result of differences in demographic characteristics and the availability of state-level services for cancer survivors, they also might reflect previously reported regional and state-level differences in the general population (70).
Treatment Regimens and Pain
Several barriers prevent cancer survivors from receiving appropriate follow-up care after completing cancer treatment, including lack of coordination among health-care providers, lack of standardized follow-up medical care, and lack of knowledge among cancer survivors about appropriate follow-up (13). In 2005, the Institute of Medicine recommended that cancer patients be provided with a comprehensive summary of their cancer treatments and recommendations for follow-up care (13). Despite this recommendation, 40% of cancer survivors reported receiving a written summary of all their cancer treatments, and 74% of cancer survivors received instructions (written or oral) for follow-up care. The lack of cancer treatment summaries and follow-up care recommendations for many cancer survivors might contribute to the finding that cancer survivors have many unmet cancer-related health information needs (71–73). The prevalence of cancer survivors who reported receiving the majority of their health care from a cancer specialist varied substantially by state, a finding that might reflect a lack of consensus on the roles of cancer specialists and primary care physicians in the medical care of cancer survivors (74–76).
Most cancer survivors received their cancer diagnosis many years before the BRFSS interview. A total of 12% were undergoing treatment at the time of the survey. However, the question regarding current treatment was specific ("Are you currently receiving treatment for cancer? By treatment, we mean surgery, radiation therapy, chemotherapy, or chemotherapy pills"). Certain respondents might have been receiving medications that were indeed part of a cancer treatment regimen, but if they did not consider the medication to be a type of chemotherapy, they might have answered no to the question, resulting in an underestimation of cancer survivors currently receiving therapy. For example, many women take oral antiestrogen therapy for estrogen-receptor–positive breast cancer (77). Furthermore, patients undergoing cancer therapy might have been less likely to participate in BRFSS, also leading to an underestimation of the proportion of survivors in current treatment.
Approximately 8% of survivors reported having participated in a clinical trial as part of their cancer treatment, more than the 4.7% of survivors from the 1992 National Health Interview Survey (NHIS) (78). However, caution should be used when comparing these estimates because they are from different surveys, and the NHIS analysis only included survivors who had received the cancer diagnosis within the past 10 years. Previous studies also have shown that cancer clinical trial participation rates are low (79). However, these findings raise questions about whether clinical trials during the past 20 years are more available and accepted by more persons with cancer.
The prevalence of current pain among survivors in this report (10.1%) was somewhat lower than that the prevalence reported in a statement by a National Institutes of Health State-of-the-Science panel; however, findings from that report suggested a wide range, with estimates ranging from 14%–100% (80). Although most survivors in this sample reported that their pain was under control, 20% reported that it was not. Others have concluded that pain control among cancer patients is inadequate (81,82). Potential barriers to effective pain management exist at the patient, health-care provider, and system levels (80). Suboptimal pain control might be an indicator of poor quality care (80), and multiple quality measures related to controlling cancer pain have been recommended (83).
Health Care and Economic Factors
Twelve percent of cancer survivors in this study reported being denied health or life insurance coverage because of a cancer diagnosis, and 7% were uninsured, a finding that is consistent with a previous population health survey on health insurance among cancer survivors (37). Health insurance coverage among cancer survivors is of particular importance. Previous research has shown that a lack of adequate insurance coverage might lead to more delayed or unmet medical care needs for cancer survivors than for adults without cancer (84). Health insurance coverage is especially important for cancer survivors because of the potential costs associated with cancer and for the multiple comorbid conditions described in this and another report (36). Because of financial hardships, such as lack of adequate insurance coverage, cancer survivors might be unable to afford copayments, prescription medications, and other necessary medical care (85). The Affordable Care Act, which was enacted in 2010, might provide a solution for cancer survivors by increasing health insurance coverage and ensuring that persons will not be denied coverage because of a previous cancer diagnosis (86).
Researchers projected that in 2010 and 2020, the United States would have an estimated 13.8 and 18.1 million cancer survivors, with associated costs of cancer care of $124.6 and $157.8 billion, respectively (87). These projections underscore the substantial economic effects measured by direct medical care costs, lost productivity, and intangible costs (such as lesser quality of life) that cancer survivors might face. Direct medical care costs include hospitalization, outpatient care, physician services, prescription and nonprescription drugs, nursing home and long-term care, and other medical supplies (88–92). Cancer survivors also incur substantial nonmedical care costs, such as transportation to and from health-care providers, losses in patients' time (e.g., from spending time receiving treatments), and other health-care services (6). Lost productivity is usually measured as a morbidity cost resulting from foregone earnings among employed persons or a mortality cost from premature death.
Many cancer survivors are unable to resume their usual activities, including work (7–9,93). In addition to lost productivity among cancer survivors, productivity is lost among the caregivers of survivors (92,94,95). Caregivers include spouses, relatives, friends, or others providing health services and other activities of daily living services to a cancer survivor; the economic effects associated with caregiver services are substantial (96,97). Intangible costs, which are typically measured by quality of life (90,91,98), are measures of cancer-related pain and suffering that affect the health and well-being of a patient. Intangible costs also include psychosocial interventions to alleviate anxiety and depression among cancer survivors (99). Although estimating the economic effects of cancer on cancer survivors is important for assessing and planning for the future, the available population-based surveys (including BRFSS) do not directly address this variable. As a result, CDC, the National Cancer Institute, the Agency for Healthcare Quality and Research, and the American Cancer Society are collaborating to enhance the Medical Expenditure Panel Survey to collect more detailed data to estimate the economic effects on cancer survivors, the families of cancer survivors, and society.
Limitations
The findings in this report are subject to several limitations. First, BRFSS data are self-reported and subject to recall bias, which could lead to inaccurate estimates of cancer prevalence (100). Recall bias might be responsible for the slightly higher cancer prevalence observed for certain cancers when compared with a recent study using cancer registry data (5). In addition, overreporting of cervical cancer is especially likely because abnormal Pap tests, cervical cancer precursors, and cervical intraepithelial neoplasia might be misperceived as diagnoses of cancer because of treatments used to remove the precancerous lesions (78). Second, BRFSS might not be representative of persons who do not have a landline telephone, which is required for BRFSS participation (42). Because of the growing number households that only have cellular telephones, BRFSS is conducting pilot studies to include participation among these previously excluded households (101). Third, because the findings are limited to noninstitutionalized U.S. citizens, cancer survivors who might have had an advanced-stage cancer and are therefore living in nursing homes, long-term–care facilities, or hospice or who are in the military are not included. Fourth, the estimates in this report are not age adjusted, which might contribute to state variations in cancer survivor prevalence. Fifth, because BRFSS does not assess any indicators of smoking dependence or intensity, no conclusions can be made regarding the magnitude of tobacco use among cancer survivors. Sixth, because of survival bias, respondents might have survived cancer for several reasons: their cancer was an in situ or early-stage cancer, was well differentiated, or was more responsive to treatment, or the survivors had better access to treatment or engaged in more positive health behaviors. Therefore, the results might not be representative of the overall cancer experience in the United States. Finally, the low cooperation rate of the BRFSS survey might limit the generalizability of the results to all cancer survivors living in the United States. However, studies have concluded that the survey findings are reliable and valid (102).
Conclusion
A large proportion of cancer survivors have comorbid conditions, and many are not receiving recommended preventive care, not only for cancer screening but for influenza and pneumococcal vaccinations. Furthermore, many cancer survivors currently smoke, do not participate in adequate physical activity, and are obese. Health-care providers and patients should be aware of the importance of preventive care, smoking cessation, regular physical activity, and maintaining a healthy weight among cancer survivors, factors that have been linked to longer survival and better quality of life among cancer survivors, as well as to decreased risk for new and recurrent cancer. Health care for cancer survivors should include improvements in pain management and a written treatment summary (including follow-up instructions). Modification of health behaviors among cancer survivors would be facilitated by increasing insurance coverage and access to care.
The data in this report reflect variations in health behaviors and preventive health care practices that might be a result of availability of state-level resources for cancer survivors. These findings can be used by public health practitioners, researchers, and state comprehensive cancer control planners to assess the need for state resources for cancer survivors and evaluate the effectiveness of current programmatic efforts; therefore, surveillance data among cancer survivors should be regularly collected at the local and national levels. Additional research on cancer survivors, including health behaviors and patient access to quality care, should be conducted to address the needs of the increasing cancer survivor population in the United States.
References
- CDC. Basic information about cancer survivorship. Atlanta, GA: CDC; 2011. Available at http://www.cdc.gov/cancer/survivorship/basic_info. Accessed May 26, 2011.
- CDC. A national action plan for cancer survivorship: advancing public health strategies. Atlanta GA: CDC; 2004. Available at http://www.cdc.gov/cancer/survivorship/pdf/plan.pdf. Accessed November 3, 2011.
- National Cancer Institute. National Cancer Institute Office of Cancer Survivorship fact sheet. Bethesda, MD: National Cancer Institute; 2011. Available at http://cancercontrol.cancer.gov/ocs/ocs_factsheet.pdf. Accessed July 28, 2011.
- Edwards BK, Howe HL, Ries LA, et al. Annual report to the nation on the status of cancer, 1973–1999, featuring implications of age and aging on U.S. cancer burden. Cancer 2002;94:2766–92.
- CDC. Cancer survivors—United States, 2007. MMWR 2011;60:269–72.
- Yabroff KR, Davis WW, Lamont EB, et al. Patient time costs associated with cancer care. J Natl Cancer Inst 2007;99:14–23.
- Yabroff KR, Lawrence WF, Clauser S, Davis WW, Brown ML. Burden of illness in cancer survivors: findings from a population-based national sample. J Natl Cancer Inst 2004;96:1322–30.
- Sasser AC, Rousculp MD, Birnbaum HG, Oster EF, Lufkin E, Mallet D. Economic burden of osteoporosis, breast cancer, and cardiovascular disease among postmenopausal women in an employed population. Womens Health Issues 2005;15:97–108.
- Bradley CJ, Bednarek HL, Neumark D. Breast cancer and women's labor supply. Health Serv Res 37:1309–28.
- The Lancet. Cancer survivors: living longer, and now, better [editorial]. Lancet 2004;364:2153–4.
- Sunga AY, Eberl MM, Oeffinger KC, Hudson MM, Mahoney MC. Care of cancer survivors. Am Fam Physician 2005;71:699–706.
- Ng AK, Travis LB. Subsequent malignant neoplasms in cancer survivors. Cancer J 2008;14:429–34.
- Hewitt M, Greenfield S, Stovall E. From cancer patient to cancer survivor: lost in transition. Washington, DC: National Academies Press; 2006.
- Johnston-Early A, Cohen MH, Minna JD, et al. Smoking abstinence and small cell lung cancer survival. An association. JAMA 1980;244:2175–9.
- Doyle C, Kushi LH, Byers T, et al. Nutrition and physical activity during and after cancer treatment: an American Cancer Society guide for informed choices. CA Cancer J Clin 2006;56:323–53.
- Whiteman MK, Hillis SD, Curtis KM, McDonald JA, Wingo PA, Marchbanks PA. Body mass and mortality after breast cancer diagnosis. Cancer Epidemiol Biomarkers Prev 2005;14:2009–14.
- Bassett WW, Cooperberg MR, Sadetsky N, et al. Impact of obesity on prostate cancer recurrence after radical prostatectomy: data from CaPSURE. Urology 2005;66:1060–5.
- Haydon AM, Macinnis RJ, English DR, Giles GG. Effect of physical activity and body size on survival after diagnosis with colorectal cancer. Gut 2006;55:62–7.
- Earle CC. Failing to plan is planning to fail: improving the quality of care with survivorship care plans. J Clin Oncol 2006;24:5112–6.
- CDC. National Comprehensive Cancer Control Program. Atlanta, GA: CDC; 2011. Available at http://www. cdc.gov/cancer/ncccp/about.htm. Accessed May 26, 2011.
- Pollack LA, Greer GE, Rowland JH, et al. Cancer survivorship: a new challenge in comprehensive cancer control. Cancer Causes Control 2005;16(Suppl 1):51–9.
- Gentry EM, Kalsbeek WD, Hogelin GC, et al. The behavioral risk factor surveys: II. Design, methods, and estimates from combined state data. Am J Prev Med 1985;1:9–14.
- CDC. Public health surveillance for behavioral risk factors in a changing environment: recommendations from the Behavioral Risk Factor Surveillance team. MMWR 2003;52(No. RR-9).
- CDC. Behavioral Risk Factor Surveillance System: survey data information. Atlanta, GA: CDC; 2010. Available at http://www.cdc.gov/brfss/technical_infodata/surveydata/2009.htm. Accessed August 18, 2011.
- CDC. Behavioral Risk Factor Surveillance System: 2009 summary data quality report [Internet]. Atlanta, GA: CDC; 2010. Available at ftp://ftp.cdc.gov/pub/Data/Brfss/2009_Summary_Data_Quality_Report.pdf. Accessed July 19, 2010.
- Kochanek KD, Xu J, Murphy SL, Miniño AM, Kung HC. Deaths: preliminary data for 2009. Natl Vital Stat Rep 2011;56(4).
- Richardson LC, Townsend JS, Fairley TL, et al. Use of 2001–2002 Behavioral Risk Factor Surveillance System data to characterize cancer survivors in North Carolina. NC Med J 2011;72:20–7.
- Fairley TL, Hawk H, Pierre S. Health behaviors and quality of life of cancer survivors in Massachusetts, 2006: data use for comprehensive cancer control. Prev Chronic Dis 2010;7(9) [Epub].
- Snyder CF, Frick KD, Kantsiper ME, et al. Prevention, screening, and surveillance care for breast cancer survivors compared with controls: changes from 1998 to 2002. J Clin Oncol 2009;27:1054.
- Earle CC, Neville BA. Under use of necessary care among cancer survivors. Cancer 2004;101:1712–19.
- Snyder CF, Earle CC, Herbert RJ, Neville BA, Blackford AL, Frick KD. Preventive care for colorectal cancer survivors: a 5-year longitudinal study. J Clinical Oncol 2008;26:1073.
- CDC. Surveillance of certain health behaviors and conditions among states and selected local areas—Behavioral Risk Factor Surveillance System, United States, 2009. MMWR 2011;60(No. SS-9).
- Rogers HW, Weinstock MA, Harris AR, et al. Incidence estimate of nonmelanoma skin cancer in the United States, 2006. Arch Dermatol 2010;146:283–7.
- Altekruse SF, Kosary CL, Krapcho M, et al, eds. SEER cancer statistics review, 1975–2007. Bethesda, MD: National Cancer Institute; 2010. Available at http://seer.cancer.gov/csr/1975_2007. Accessed June 8, 2011.
- Coups EJ, Ostroff JS. A population-based estimate of the prevalence of behavioral risk factors among adult cancer survivors and noncancer controls. Prev Med 2005;40:702–11.
- Hewitt M, Rowland JH, Yancik R. Cancer survivors in the United States: age, health, and disability. J Gerontol A Biol Sci Med Sci 2003;58:82–91.
- Bellizzi KM, Rowland JH, Jeffery DD, McNeel T. Health behaviors of cancer survivors: examining opportunities for cancer control intervention. J Clin Oncol 2005;23:8884–93.
- World Health Organization. Cancer fact sheet. Geneva, Switzerland: World Health Organization. Available at http://www.who.int/mediacentre/factsheets/fs297/en/index.html. Accessed June 12, 2011.
- Pollack LA, Rowland JH, Crammer C, Stefanek M. Introduction: charting the landscape of cancer survivors' health-related outcomes and care. Cancer 2009;115(Suppl 18):4265–9.
- Garland SM, Smith JS. Human papillomavirus vaccines: current status and future prospects. Drugs 2010;70:1079–98.
- Jemal A, Siegel R, Xu J, Ward E. Cancer statistics, 2010. CA Cancer J Clin 2010;60:277–300.
- Blumberg SJ, Luke JV. Wireless substitution: early release of estimates from the National Health Interview Survey, July–December 2007. Hyattsville, MD: CDC, National Center for Health Statistics; 2009. Available at http://www.cdc.gov/nchs/nhis.htm. Accessed December 2, 2011.
- CDC. United States cancer statistics: 1999–2007 incidence and mortality web-based report. Atlanta, GA: CDC, National Cancer Institute; 2010. Available at www.cdc.gov/uscs. Accessed November 3, 2011.
- Soerjomataram I, Louwman MW, Ribot JG, Roukema JA, Coebergh JW. An overview of prognostic factors for long-term survivors of breast cancer. Breast Cancer Res Treat 2008;107:309–30.
- Howlader N, Noone AM, Krapcho M, et al, eds. SEER cancer statistics review, 1975–2008. Bethesda, MD: National Cancer Institute; 2011. Available at http://seer.cancer.gov/csr/1975_2008. Accessed November 3, 2011.
- Breitkopf CR, Pearson HC, Breitkopf DM. Poor knowledge regarding the Pap test among low-income women undergoing routine screening. Perspect Sex Reprod Health 2005;37:78–84.
- CDC. Vital signs: current cigarette smoking among adults aged ≥18 years—United States, 2005–2010. 2011;60:1207–12.
- Klosky JL, Tyc VL, Garces-Webb DM, Buscemi J, Klesges RC, Hudson MM. Emerging issues in smoking among adolescent and adult cancer survivors: a comprehensive review. Cancer 2007;110:2408–19.
- Mariotto AB, Rowland JH, Ries LA, Scoppa S, Feuer EJ. Multiple cancer prevalence: a growing challenge in long-term survivorship. Cancer Epidemiol Biomarkers Prev 2007;16:566–71.
- CDC. Best practices for comprehensive tobacco control programs—2007. Atlanta, GA: CDC; 2007. Available at http://www.cdc.gov/tobacco/stateandcommunity/best_practices/index.htm. Accessed November 3, 2011.
- Land T, Warner D, Paskowsky M, et al. Medicaid coverage for tobacco dependence treatments in Massachusetts and associated decreases in smoking prevalence. PLoS One 2010;5:e9770.
- Sabatino SA, Coates RJ, Uhler RJ, Pollack LA, Alley LG, Zauderer LJ. Provider counseling about health behaviors among cancer survivors in the United States. J Clin Oncol 2007;25:2100–6.
- Underwood JM, Townsend JS, Tai E, et al. Racial and regional disparities in lung cancer incidence. Cancer 2011 Sep 14. doi: 10.1002/cncr.26479 [Epub ahead of print].
- CDC. Vital signs: state-specific obesity prevalence among adults—United States, 2009. MMWR 2010;59:1–5.
- Irwin ML, McTiernan A, Baumgartner RN, et al. Changes in body fat and weight after a breast cancer diagnosis: influence of demographic, prognostic, and lifestyle factors. J Clin Oncol 2005;23:774–82.
- Calle EE, Rodriguez C, Walker-Thurmond K, Thun MJ. Overweight, obesity, and mortality from cancer in a prospectively studied cohort of U.S. adults. N Engl J Med 2003;348:1625–38.
- Flegal KM, Graubard BI, Williamson DF, Gail MH. Cause-specific excess deaths associated with underweight, overweight, and obesity. JAMA 2007;298:2028–37.
- Adami HO, Trichopoulos D. Obesity and mortality from cancer. N Engl J Med 2003;348:1623–4.
- Reeves GK, Pirie K, Beral V, Green J, Spencer E, Bull D. Cancer incidence and mortality in relation to body mass index in the Million Women Study: cohort study. BMJ 2007;335:1134.
- Holmes MD, Chen WY, Feskanich D, Kroenke CH, Colditz GA. Physical activity and survival after breast cancer diagnosis. JAMA 2005;293:2479–86.
- Friedenreich CM, Gregory J, Kopciuk KA, Mackey JR, Courneya KS. Prospective cohort study of lifetime physical activity and breast cancer survival. Int J Cancer 2009;124:1954–62.
- Irwin ML, Smith AW, McTiernan A, et al. Influence of pre- and postdiagnosis physical activity on mortality in breast cancer survivors: the health, eating, activity, and lifestyle study. J Clin Oncol 2008;26:3958–64.
- Holick CN, Newcomb PA, Trentham-Dietz A, et al. Physical activity and survival after diagnosis of invasive breast cancer. Cancer Epidemiol Biomarkers Prev 2008;17:379.
- Meyerhardt JA, Giovannucci EL, Holmes MD, et al. Physical activity and survival after colorectal cancer diagnosis. J Clin Oncol 2006;24:3527–34.
- Meyerhardt JA, Heseltine D, Niedzwiecki D, et al. Impact of physical activity on cancer recurrence and survival in patients with stage III colon cancer: findings from CALGB 89803. J Clin Oncol 2006;24:3535–41.
- Schmitz KH, Holtzman J, Courneya KS, Mâsse LC, Duval S, Kane R. Controlled physical activity trials in cancer survivors: a systematic review and meta-analysis. Cancer Epidemiol Biomarkers Prev 2005;14:1588.
- Speck RM, Courneya KS, Mâsse LC, Duval S, Schmitz KH. An update of controlled physical activity trials in cancer survivors: a systematic review and meta-analysis. J Cancer Surviv 2010;4:87–100.
- Schmitz KH, Courneya KS, Matthews C, et al. American College of Sports Medicine roundtable on exercise guidelines for cancer survivors. Med Sci Sports Exerc 2010;42:1409.
- CDC. Physical activity among Behavioral Risk Factor Surveillance System respondents. Atlanta, GA: CDC; 2011. Available at http://apps.nccd.cdc.gov/BRFSS. Accessed July 27, 2011.
- Nelson DE, Bland S, Powell-Griner E, et al. State trends in health risk factors and receipt of clinical preventive services among U.S. adults during the 1990s. JAMA 2002;287:2659.
- McInnes DK, Cleary PD, Stein KD, Ding L, Mehta CC, Ayanian JZ. Perceptions of cancer-related information among cancer survivors: a report from the American Cancer Society's Studies of Cancer Survivors. Cancer 2008;113:1471–9.
- Beckjord EB, Arora NK, McLaughlin W, Oakley-Girvan I, Hamilton AS, Hesse BW. Health-related information needs in a large and diverse sample of adult cancer survivors: implications for cancer care. J Cancer Surviv Sep 2008;2:179–89.
- Hawkins NA, Pollack LA, Leadbetter S, et al. Informational needs of patients and perceived adequacy of information available before and after treatment of cancer. J Psychosocial Oncol 2008;26:1.
- Gage EA, Pailler M, Zevon MA, et al. Structuring survivorship care: discipline-specific clinician perspectives. J Cancer Surviv 2011;5:217–25.
- Snyder CF, Earle CC, Herbert RJ, Neville BA, Blackford AL, Frick KD. Trends in follow-up and preventive care for colorectal cancer survivors. J Gen Intern Med 2008;23:254–9.
- Snyder CF, Earle CC, Herbert RJ, Neville BA, Blackford AL, Frick KD. Preventive care for colorectal cancer survivors: a 5-year longitudinal study. J Clin Oncol 2008;26:1073–9.
- Wu X, Richardson LC, Kahn AR, et al. Survival difference between non-Hispanic black and non-Hispanic white women with localized breast cancer: the impact of guideline-concordant therapy. J Natl Med Assoc 2008;100:490–8.
- Hewitt M, Breen N, Devesa S. Cancer prevalence and survivorship issues: analyses of the 1992 National Health Interview Survey. J Natl Cancer Inst 1999;91:1480–6.
- Murthy VH, Krumholz HM, Gross CP. Participation in cancer clinical trials. JAMA 2004;291:2720.
- Patrick DL, Ferketich SL, Frame PS, et al; National Institutes of Health State-of-the-Science Panel. National Institutes of Health State-of-the-Science Conference Statement: Symptom Management in Cancer: Pain, Depression, and Fatigue, July 15–17, 2002. J Natl Cancer Inst 2003;95:1110–7.
- Anderson KO, Mendoza TR, Valero V, et al. Minority cancer patients and their providers: pain management attitudes and practice. Cancer 2000;88:1929–38.
- McMillan SC, Tittle M, Hagan S, Laughlin J. Management of pain and pain-related symptoms in hospitalized veterans with cancer. Cancer Nurs 2000;23:327–36.
- Gordon DB, Dahl JL, Miaskowski C, et al. American Pain Society recommendations for improving the quality of acute and cancer pain management: American Pain Society Quality of Care Task Force. Arch Intern Med 2005;165:1574–80.
- Sabatino SA, Coates RJ, Uhler RJ, Alley LG, Pollack LA. Health insurance coverage and cost barriers to needed medical care among U.S. adult cancer survivors age <65 years. Cancer 2006;106:2466–75.
- Weaver KE, Rowland JH, Bellizzi KM, Aziz NM. Forgoing medical care because of cost: assessing disparities in healthcare access among cancer survivors living in the United States. Cancer 2010;116:3493–504.
- Patient Protection and Affordable Care Act of 2010. Pub. L. No. 111-148 (March 23, 2010).
- Mariotto AB, Yabroff KR, Shao Y, Feuer EJ, Brown ML. Projections of the cost of cancer care in the United States: 2010–2020. J Natl Cancer Inst 2011;103:117–28.
- Brown ML, Lipscomb J, Snyder C. The burden of illness of cancer: economic cost and quality of life. Annu Rev Public Health 2001;22:91–113.
- Taplin SH, Barlow W, Urban N, et al. Stage, age, comorbidity, and direct costs of colon, prostate, and breast cancer care. J Natl Cancer Inst 1995;87:417–26.
- Rice DP. Estimating the cost of illness. Washington, DC: US Government Printing Office; 1966. Publication no. 947-6.
- Gold M. Panel on cost-effectiveness in health and medicine. Med Care 1996;34(Suppl):DS197-199.
- Brown M, Hodgson T, Rice D. Economic impact of cancer in the United States. In: Schottenfeld D, Fraumeni J, eds. Cancer epidemiology and prevention. 2nd ed. New York, NY: Oxford University Press; 1993:255–66.
- Chirikos TN, Russell-Jacobs A, Cantor AB. Indirect economic effects of long-term breast cancer survival. Cancer Pract 2002;10:248–55.
- Given BA, Given CW, Stommel M. Family and out-of-pocket costs for women with breast cancer. Cancer Pract 1994;2:187–93.
- Stommel M, Given CW, Given BA. The cost of cancer home care to families. Cancer 1993;71:1867–74.
- Hayman JA, Langa KM, Kabeto MU, et al. Estimating the cost of informal caregiving for elderly patients with cancer. J Clin Oncol 2001;19:3219–25.
- Emanuel EJ, Fairclough DL, Slutsman J, Alpert H, Baldwin D, Emanuel LL. Assistance from family members, friends, paid care givers, and volunteers in the care of terminally ill patients. N Engl J Med 1999;341:956–63.
- Hodgson T, Meiners M. Cost-of-illness methodology: a guide to assessment practices and procedures. Milbank Mem Fund Q 1982;60:429–91.
- Jacobsen PB, Jim HS. Psychosocial interventions for anxiety and depression in adult cancer patients: achievements and challenges. CA Cancer J Clin 2008;58:214–30.
- Desai MM, Bruce ML, Desai RA, Druss BG. Validity of self-reported cancer history: a comparison of health interview data and cancer registry records. Am J Epidemiol 2001;153:299–306.
- CDC. Improvements to BRFSS methodology, design, and implementation. Atlanta, GA: CDC; 2006. Available at http://www.cdc.gov/brfss/pubs/methodology.htm. Accessed August 29, 2011.
- Nelson DE, Powell-Griner E, Town M, Kovar MG. A comparison of national estimates from the National Health Interview Survey and the Behavioral Risk Factor Surveillance System. Am J Public Health 2003;93:1335–41.
|
TABLE 1. (Continued) Demographic and health behavior characteristics of self-reported cancer survivors aged ≥18 years, by sex — Behavioral Risk Factor Surveillance System, United States 2009 |
||||||||||||
|---|---|---|---|---|---|---|---|---|---|---|---|---|
|
Characteristic |
Total cancer survivors |
Men |
Women |
|||||||||
|
%* |
(95% CI) |
Sample size |
Weighted no. |
% |
(95% CI) |
Sample size |
Weighted no. |
% |
(95% CI) |
Sample size |
Weighted no. |
|
|
Employment |
||||||||||||
|
Employed for wages |
34.6 |
(33.8–35.5) |
13,719 |
5,565,366 |
34.7 |
(33.2–36.3) |
4,645 |
2,248,424 |
34.6 |
(33.5–35.7) |
9,074 |
3,316,941 |
|
Out of work or unable to work |
14.2 |
(13.6–14.9) |
6,036 |
2,283,019 |
11.5 |
(10.5–12.6) |
1,583 |
744,942 |
16.0 |
(15.2–16.9) |
4,453 |
1,538,078 |
|
Retired |
42.4 |
(41.5–43.2) |
22,390 |
6,806,185 |
52.5 |
(51.0–54.0) |
9,398 |
3,397,729 |
35.5 |
(34.6–36.5) |
12,992 |
3,408,456 |
|
Other |
8.6 |
(8.0–9.1) |
3,297 |
1,373,776 |
1.0 |
(0.7–1.6) |
63 |
67,727 |
13.6 |
(12.8–14.5) |
3,234 |
1,306,049 |
|
Insurance coverage |
||||||||||||
|
Yes |
93.0 |
(92.4–93.5) |
43,046 |
14,938,414 |
94.3 |
(93.4–95.2) |
15,094 |
6,107,834 |
92.1 |
(91.3–92.8) |
27,952 |
8,830,580 |
|
No |
6.8 |
(6.3–7.4) |
2,421 |
1,090,994 |
5.4 |
(4.6,6.3) |
602 |
350,558 |
7.7 |
(7.0–8.5) |
1,819 |
740,436 |
|
Chronic conditions |
||||||||||||
|
Cardiovascular disease |
18.0 |
(17.4–18.6) |
8,962 |
2,890,570 |
23.4 |
(22.3–24.7) |
4,001 |
1,518,057 |
14.3 |
(13.7–15.0) |
4,961 |
1,372,513 |
|
Diabetes |
16.7 |
(16.0–17.3) |
8,086 |
2,674,835 |
19.6 |
(18.5–20.7) |
3,115 |
1,267,312 |
14.7 |
(14.0–15.4) |
4,971 |
1,407,523 |
|
Current asthma |
10.9 |
(10.4 –11.5) |
4,986 |
1,756,367 |
7.5 |
(6.7–8.3) |
1,146 |
482,789 |
13.3 |
(12.6–14.0) |
3,840 |
1,273,578 |
|
Cancer screenings† |
||||||||||||
|
Cervical§ (n = 1,065) |
— |
— |
— |
— |
— |
— |
— |
— |
79.4 |
(75.4–82.9) |
823 |
382,531 |
|
Colorectal¶ (n = 4,146) |
75.1 |
(72.8–77.2) |
3,050 |
843,740 |
77.9 |
(74.0–81.4) |
1,138 |
359,289 |
73.1 |
(70.3–75.7) |
1,912 |
484,451 |
|
Breast** (n = 1,920) |
— |
— |
— |
— |
— |
— |
— |
— |
80.4 |
(77.4–83.0) |
1,517 |
580,689 |
|
Prostate†† (n = 898) |
— |
— |
— |
— |
81.7 |
(77.5–85.2) |
700 |
248,036 |
— |
— |
— |
— |
|
Other |
||||||||||||
|
Activity limitations because of health problems |
35.3 |
(34.5–36.1) |
16,850 |
5,666,446 |
34.0 |
(32.6–35.4) |
5,525 |
2,200,270 |
36.1 |
(35.1–37.2) |
11,325 |
3,466,177 |
|
Influenza vaccine within the past 12 months§§ |
57.8 |
(56.9–58.7) |
28,501 |
9,281,437 |
62.3 |
(60.8–63.8) |
10,430 |
4,032,535 |
54.7 |
(53.6–55.8) |
18,071 |
5,248,902 |
|
Ever received pneumococcal vaccine |
48.3 |
(47.4–49.1) |
24,874 |
7,751,436 |
49.8 |
(48.3–51.2) |
8,840 |
3,222,560 |
47.2 |
(46.1–48.3) |
16,034 |
4,528,876 |
|
Abbreviations: CI = confidence interval; GED = general educational development. * Percentages might not total 100% because unknown and refused categories were excluded. † Five states (Georgia, Hawaii, New Jersey, Tennessee, and Wyoming) included questions on mammography and Papanicolaou (Pap) test use among women. Eight states (Delaware, Hawaii, Maine, Massachusetts, Nebraska, New Jersey, Oklahoma, and Wyoming) included colorectal cancer screening questions. Five states (Delaware, Hawaii, Kentucky, Nebraska, and New Jersey) included prostate cancer screening questions among men. § Cervical cancer screening: prevalence estimate of women aged ≥18 years who received a Pap test within the past 3 years, excluding women who had received a hysterectomy. ¶ Colorectal cancer screening: prevalence estimate of men and women aged ≥50 years who received a fecal occult blood test within the past year, sigmoidoscopy within the past 5 years, or colonoscopy within the past 10 years. ** Breast cancer screening: prevalence estimate of women aged ≥40 years who received mammography screening within the past 2 years. †† Prostate cancer screening: prevalence estimate of men aged ≥50 years who received a prostate-specific antigen test within the past 2 years (proxy measure for discussion about prostate cancer risk). §§ Injectable influenza vaccine only. |
||||||||||||
|
TABLE 3. (Continued) Prevalence of selected types of cancer among cancer survivors aged ≥18 years, by race/ethnicity — Behavioral Risk Factor Surveillance System, United States, 2009 |
||||||||||||
|---|---|---|---|---|---|---|---|---|---|---|---|---|
|
Cancer type |
Asian/Pacific Islander |
American Indian/Alaska Native |
Hispanic |
|||||||||
|
% |
(95% CI) |
Sample size |
Weighted no. |
% |
(95% CI) |
Sample size |
Weighted no. |
% |
(95% CI) |
Sample size |
Weighted no. |
|
|
All types |
100 |
— |
514 |
257,229 |
100 |
— |
716 |
267,555 |
100 |
— |
1,524 |
1,012,231 |
|
Both sexes |
||||||||||||
|
Breast* |
25.8 |
(17.0–37.2) |
173 |
66,493 |
16.1 |
(11.3–22.3) |
130 |
42,957 |
17.3 |
(13.6–21.7) |
333 |
174,875 |
|
Melanoma |
—† |
— |
— |
— |
— |
— |
— |
— |
4.2 |
(2.7–6.6) |
72 |
43,005 |
|
Gastrointestinal |
5.8 |
(3.2–10.1) |
50 |
14,801 |
6.1 |
(3.2–11.2) |
66 |
16,193 |
8.4 |
(6.3–11.1) |
143 |
85,111 |
|
Colorectal |
— |
— |
— |
— |
— |
— |
— |
— |
6.4 |
(4.6–8.7) |
112 |
64,293 |
|
Leukemia/Lymphoma (lymph nodes and bone marrow) |
— |
— |
— |
— |
— |
— |
— |
— |
5.6 |
(3.6–8.5) |
61 |
56,302 |
|
Urinary tract |
— |
— |
— |
— |
— |
— |
— |
— |
4.3 |
(2.8–6.6) |
52 |
43,500 |
|
Lung |
— |
— |
— |
— |
— |
— |
— |
— |
— |
— |
— |
— |
|
Head/Neck, all |
— |
— |
— |
— |
— |
— |
— |
— |
— |
— |
— |
— |
|
Genital |
— |
— |
— |
— |
42.3 |
(34.9–50.1) |
266 |
113,208 |
36.1 |
(31.1–41.3) |
514 |
365,119 |
|
Other cancer types¶ |
17.4 |
(9.8–29.0) |
63 |
44,821 |
12.0 |
(7.5–18.6) |
75 |
32,083 |
12.7 |
(9.8–16.3) |
179 |
128,744 |
|
Unknown/Refused |
— |
— |
— |
— |
9.6 |
(5.5–16.4) |
52 |
25,708 |
6.1 |
(4.4–8.5) |
109 |
62,209 |
|
Male genital§ |
— |
— |
— |
— |
— |
— |
— |
— |
35.2 |
(27.1–44.2) |
194 |
128,565 |
|
Prostate |
— |
— |
— |
— |
— |
— |
— |
— |
34.1 |
(26.1–43.2) |
183 |
124,635 |
|
Female genital§ |
— |
— |
— |
— |
41.1 |
(32.7–50.1) |
200 |
76,028 |
36.6 |
(30.5–43.1) |
320 |
236,554 |
|
Cervical |
— |
— |
— |
— |
28.9 |
(21.6–37.6) |
132 |
53,477 |
20.4 |
(15.3–26.6) |
178 |
131,943 |
|
Abbreviation: CI = confidence interval. * Breast cancer includes prevalence among men and women (see Table 2). † Data suppressed because the sample size of the numerator was <50 or the half-width of the confidence interval was >10. § Male and female genital cancer calculations use sex-specific denominators. ¶ Includes brain, bone, thyroid, heart, neuroblastoma, and the response category of other. |
||||||||||||
|
TABLE 4. (Continued) Prevalence of cancer among adults aged ≥18 years and of selected types of cancer among survivors aged ≥18 years, by geographic area and sex — Behavioral Risk Factor Surveillance System, United States, 2009 |
||||||||||||
|---|---|---|---|---|---|---|---|---|---|---|---|---|
|
State/Area |
Breast cancer prevalence among female cancer survivors† |
Cervical cancer prevalence among female cancer survivors† |
Other female genital system cancer prevalence among female cancer survivors† |
|||||||||
|
% |
(95% CI) |
Sample size |
Weighted no. |
% |
(95% CI) |
Sample size |
Weighted no. |
% |
(95% CI) |
Sample size |
Weighted no. |
|
|
United States |
32.4 |
(31.4–33.4) |
10,248 |
3,109,948 |
14.5 |
(13.7–15.4) |
3,512 |
1,392,855 |
10.3 |
(9.6–11.0) |
3,082 |
984,392 |
|
Northeast |
36.4 |
(33.7–39.2) |
1,951 |
670,248 |
10.5 |
(9.0–12.2) |
532 |
193,291 |
9.4 |
(7.9–11.1) |
511 |
172,871 |
|
Connecticut |
38.3 |
(32.5–44.5) |
184 |
46,287 |
— |
— |
— |
— |
— |
— |
— |
— |
|
Maine |
30.9 |
(26.5–35.5) |
192 |
16,272 |
15.8 |
(12.6–19.7) |
91 |
8,342 |
13.0 |
(10.3–16.3) |
85 |
6,863 |
|
Massachusetts |
34.2 |
(30.5–38.2) |
390 |
73,356 |
10.7 |
(8.2–13.9) |
111 |
22,876 |
9.4 |
(7.0–12.6) |
105 |
20,176 |
|
New Hampshire |
34.4 |
(29.3–40.0) |
166 |
15,831 |
— |
— |
— |
— |
— |
— |
— |
— |
|
New Jersey |
34.6 |
(30.3–39.1) |
291 |
92,785 |
10.9 |
(7.5–15.6) |
75 |
29,351 |
5.9 |
(4.3–8.0) |
55 |
15,778 |
|
New York |
39.5 |
(33.1–46.2) |
183 |
256,211 |
— |
— |
— |
— |
— |
— |
— |
— |
|
Pennsylvania |
34.8 |
(30.0–39.8) |
233 |
149,762 |
13.0 |
(9.7–17.3) |
69 |
55,960 |
11.8 |
(8.6–16.1) |
70 |
50,841 |
|
Rhode Island |
32.8 |
(28.1–37.9) |
155 |
12,684 |
— |
— |
— |
— |
— |
— |
— |
— |
|
Vermont |
32.3 |
(27.7–37.2) |
157 |
7,060 |
— |
— |
— |
— |
12.3 |
(9.3–16.1) |
60 |
2,694 |
|
Midwest |
32.6 |
(30.8–34.5) |
2,448 |
705,540 |
12.6 |
(11.2–14.3) |
773 |
273,183 |
9.8 |
(8.7–11.1) |
757 |
212,764 |
|
Illinois |
33.1 |
(27.5–39.2) |
131 |
125,632 |
— |
— |
— |
— |
— |
— |
— |
— |
|
Indiana |
29.9 |
(25.5–34.7) |
213 |
65,660 |
21.2 |
(16.0–27.6) |
94 |
46,574 |
11.8 |
(8.6–16.1) |
79 |
25,975 |
|
Iowa |
32.9 |
(28.0–38.3) |
141 |
33,180 |
— |
— |
— |
— |
— |
— |
— |
— |
|
Kansas |
31.3 |
(28.5–34.1) |
469 |
28,525 |
17.6 |
(14.8–20.9) |
170 |
16,103 |
10.4 |
(8.7–12.4) |
148 |
9,487 |
|
Michigan |
30.6 |
(26.8–34.7) |
238 |
108,878 |
14.7 |
(11.2–19.0) |
80 |
52,165 |
6.7 |
(4.9–9.1) |
50 |
23,726 |
|
Minnesota |
37.1 |
(31.6–42.9) |
133 |
51,509 |
— |
— |
— |
— |
— |
— |
— |
— |
|
Missouri |
31.9 |
(25.8–38.7) |
131 |
68,292 |
— |
— |
— |
— |
14.9 |
(9.8–21.9) |
54 |
31,816 |
|
Nebraska |
33.0 |
(28.2–38.2) |
403 |
18,450 |
14.7 |
(10.4–20.3) |
103 |
8,208 |
7.3 |
(5.6–9.5) |
118 |
4,070 |
|
North Dakota |
29.8 |
(24.1–36.3) |
95 |
5,579 |
— |
— |
— |
— |
— |
— |
— |
— |
|
Ohio |
31.4 |
(27.1–36.1) |
226 |
117,033 |
11.6 |
(8.2–16.3) |
63 |
43,318 |
8.9 |
(6.7–11.7) |
65 |
33,054 |
|
South Dakota |
33.5 |
(28.2–39.2) |
160 |
8,103 |
13.0 |
(9.4–17.7) |
55 |
3,142 |
14.3 |
(10.5–19.2) |
61 |
3,467 |
|
Wisconsin |
38.9 |
(31.0–47.5) |
108 |
74,697 |
— |
— |
— |
— |
— |
— |
— |
— |
|
South |
30.8 |
(29.2–32.4) |
3,224 |
1,101,678 |
17.1 |
(15.6–18.7) |
1,213 |
613,128 |
10.3 |
(9.1–11.7) |
1,003 |
369,707 |
|
Alabama |
28.0 |
(22.8–34.0) |
148 |
45,705 |
18.8 |
(14.0–24.9) |
66 |
30,718 |
12.0 |
(8.9–16.0) |
68 |
19,553 |
|
Arkansas |
30.8 |
(24.9–37.4) |
112 |
31,230 |
— |
— |
— |
— |
— |
— |
— |
— |
|
Delaware |
40.5 |
(33.3–48.1) |
120 |
12,243 |
— |
— |
— |
— |
— |
— |
— |
— |
|
District of Columbia |
31.8 |
(25.6–38.9) |
82 |
5,403 |
— |
— |
— |
— |
— |
— |
— |
— |
|
Florida |
30.5 |
(26.2–35.1) |
306 |
207,073 |
16.4 |
(12.5–21.4) |
135 |
111,712 |
9.9 |
(6.9–14.1) |
93 |
67,530 |
|
Georgia |
32.1 |
(26.2–38.5) |
132 |
91,059 |
20.3 |
(14.5–27.6) |
53 |
57,569 |
— |
— |
— |
— |
|
Kentucky |
27.6 |
(23.0–32.8) |
246 |
43,887 |
16.2 |
(11.7–21.9) |
105 |
25,736 |
16.4 |
(11.7–22.6) |
100 |
26,148 |
|
Louisiana |
28.9 |
(24.7–33.5) |
200 |
42,092 |
17.3 |
(12.9–22.7) |
72 |
25,171 |
10.9 |
(7.9–14.8) |
66 |
15,822 |
|
Maryland |
32.1 |
(27.6–37.0) |
217 |
53,157 |
12.5 |
(8.9–17.4) |
54 |
20,719 |
— |
— |
— |
— |
|
Mississippi |
29.1 |
(25.3–33.2) |
256 |
25,244 |
16.6 |
(13.0–20.8) |
96 |
14,373 |
12.9 |
(9.9–16.6) |
94 |
11,186 |
|
North Carolina |
35.8 |
(31.3–40.6) |
339 |
115,615 |
11.7 |
(8.7–15.4) |
100 |
37,671 |
13.2 |
(10.0–17.2) |
123 |
42,599 |
|
Oklahoma |
28.5 |
(24.7–32.7) |
215 |
37,948 |
22.4 |
(17.7–27.8) |
101 |
29,753 |
10.4 |
(7.9–13.7) |
65 |
13,855 |
|
South Carolina |
30.3 |
(25.8–35.2) |
239 |
47,144 |
18.8 |
(14.0–24.7) |
85 |
29,198 |
8.4 |
(6.0–11.5) |
66 |
13,003 |
|
Tennessee |
27.1 |
(22.1–32.7) |
131 |
53,281 |
22.8 |
(17.2–29.7) |
69 |
44,905 |
— |
— |
— |
— |
|
Texas |
30.7 |
(25.7–36.1) |
262 |
195,587 |
17.8 |
(13.4–23.4) |
95 |
113,769 |
12.3 |
(8.1–18.3) |
67 |
78,293 |
|
Virginia |
33.0 |
(26.7–40.0) |
120 |
77,431 |
— |
— |
— |
— |
— |
— |
— |
— |
|
West Virginia |
25.8 |
(21.1–31.2) |
99 |
17,580 |
21.9 |
(16.9–28.0) |
58 |
14,921 |
16.8 |
(12.9–21.7) |
58 |
11,459 |
|
West |
31.6 |
(29.6–33.7) |
2,509 |
610,990 |
15.9 |
(14.2–17.7) |
969 |
307,107 |
11.3 |
(9.9–13.0) |
773 |
219,353 |
|
Alaska |
— |
— |
— |
— |
— |
— |
— |
— |
— |
— |
— |
— |
|
Arizona |
31.9 |
(25.3–39.2) |
135 |
66,405 |
— |
— |
— |
— |
— |
— |
— |
— |
|
California |
33.3 |
(29.4–37.5) |
357 |
276,385 |
16.0 |
(12.9–19.7) |
130 |
132,946 |
13.7 |
(10.8–17.1) |
114 |
113,279 |
|
Colorado |
31.5 |
(27.6–35.7) |
253 |
41,404 |
16.9 |
(13.5–21.0) |
98 |
22,261 |
13.5 |
(10.8–16.7) |
99 |
17,740 |
|
Hawaii |
42.6 |
(36.6–48.9) |
174 |
16,458 |
— |
— |
— |
— |
— |
— |
— |
— |
|
Idaho |
28.1 |
(22.5–34.5) |
110 |
13,645 |
18.5 |
(13.7–24.5) |
56 |
8,985 |
— |
— |
— |
— |
|
Montana |
32.3 |
(27.3–37.8) |
188 |
11,729 |
14.3 |
(10.3–19.6) |
71 |
5,205 |
12.1 |
(9.0–16.1) |
71 |
4,385 |
|
Nevada |
28.7 |
(21.4–37.3) |
86 |
24,728 |
20.8 |
(14.2–29.3) |
59 |
17,898 |
— |
— |
— |
— |
|
New Mexico |
34.2 |
(29.6–39.2) |
209 |
20,943 |
17.7 |
(13.9–22.2) |
86 |
10,811 |
10.5 |
(7.8–14.0) |
71 |
6,423 |
|
Oregon |
24.7 |
(20.0–30.0) |
108 |
36,589 |
— |
— |
— |
— |
— |
— |
— |
— |
|
Utah |
28.2 |
(23.7–33.1) |
173 |
17,420 |
17.4 |
(12.8–23.3) |
67 |
10,772 |
11.9 |
(8.8–15.9) |
61 |
7,375 |
|
Washington |
29.5 |
(26.6–32.4) |
528 |
72,754 |
19.1 |
(15.4–23.5) |
205 |
47,173 |
7.5 |
(6.0–9.4) |
127 |
18,627 |
|
Wyoming |
26.1 |
(21.9–30.8) |
140 |
4,905 |
16.3 |
(12.4–21.1) |
59 |
3,057 |
12.2 |
(9.1–16.0) |
55 |
2,281 |
|
Territories |
31.8 |
(24.8–39.6) |
116 |
21,492 |
— |
— |
— |
— |
— |
— |
— |
— |
|
Guam |
— |
— |
— |
— |
— |
— |
— |
— |
— |
— |
— |
— |
|
Puerto Rico |
31.3 |
(24.1–39.6) |
67 |
20,120 |
— |
— |
— |
— |
— |
— |
— |
— |
|
U.S. Virgin Islands |
— |
— |
— |
— |
— |
— |
— |
— |
— |
— |
— |
— |
|
TABLE 4. (Continued) Prevalence of cancer among adults aged ≥18 years and of selected types of cancer among survivors aged ≥18 years, by geographic area and sex — Behavioral Risk Factor Surveillance System, United States, 2009 |
||||||||||||
|---|---|---|---|---|---|---|---|---|---|---|---|---|
|
State/Area |
Colorectal cancer prevalence among cancer survivors |
Prostate cancer prevalence among male cancer survivors† |
Melanoma prevalence among cancer survivors |
|||||||||
|
% |
(95% CI) |
Sample size |
Weighted no. |
% |
(95% CI) |
Sample size |
Weighted no. |
% |
(95% CI) |
Sample size |
Weighted no. |
|
|
United States |
6.7 |
(6.3–7.1) |
3,331 |
1,077,574 |
33.3 |
(31.9–34.6) |
5,713 |
2,153,172 |
12.3 |
(11.8–12.8) |
5,571 |
1,971,310 |
|
Northeast |
6.6 |
(5.7–7.7) |
608 |
204,244 |
33.6 |
(30.6–36.8) |
952 |
413,251 |
10.8 |
(9.7–12.0) |
900 |
333,003 |
|
Connecticut |
— |
— |
— |
— |
29.0 |
(22.6–36.5) |
85 |
22,664 |
7.8 |
(5.6–10.9) |
55 |
15,578 |
|
Maine |
6.1 |
(4.7–7.9) |
67 |
5,089 |
31.1 |
(25.3–37.5) |
92 |
9,585 |
14.8 |
(11.9–18.3) |
114 |
12,353 |
|
Massachusetts |
6.4 |
(5.0–8.2) |
110 |
22,671 |
28.2 |
(23.5–33.5) |
175 |
39,498 |
10.2 |
(8.2–12.4) |
151 |
35,986 |
|
New Hampshire |
7.1 |
(5.3–9.6) |
56 |
5,600 |
31.2 |
(24.4–38.8) |
85 |
10,129 |
12.2 |
(8.9–16.5) |
77 |
9,584 |
|
New Jersey |
8.1 |
(6.3–10.5) |
88 |
35,345 |
32.2 |
(26.5–38.5) |
113 |
53,597 |
8.6 |
(6.7–10.8) |
103 |
37,208 |
|
New York |
— |
— |
— |
— |
38.9 |
(32.0–46.3) |
112 |
169,666 |
11.6 |
(9.3–14.5) |
96 |
126,159 |
|
Pennsylvania |
9.1 |
(6.9–11.8) |
92 |
66,291 |
31.4 |
(25.9–37.4) |
121 |
94,535 |
11.4 |
(9.3–13.9) |
127 |
83,162 |
|
Rhode Island |
7.6 |
(5.7–10.2) |
57 |
5,174 |
33.0 |
(26.9–39.7) |
94 |
9,594 |
10.4 |
(7.9–13.6) |
68 |
7,068 |
|
Vermont |
— |
— |
— |
— |
27.1 |
(21.6–33.5) |
75 |
3,983 |
16.1 |
(13.3–19.5) |
109 |
5,905 |
|
Midwest |
6.8 |
(6.1–7.6) |
844 |
247,183 |
32.7 |
(30.2–35.2) |
1,357 |
483,479 |
12.4 |
(11.4–13.5) |
1,287 |
452,023 |
|
Illinois |
— |
— |
— |
— |
32.4 |
(25.4–40.4) |
65 |
74,603 |
10.8 |
(8.2–14.0) |
65 |
65,626 |
|
Indiana |
7.3 |
(5.5–9.6) |
76 |
24,809 |
31.3 |
(24.9–38.4) |
106 |
37,893 |
11.6 |
(9.3–14.3) |
116 |
39,371 |
|
Iowa |
9.6 |
(7.2–12.6) |
58 |
15,839 |
26.1 |
(20.0–33.3) |
68 |
16,893 |
15.9 |
(11.8–21.2) |
74 |
26,357 |
|
Kansas |
5.8 |
(4.8–6.9) |
142 |
8,642 |
34.1 |
(29.8–38.8) |
240 |
20,084 |
14.4 |
(12.3–16.7) |
260 |
21,601 |
|
Michigan |
5.7 |
(4.3–7.5) |
68 |
34,588 |
33.8 |
(27.4–40.8) |
142 |
85,691 |
16.6 |
(13.9–19.7) |
164 |
101,126 |
|
Minnesota |
— |
— |
— |
— |
38.3 |
(30.8–46.4) |
84 |
41,430 |
11.1 |
(8.4–14.4) |
59 |
27,369 |
|
Missouri |
— |
— |
— |
— |
35.6 |
(27.3–44.9) |
74 |
50,653 |
15.4 |
(11.8–19.7) |
77 |
54,743 |
|
Nebraska |
6.2 |
(4.8–7.9) |
147 |
5,902 |
31.0 |
(25.4–37.1) |
236 |
12,187 |
15.8 |
(12.5–19.7) |
221 |
15,057 |
|
North Dakota |
— |
— |
— |
— |
37.9 |
(29.5–47.1) |
62 |
5,248 |
— |
— |
— |
— |
|
Ohio |
7.8 |
(6.0–10.1) |
82 |
50,809 |
25.7 |
(20.7–31.3) |
99 |
71,795 |
8.2 |
(6.4–10.4) |
87 |
53,230 |
|
South Dakota |
10.3 |
(7.9–13.3) |
74 |
4,439 |
36.7 |
(29.8–44.2) |
105 |
6,909 |
9.7 |
(7.2–12.9) |
65 |
4,179 |
|
Wisconsin |
— |
— |
— |
— |
40.6 |
(31.1–50.9) |
76 |
60,094 |
11.7 |
(8.1–16.7) |
51 |
39,860 |
|
South |
6.9 |
(6.2–7.6) |
1100 |
414,269 |
32.4 |
(30.0–34.8) |
1,791 |
789,578 |
13.2 |
(12.3–14.2) |
1,859 |
794,674 |
|
Alabama |
8.3 |
(5.9–11.5) |
61 |
23,989 |
31.4 |
(22.8–41.5) |
67 |
39,742 |
11.8 |
(9.0–15.3) |
96 |
34,143 |
|
Arkansas |
— |
— |
— |
— |
33.1 |
(24.8–42.5) |
52 |
19,853 |
16.7 |
(12.2–22.4) |
55 |
26,929 |
|
Delaware |
— |
— |
— |
— |
29.1 |
(21.7–37.7) |
60 |
6,095 |
11.8 |
(8.8–15.8) |
59 |
6,061 |
|
District of Columbia |
— |
— |
— |
— |
41.6 |
(33.4–50.2) |
73 |
5,499 |
— |
— |
— |
— |
|
Florida |
7.0 |
(5.0–9.6) |
98 |
85,508 |
31.2 |
(24.7–38.4) |
188 |
171,142 |
13.2 |
(10.9–16.0) |
218 |
162,433 |
|
Georgia |
— |
— |
— |
— |
29.9 |
(21.7–39.7) |
62 |
52,209 |
10.0 |
(7.3–13.5) |
60 |
45,852 |
|
Kentucky |
6.6 |
(5.0–8.8) |
96 |
17,870 |
22.7 |
(16.9–29.8) |
86 |
24,950 |
16.2 |
(12.6–20.5) |
136 |
43,532 |
|
Louisiana |
9.3 |
(7.1–12.2) |
88 |
22,311 |
40.7 |
(33.9–47.9) |
138 |
37,843 |
11.1 |
(8.3–14.7) |
100 |
26,497 |
|
Maryland |
6.7 |
(4.8–9.3) |
59 |
19,881 |
30.1 |
(24.1–36.8) |
114 |
39,153 |
10.5 |
(8.4–13.2) |
106 |
31,190 |
|
Mississippi |
8.3 |
(6.4–10.6) |
106 |
12,532 |
36.7 |
(31.3–42.4) |
187 |
23,555 |
14.4 |
(11.8–17.4) |
168 |
21,699 |
|
North Carolina |
6.3 |
(4.9–8.1) |
100 |
32,322 |
31.8 |
(26.2–38.0) |
173 |
60,023 |
14.8 |
(12.1–18.1) |
214 |
75,920 |
|
Oklahoma |
5.7 |
(4.3–7.6) |
58 |
12,018 |
37.8 |
(31.5–44.5) |
107 |
28,898 |
11.0 |
(8.9–13.6) |
94 |
23,036 |
|
South Carolina |
6.8 |
(5.0–9.2) |
82 |
17,894 |
33.2 |
(26.4–40.7) |
150 |
36,087 |
15.3 |
(12.0–19.3) |
155 |
40,385 |
|
Tennessee |
— |
— |
— |
— |
29.2 |
(21.4–38.5) |
50 |
28,711 |
13.1 |
(9.8–17.2) |
64 |
38,589 |
|
Texas |
5.5 |
(3.9–7.7) |
71 |
58,151 |
34.5 |
(27.7–42.0) |
148 |
144,377 |
14.4 |
(11.8–17.6) |
186 |
152,528 |
|
Virginia |
— |
— |
— |
— |
34.4 |
(26.3–43.5) |
72 |
56,927 |
12.7 |
(9.6–16.8) |
61 |
50,971 |
|
West Virginia |
10.6 |
(7.8–14.3) |
52 |
11,784 |
34.0 |
(26.8–42.0) |
64 |
14,515 |
10.4 |
(7.8–13.8) |
51 |
11,563 |
|
West |
6.3 |
(5.4–7.2) |
741 |
201,522 |
34.8 |
(32.2–37.6) |
1,527 |
446,136 |
12.1 |
(11.1–13.2) |
1,509 |
388,822 |
|
Alaska |
— |
— |
— |
— |
— |
— |
— |
— |
— |
— |
— |
— |
|
Arizona |
— |
— |
— |
— |
39.4 |
(30.6–49.0) |
104 |
62,459 |
13.3 |
(9.6–18.1) |
85 |
48,903 |
|
California |
7.6 |
(5.9–9.8) |
105 |
101,163 |
37.1 |
(31.7–42.8) |
204 |
183,733 |
9.4 |
(7.6–11.6) |
134 |
125,010 |
|
Colorado |
6.9 |
(5.3–8.9) |
81 |
14,880 |
36.6 |
(30.9–42.7) |
150 |
30,545 |
16.1 |
(13.6–19.1) |
171 |
34,668 |
|
Hawaii |
— |
— |
— |
— |
33.1 |
(25.2–42.0) |
77 |
8,232 |
7.7 |
(5.7–10.3) |
65 |
4,887 |
|
Idaho |
— |
— |
— |
— |
34.9 |
(27.0–43.7) |
67 |
10,679 |
16.4 |
(12.5–21.3) |
81 |
12,996 |
|
Montana |
5.4 |
(4.0–7.4) |
55 |
3,243 |
37.0 |
(30.7–43.7) |
119 |
8,655 |
15.0 |
(12.1–18.5) |
115 |
8,952 |
|
Nevada |
— |
— |
— |
— |
— |
— |
— |
— |
9.4 |
(6.6–13.2) |
52 |
14,185 |
|
New Mexico |
6.8 |
(5.1–9.1) |
65 |
6,915 |
31.9 |
(26.1–38.3) |
102 |
12,711 |
14.9 |
(12.2–18.1) |
125 |
15,108 |
|
Oregon |
— |
— |
— |
— |
27.6 |
(20.9–35.4) |
70 |
29,062 |
17.2 |
(13.6–21.6) |
87 |
43,704 |
|
Utah |
— |
— |
— |
— |
28.4 |
(23.1–34.3) |
122 |
13,386 |
19.7 |
(16.1–23.8) |
163 |
21,445 |
|
Washington |
5.2 |
(4.3–6.3) |
152 |
22,249 |
33.6 |
(30.1–37.3) |
360 |
60,925 |
11.7 |
(10.3–13.3) |
305 |
50,145 |
|
Wyoming |
6.6 |
(4.9–8.9) |
52 |
2,096 |
29.1 |
(23.1–35.9) |
79 |
3,730 |
19.2 |
(15.6–23.5) |
112 |
6,074 |
|
Territories |
— |
— |
— |
— |
— |
— |
— |
— |
— |
— |
— |
— |
|
Guam |
— |
— |
— |
— |
— |
— |
— |
— |
— |
— |
— |
— |
|
Puerto Rico |
— |
— |
— |
— |
— |
— |
— |
— |
— |
— |
— |
— |
|
U.S. Virgin Islands |
— |
— |
— |
— |
— |
— |
— |
— |
— |
— |
— |
— |
|
Abbreviation: CI = confidence interval. * Data suppressed because the sample size of the numerator was <50 or the half-width of the confidence interval was >10. † For breast, cervical, and other female genital system cancers, prevalence estimates are for women only. For prostate cancer, prevalence estimates are for men only. |
||||||||||||
|
TABLE 5. (Continued) Quality of life indicators among cancer survivors aged ≥18 years, by geographic area — Behavioral Risk Factor Surveillance System, United States, 2009 |
||||||||
|---|---|---|---|---|---|---|---|---|
|
State/Area |
Always receive needed social or emotional support |
Satisfied or very satisfied with life |
||||||
|
% |
(95% CI) |
Sample size |
Weighted no. |
% |
(95% CI) |
Sample size |
Weighted no. |
|
|
United States |
50.2 |
(49.3–51.1) |
22,225 |
8,067,485 |
92.7 |
(92.2–93.1) |
42,114 |
14,886,915 |
|
Northeast |
47.4 |
(45.3–49.6) |
3,936 |
1,456,490 |
92.7 |
(91.6–93.7) |
7,655 |
2,847,895 |
|
Connecticut |
48.9 |
(43.9–53.9) |
348 |
97,221 |
93.8 |
(90.5–96.0) |
673 |
186,605 |
|
Maine |
47.9 |
(44.0–51.8) |
415 |
40,038 |
92.6 |
(90.3–94.4) |
843 |
77,374 |
|
Massachusetts |
48.7 |
(45.2–52.3) |
785 |
172,741 |
91.6 |
(89.6–93.2) |
1,479 |
324,596 |
|
New Hampshire |
48.2 |
(43.5–52.9) |
337 |
37,814 |
93.7 |
(91.6–95.3) |
660 |
73,519 |
|
New Jersey |
51.9 |
(48.1–55.7) |
608 |
225,508 |
92.5 |
(90.3–94.3) |
1,091 |
402,126 |
|
New York |
43.8 |
(38.9–48.8) |
321 |
475,481 |
92.9 |
(90.4–94.9) |
677 |
1,008,640 |
|
Pennsylvania |
48.8 |
(44.7–52.9) |
457 |
357,223 |
92.4 |
(90.0–94.2) |
914 |
676,435 |
|
Rhode Island |
49.6 |
(45.3–54.0) |
346 |
33,631 |
94.7 |
(92.7–96.2) |
678 |
64,178 |
|
Vermont |
46.0 |
(41.7–50.4) |
319 |
16,834 |
94.1 |
(92.1–95.7) |
640 |
34,421 |
|
Midwest |
49.9 |
(48.2–51.5) |
5,192 |
1,816,330 |
93.1 |
(92.1–93.9) |
10,096 |
3,389,553 |
|
Illinois |
49.3 |
(44.3–54.3) |
291 |
300,553 |
95.0 |
(91.3–97.2) |
558 |
579,096 |
|
Indiana |
48.7 |
(44.4–53.1) |
451 |
165,997 |
92.4 |
(89.9–94.3) |
875 |
314,660 |
|
Iowa |
48.1 |
(43.2–53.1) |
278 |
79,650 |
95.2 |
(93.2–96.7) |
570 |
157,567 |
|
Kansas |
47.8 |
(45.0–50.7) |
941 |
71,756 |
92.5 |
(90.5–94.0) |
1,833 |
138,781 |
|
Michigan |
46.8 |
(42.6–51.1) |
490 |
285,504 |
94.2 |
(92.4–95.5) |
1,005 |
574,020 |
|
Minnesota |
52.1 |
(47.0–57.1) |
285 |
128,779 |
95.4 |
(93.4–96.9) |
515 |
235,949 |
|
Missouri |
51.0 |
(45.3–56.6) |
290 |
181,640 |
91.2 |
(86.3–94.5) |
543 |
324,909 |
|
Nebraska |
48.3 |
(44.1–52.5) |
850 |
46,012 |
93.0 |
(90.3–95.0) |
1,700 |
88,625 |
|
North Dakota |
52.9 |
(47.0–58.7) |
218 |
17,216 |
95.8 |
(93.2–97.4) |
411 |
31,183 |
|
Ohio |
53.7 |
(49.9–57.6) |
530 |
350,474 |
90.8 |
(88.2–92.9) |
953 |
592,157 |
|
South Dakota |
46.1 |
(41.5–50.8) |
330 |
19,848 |
96.4 |
(94.4–97.6) |
692 |
41,458 |
|
Wisconsin |
49.7 |
(43.0–56.4) |
238 |
168,902 |
91.6 |
(87.0–94.6) |
441 |
311,147 |
|
South |
51.2 |
(49.6–52.7) |
7,254 |
3,081,401 |
92.3 |
(91.4–93.0) |
13,251 |
5,555,069 |
|
Alabama |
50.6 |
(44.9–56.2) |
365 |
146,424 |
90.0 |
(84.8–93.5) |
641 |
260,567 |
|
Arkansas |
45.2 |
(39.4–51.2) |
213 |
73,004 |
92.0 |
(88.5–94.6) |
420 |
148,533 |
|
Delaware |
53.4 |
(47.5–59.2) |
263 |
27,346 |
92.5 |
(89.2–94.8) |
441 |
47,370 |
|
District of Columbia |
36.4 |
(31.0–42.0) |
137 |
10,978 |
94.4 |
(91.3–96.5) |
367 |
28,512 |
|
Florida |
50.7 |
(46.4–54.9) |
753 |
622,791 |
91.8 |
(89.3–93.8) |
1,432 |
1,128,657 |
|
Georgia |
51.4 |
(45.2–57.6) |
301 |
235,669 |
94.9 |
(92.5–96.6) |
539 |
434,992 |
|
Kentucky |
49.4 |
(44.2–54.6) |
520 |
132,818 |
88.4 |
(83.0–92.2) |
968 |
237,716 |
|
Louisiana |
57.6 |
(53.3–61.8) |
506 |
137,421 |
91.6 |
(89.0–93.6) |
839 |
218,561 |
|
Maryland |
49.4 |
(44.9–53.9) |
452 |
145,959 |
92.5 |
(90.0–94.4) |
868 |
273,622 |
|
Mississippi |
54.1 |
(50.3–57.8) |
655 |
81,667 |
91.6 |
(89.0–93.6) |
1,121 |
138,323 |
|
North Carolina |
51.8 |
(47.7–55.8) |
738 |
264,924 |
92.5 |
(90.0–94.5) |
1,324 |
473,309 |
|
Oklahoma |
47.3 |
(43.3–51.3) |
420 |
99,022 |
90.3 |
(87.2–92.7) |
813 |
189,108 |
|
South Carolina |
43.2 |
(38.5–47.9) |
500 |
114,059 |
90.1 |
(86.3–92.9) |
989 |
238,159 |
|
Tennessee |
59.3 |
(53.8–64.6) |
322 |
174,870 |
92.0 |
(88.7–94.4) |
483 |
271,073 |
|
Texas |
52.0 |
(47.2–56.8) |
570 |
549,284 |
94.7 |
(92.3–96.3) |
1,068 |
999,678 |
|
Virginia |
51.4 |
(45.6–57.1) |
263 |
205,631 |
91.6 |
(87.6–94.4) |
479 |
366,526 |
|
West Virginia |
53.8 |
(48.8–58.6) |
276 |
59,534 |
90.7 |
(87.3–93.2) |
459 |
100,365 |
|
West |
51.0 |
(49.3–52.8) |
5,594 |
1,641,703 |
92.9 |
(91.9–93.8) |
10,702 |
2,987,307 |
|
Alaska |
59.8 |
(50.0–68.9) |
97 |
18,968 |
94.9 |
(88.9–97.7) |
178 |
30,085 |
|
Arizona |
51.1 |
(45.1–57.1) |
343 |
187,457 |
92.9 |
(89.5–95.3) |
628 |
340,720 |
|
California |
51.4 |
(47.8–54.9) |
685 |
680,797 |
93.4 |
(91.4–94.9) |
1,321 |
1,236,966 |
|
Colorado |
48.6 |
(44.9–52.2) |
531 |
104,409 |
92.1 |
(89.8–93.9) |
1,054 |
198,015 |
|
Hawaii |
50.1 |
(44.7–55.5) |
294 |
31,817 |
94.3 |
(91.5–96.2) |
565 |
59,892 |
|
Idaho |
50.1 |
(44.8–55.3) |
276 |
39,636 |
93.5 |
(90.2–95.7) |
531 |
73,987 |
|
Montana |
47.7 |
(43.1–52.3) |
387 |
28,486 |
92.0 |
(89.3–94.0) |
785 |
54,928 |
|
Nevada |
57.2 |
(49.9–64.3) |
214 |
86,617 |
88.6 |
(79.9–93.8) |
399 |
134,101 |
|
New Mexico |
46.2 |
(42.1–50.3) |
408 |
46,697 |
91.0 |
(88.4–93.1) |
811 |
92,021 |
|
Oregon |
50.7 |
(44.9–56.5) |
284 |
128,699 |
93.9 |
(89.9–96.4) |
517 |
238,299 |
|
Utah |
55.6 |
(51.2–59.9) |
451 |
60,606 |
92.5 |
(90.1–94.3) |
821 |
100,839 |
|
Washington |
49.1 |
(46.5–51.8) |
1,273 |
210,343 |
92.7 |
(91.3–94.0) |
2,442 |
397,249 |
|
Wyoming |
54.4 |
(49.8–58.9) |
351 |
17,171 |
95.6 |
(93.6–97.1) |
650 |
30,206 |
|
Abbreviation: CI = confidence interval. * Data suppressed because the sample size of the numerator was <50 or the half-width of the confidence interval was >10. |
||||||||
|
TABLE 7. (Continued) Health care experience* among cancer survivors aged ≥18 years (N = 5,593) — Behavioral Risk Factor Surveillance System, 10 states, 2009 |
||||||||
|---|---|---|---|---|---|---|---|---|
|
State |
Insurance covered all or part of cancer treatment |
Ever denied health insurance or life insurance coverage because of cancer |
||||||
|
% |
(95% CI) |
Sample size |
Weighted no. |
% |
(95% CI) |
Sample size |
Weighted no. |
|
|
Total |
90.7 |
(88.9–92.2) |
5,130 |
2,984,587 |
12.0 |
(9.9–14.4) |
489 |
393,340 |
|
California |
91.2 |
(86.3–94.4) |
364 |
980,237 |
— |
— |
— |
— |
|
Connecticut |
95.5 |
(92.2–97.5) |
597 |
168,553 |
— |
— |
— |
— |
|
Maryland |
88.9 |
(82.7–93.0) |
341 |
218,359 |
— |
— |
— |
— |
|
Massachusetts |
90.6 |
(85.9–93.8) |
428 |
271,395 |
— |
— |
— |
— |
|
Nebraska |
90.9 |
(85.2–94.6) |
479 |
73,554 |
— |
— |
— |
— |
|
New Jersey |
91.8 |
(87.5–94.6) |
471 |
352,611 |
— |
— |
— |
— |
|
North Carolina |
89.7 |
(86.5–92.3) |
1,133 |
403,371 |
— |
— |
— |
— |
|
Oklahoma |
85.7 |
(77.7–91.1) |
337 |
172,682 |
— |
— |
— |
— |
|
Vermont |
91.9 |
(88.6–94.3) |
576 |
30,087 |
— |
— |
— |
— |
|
Virginia |
90.9 |
(86.3–94.1) |
404 |
313,738 |
— |
— |
— |
— |
|
Abbreviation: CI = confidence interval. * Only includes cancer survivors not currently undergoing treatment (n = 5,593). † Cancer specialists include cancer surgeons, gynecologic oncologists, medical oncologists, and radiation oncologists. § Data suppressed because the sample size of the numerator was <50 or the half-width of the confidence interval was >10. |
||||||||
FIGURE 1. Prevalence of current cigarette smoking among cancer survivors aged ≥18 years — Behavioral Risk Factor Surveillance System, United States, 2009
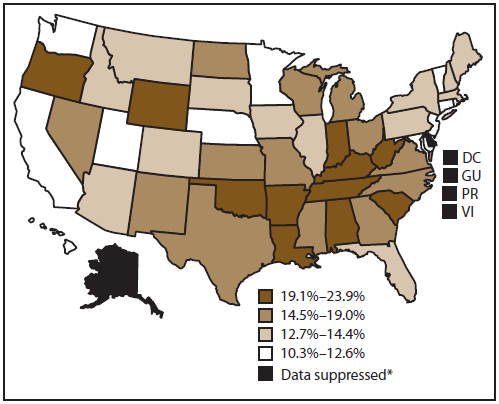
Abbreviations: GU = Guam; PR = Puerto Rico; VI = US Virgin Islands.
* The sample size of the numerator was <50 or the half-width of the confidence interval was >10.
Alternate Text: This figure is a U.S. map showing the prevalence of current cigarette smoking among cancer survivors aged =18 years. Approximately 15.1% of cancer survivors aged =18 years in the 50 states and DC were current cigarette smokers. Smoking prevalence among cancer survivors was highest in Oklahoma (23.9%) and lowest in California (10.3%). Regional differences also were observed, with the highest prevalence in the South (17.2%), followed by the Midwest (15.8%), Northeast (15.1%), and West (13.0%). Data are not shown for the District of Columbia, Guam, Puerto Rico, or the US Virgin Islands; these data were suppressed because the sample size of the numerator was <50 or the half-width of the confidence interval was >10.
FIGURE 2. Prevalence of obesity* among cancer survivors aged ≥18 years — Behavioral Risk Factor Surveillance System, United States, 2009
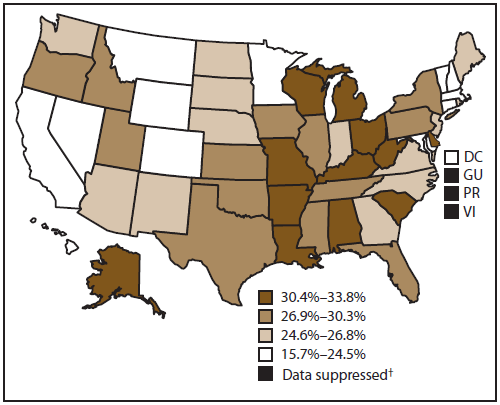
Abbreviations: GU = Guam; PR = Puerto Rico; VI = US Virgin Islands.
* Body mass index ≥30 kg/m2.
† The sample size of the numerator was <50 or the half-width of the confidence interval was >10.
Alternate Text: This figure is a U.S. map showing the prevalence of obesity among cancer survivors aged =18 years. A total of 27.5% of cancer survivors were obese (body mass index =30 kg/m2); however, the prevalence varied widely by state, ranging from 15.7% in Colorado to 33.8% in Missouri. Obesity prevalence among cancer survivors varied by geographic region. Obesity was most prevalent among cancer survivors in the Midwest (29.8%), followed by the South (28.4%), Northeast (26.0%), and West (24.5%). Data are not shown for Guam, Puerto Rico, or the US Virgin Islands; these data were suppressed because the sample size of the numerator was <50 or the half-width of the confidence interval was >10.
FIGURE 3. Prevalence of cancer survivors aged ≥18 years reporting no leisure-time physical activity during the past 30 days — Behavioral Risk Factor Surveillance System, United States, 2009
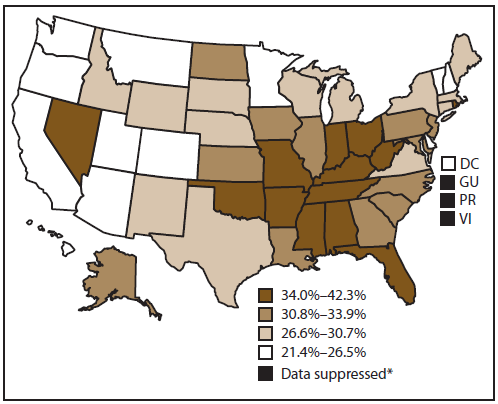
Abbreviations: GU = Guam; PR = Puerto Rico; VI = US Virgin Islands.
* The sample size of the numerator was <50 or the half-width of the confidence interval was >10.
Alternate Text: This figure is a U.S. map showing the prevalence of cancer survivors aged =18 years reporting no leisure-time physical activity during the past 30 days. Approximately 31.5% of cancer survivors had not participated in any leisure-time physical activity during the past 30 days. The highest proportion of cancer survivors reporting no leisure-time physical activity lived in the South (34.3%), followed by the Midwest (32.5%), Northeast (31.3%), and West (25.5%). Among states, percentages of inactivity were highest in West Virginia (42.3%) and lowest in Oregon (21.4%). Data are not shown for Guam, Puerto Rico, or the US Virgin Islands; these data were suppressed because the sample size of the numerator was <50 or the half-width of the confidence interval was >10.
Use of trade names and commercial sources is for identification only and does not imply endorsement by the U.S. Department of Health and Human Services. |
All MMWR HTML versions of articles are electronic conversions from typeset documents. This conversion might result in character translation or format errors in the HTML version. Users are referred to the electronic PDF version (http://www.cdc.gov/mmwr) and/or the original MMWR paper copy for printable versions of official text, figures, and tables. An original paper copy of this issue can be obtained from the Superintendent of Documents, U.S. Government Printing Office (GPO), Washington, DC 20402-9371; telephone: (202) 512-1800. Contact GPO for current prices.
**Questions or messages regarding errors in formatting should be addressed to mmwrq@cdc.gov.
