Persons using assistive technology might not be able to fully access information in this file. For assistance, please send e-mail to: mmwrq@cdc.gov. Type 508 Accommodation and the title of the report in the subject line of e-mail.
Abortion Surveillance --- United States, 2007
Please note: An erratum has been published for this article. To view the erratum, please click here.
Corresponding address: CDC, National Center for Chronic Disease Prevention and Health Promotion, Division of Reproductive Health, 1600 Clifton Rd., NE, MS K-21, Atlanta, GA 30333. E-mail: cdcinfo@cdc.gov.
Abstract
Problem/Condition: Since 1969, CDC has conducted abortion surveillance to document the number and characteristics of women obtaining legal induced abortions in the United States.
Reporting Period Covered: 2007.
Description of System: Each year, CDC requests abortion data from the central health agencies of 52 reporting areas (the 50 states, the District of Columbia, and New York City). This information is provided voluntarily. For 2007, data were received from 49 reporting areas. For the purpose of trend analysis, data were evaluated from the 45 areas that reported data every year during the preceding decade (1998--2007). Abortion rates (number of abortions per 1,000 women) and ratios (number of abortions per 1,000 live births) were calculated using census and natality data, respectively.
Results: A total of 827,609 abortions were reported to CDC for 2007. Among the 45 reporting areas that provided data every year during 1998--2007, a total of 810,582 abortions (97.9% of the total) were reported for 2007; the abortion rate was 16.0 abortions per 1,000 women aged 15--44 years, and the abortion ratio was 231 abortions per 1,000 live births. Compared with 2006, the total number and rate of reported abortions decreased 2%, and the abortion ratio decreased 3%. Reported abortion numbers, rates, and ratios were 6%, 7%, and 14% lower, respectively, in 2007 than in 1998.
Women aged 20--29 years accounted for 56.9% of all abortions in 2007 and for the majority of abortions during the entire period of analysis (1998--2007). In 2007, women aged 20--29 years also had the highest abortion rates (29.4 abortions per 1,000 women aged 20--24 years and 21.4 abortions per 1,000 women aged 25--29 years). Adolescents aged 15--19 years accounted for 16.5% of all abortions in 2007 and had an abortion rate of 14.5 abortions per 1,000 adolescents aged 15--19 years; women aged ≥35 years accounted for a smaller percentage (12.0%) of abortions and had lower abortion rates (7.7 abortions per 1,000 women aged 35--39 years and 2.6 abortions per 1,000 women aged ≥40 years). During 1998--2007, the abortion rate increased among women aged ≥35 years but decreased among adolescents aged ≤19 years and among women aged 20--29 years.
In contrast to the percentage distribution of abortions and abortion rates, abortion ratios were highest at the extremes of reproductive age, both in 2007 and throughout the entire period of analysis. During 1998--2007 abortion ratios decreased among women in all age groups except for those aged <15 years.
In 2007, most (62.3%) abortions were performed at ≤8 weeks' gestation, and 91.5% were performed at ≤13 weeks' gestation. Few abortions (7.2%) were performed at 14--20 weeks' gestation, and 1.3% were performed at ≥21 weeks' gestation. During 1998--2007, the percentage of abortions performed at ≤13 weeks' gestation remained stable; however, abortions performed at ≥16 weeks' gestation decreased by 13%--14%, and among the abortions performed at ≤13 weeks' gestation, the percentage performed at ≤6 weeks' gestation increased 65%.
In 2007, 78.1% of abortions were performed by curettage at ≤13 weeks' gestation, and 13.1% were performed by early medical abortion (a nonsurgical abortion at ≤8 weeks' gestation); 7.9% of abortions were performed by curettage at >13 weeks' gestation. Among the 62.3% of abortions that were performed at ≤8 weeks' gestation, and thus were eligible for early medical abortion, 20.3% were completed by this method.
Deaths of women associated with complications from abortions for 2007 are being investigated under CDC's Pregnancy Mortality Surveillance System. In 2006, the most recent year for which data were available, six women were reported to have died as a result of complications from known legal induced abortions. No reported deaths were associated with known illegal induced abortions.
Interpretation: Among the 45 areas that reported data every year during 1998--2007, the total number, rate, and ratio of reported abortions decreased during 2006--2007. This decrease reversed the increase in reported abortion numbers and rates that occurred during 2005--2006; however, reported abortion numbers and rates for 2007 still were higher than they had been previously in 2005. In 2006, as in previous years, reported deaths related to abortion were rare.
Public Health Action: Abortion surveillance in the United States continues to provide the data needed to examine trends in the number and characteristics of women obtaining abortions. Policymakers and program planners can use these data to guide and evaluate efforts to prevent unintended pregnancies.
Introduction
This report is based on abortion data for 2007 that were provided voluntarily to CDC by the central health agencies of 49 reporting areas (the District of Columbia; New York City; and 47 states, excluding California, Maryland, and New Hampshire). Since 1969, CDC has conducted abortion surveillance to document the number and characteristics of women obtaining legal induced abortions in the United States (1). Following nationwide legalization of abortion in 1973, the total number, rate (the number of abortions per 1,000 women aged 15--44 years), and ratio (the number of abortions per 1,000 live births) of reported abortions increased rapidly, reaching their highest levels in the 1980s before decreasing at a slow yet steady pace (2--6). However, the incidence of abortion has varied considerably across demographic subpopulations (7--10), and recent reports have suggested that the sustained pattern of decline might have leveled off (11,12). Continued surveillance is needed to monitor long-term changes in the overall incidence of abortion procedures and to guide and evaluate programs for preventing unintended pregnancy in the United States.
Methods
Description of the Surveillance System
Each year, CDC requests tabulated data from the central health agencies of 52 reporting areas (the 50 states, the District of Columbia, and New York City) to document the number and characteristics of women obtaining abortions in the United States. For the purpose of surveillance, a legal induced abortion is defined as a procedure performed by a licensed physician, or an appropriately licensed advanced practice clinician acting under the supervision of a licensed physician, that is intended to terminate a suspected or known intrauterine pregnancy and produce a nonviable fetus at any gestational age (13).*
In most states, collection of abortion data is facilitated by the legal requirement for hospitals, facilities, and physicians to report abortions to a central health agency (14). These central health agencies voluntarily provide CDC the aggregate numbers for the abortion data they have collected (15).
Most reporting areas do report aggregate abortion numbers in response to the CDC annual request: during 1998--2007, a total of 45 reporting areas provided CDC a continuous annual record of abortion numbers,† and in 2007, CDC obtained aggregate abortion numbers from 49 reporting areas.§ However, the level of detail that CDC receives on the characteristics of women obtaining abortions varies considerably from year to year and among reporting areas. To encourage more uniform collection of these details, CDC has developed a standard reporting form (16). However, because no federal mandate requires the collection of abortion data, reporting areas can develop their own forms and might not collect all the information requested by CDC.
Variables and Categorization of Data
Each year, CDC sends suggested templates to the central health agencies for them to compile their abortion data in aggregate. Aggregate abortion numbers, rather than individual-level records, are requested for the following variables:
- Age in years of the woman (<15, 15--19 by individual year, 20--24, 25--29, 30--34, 35--39, ≥40);
- Gestational age in weeks at the time of abortion (≤6, 7--20 by individual week, ≥21);
- Race (black, white, Asian, Native Hawaiian/Pacific Islander, or American Indian/Alaska Native);
- Ethnicity (Hispanic or non-Hispanic);
- Method used (curettage,¶ intrauterine instillation, medical [nonsurgical] abortion, or other**);
- Marital status (married, including currently married or separated; unmarried, including never married, widowed, or divorced);
- Number of previous live births (0, 1, 2, 3, or ≥4);
- Number of previous abortions (0, 1, 2, or ≥3); and
- Location of residence (the state, territory, reporting area, or foreign country in which the woman obtaining the abortion lived, or if additional details are unavailable, in reporting area vs. out of reporting area).
In addition to sending templates for compiling information on race and ethnicity as separate variables, CDC has provided alternative templates since 2001 for the tabulation of aggregate cross-classified race/ethnicity data. Because few reporting areas returned these alternative templates in the past, 2007 is the first year for which CDC has had sufficient data to report results by these cross-classified race/ethnicity categories (non-Hispanic white, non-Hispanic black, non-Hispanic other, and Hispanic).
Finally, both the original and alternative templates that CDC provides request that aggregate numbers for certain individual variables be cross-tabulated by a second variable. These cross-tabulations include gestational age (for age; method type; and race, ethnicity, and race/ethnicity) and age and marital status (for race, ethnicity, and race/ethnicity).
In this report, medical abortions and abortions performed by curettage are further categorized by gestational age (17). For medical abortion, early medical abortion is defined as the administration of medication or medications (typically mifepristone followed by misoprostol) to induce an abortion at ≤8 weeks' gestation,†† and medical abortion at >8 weeks' gestation is defined as the administration of medication or medications (typically vaginal prostaglandins) to induce an abortion at >8 weeks' gestation. For curettage, abortions are categorized as having been performed at ≤13 weeks' gestation or at >13 weeks' gestation because of differences in technique (17). Finally, because intrauterine instillations cannot be performed early in gestation, abortions reported to have been performed by intrauterine installation at ≤12 weeks' gestation are excluded from calculation of the percentage of abortions by known method type.§§
Measures of Abortion
Four measures of abortion are presented in this report: 1) the total number of abortions in a given population, 2) the percentage of abortions obtained within a given subpopulation, 3) the abortion rate (number of abortions per 1,000 women aged 15--44 years or other specific age group within a given population), and 4) the abortion ratio (number of abortions per 1,000 live births within a given population). Although total numbers and percentages are useful measures for determining how many women have obtained an abortion, abortion rates adjust for differences in subpopulation size and reflect how likely abortion is among women in particular groups. Abortion ratios reflect the relative number of pregnancies in a population that end in abortion compared with live birth; abortion ratios change both according to the proportion of pregnancies in a population that are unintended and the proportion of unintended pregnancies that are continued. Abortion ratios also are influenced by the proportion of intended pregnancies that are terminated; however, intended pregnancies are estimated to account for only 4% of all abortions (21).
For the calculation of abortion ratios, data were obtained from CDC natality files (22). U.S. Census Bureau estimates of the resident female population of the United States, compiled by CDC (23--31), were used to calculate abortion rates. Overall abortion rates were calculated from the population of women aged 15--44 years. However, because 94.0% of abortions among adolescents aged <15 years occurred among adolescents aged 13--14 years (as measured in 1988, the last year that CDC enumerated abortions for this age group by individual year) (32), the population of adolescents aged 13--14 years was used as the denominator for this youngest group. Similarly, for women aged ≥40 years, abortion rates were based on the number of women aged 40--44 years.
Data Presentation and Analysis
This report provides state-specific and overall abortion numbers, rates, and ratios for the 49 areas that reported to CDC for 2007 (excludes California, Maryland, and New Hampshire). In addition, this report describes the characteristics of women who obtained abortions in 2007. However, because the completeness of reporting on the characteristics of women varies by year and by variable, this report only describes the characteristics of women from areas that met reporting standards (i.e., with data categorized in accordance with surveillance variables and with <15% unknown values for a given characteristic). For state-specific results, cell values from 1 to 4 have been suppressed to maintain confidentiality. In addition, abortion rates and ratios were not calculated for groups with <20 abortions because results are considered unreliable.
Most of the data in this report are presented by the reporting area in which the abortions were performed. In addition, 48 reporting areas¶¶ provided the number of abortions by the reporting area in which women lived. However, three of these states (Delaware, Illinois, and Wisconsin) reported characteristics for in-state residents but not for out-of-state residents. Six other states (Arizona, Iowa, Kentucky, Louisiana, Massachusetts, and Rhode Island) provided only the total number of abortions for out-of-state residents without specifying individual states or areas of residence. As a result, abortion statistics presented in this report by reporting area of residence are minimum estimates. These estimates might be disproportionately low for reporting areas from which many women travel to another state to receive abortion services if they go to states with incomplete residence reporting.
For the purpose of evaluating trends in the total number, rate, and ratio of reported abortions, annual statistics are reported for 1998--2007, and in each case the percentage change from 1998 to 2007 and from 2006 to 2007 has been calculated. Only the 45 reporting areas that provided data every year during the entire period were included. Similarly, annual statistics are presented for 1998--2007 for certain variables (abortions by maternal age, gestational age, race, and ethnicity), with reporting areas included only if they provided data that met reporting standards every year. For other variables (marital status, number of previous abortions, and number of previous births), data are reported only for 1998, 2006, and 2007, and reporting areas are included if they reported all 3 years. To evaluate trends in the use of different abortion procedures, reporting areas were included only if they provided complete data and specifically included medical abortion as a method on their reporting form. Approval of mifepristone for medical abortion was granted by the Food and Drug Administration (FDA) in September 2000 (33); 2001 was the first complete year during which early medical abortion was available in the United States. Therefore, comparisons have been made between 2001 and 2007 and between 2006 and 2007.
Because certain areas that reported in 2007 were not included in some or all of the trend analyses, summary measures for comparisons over time might differ slightly from the point estimates presented for all areas that reported in 2007.
Abortion Mortality
CDC has reported data on abortion-related deaths periodically since information on abortion mortality first was included in the 1972 abortion surveillance report (12,34). An abortion-related death is defined as a death resulting from a direct complication of an abortion (legal or illegal), an indirect complication caused by a chain of events initiated by an abortion, or aggravation of a preexisting condition by the physiologic or psychologic effects of abortion (35). An abortion is defined as "legal" if it is performed by a licensed physician or an appropriately licensed advanced practice clinician acting under the supervision of a licensed physician; an abortion is defined as "illegal" if it is performed by any other person. All deaths determined to be related causally to induced abortion have been classified as abortion related regardless of the time between the abortion and death.
Since 1987, CDC has monitored abortion-related deaths through its Pregnancy Mortality Surveillance System (PMSS) (36). Additional sources of data for abortion-related deaths include state vital records, public health agencies, maternal mortality review committees, health-care providers, private citizens and citizen groups, and media reports, including computerized searches of full-text newspaper and other print media databases. For each death that possibly is related to abortion, CDC requests clinical records and autopsy reports. Two clinical epidemiologists review these reports to determine the cause of death and whether the death was abortion related. Each abortion-related death then is categorized by abortion type as legal induced, illegal induced, spontaneous, or unknown type. This report provides data on abortion-related deaths that occurred during 1972--2006; data for 2006 have not been published previously and are the most recent data available. Possible abortion-related deaths that occurred during 2007--2010 are under investigation. Although national case-fatality rates (the number of abortion-related deaths per 100,000 reported legal induced abortions) have been published for 1972--1997, this measure could not be calculated for 1998--2006 with CDC data because a substantial number of abortions have been documented in states that did not report to CDC (3,37), and thus the total number of abortions was not available as the rate denominator.
Results
U.S. Totals
Among the 49 reporting areas that provided data for 2007,*** a total of 827,609 abortions were reported. For the 45 reporting areas that provided data every year during 1998--2007,††† a total of 810,582 abortions (97.9% of the total) were reported for 2007; among these 45 consistently reporting areas, the abortion rate was 16.0 abortions per 1,000 women aged 15--44 years, and the abortion ratio was 231 abortions per 1,000 live births (Table 1). Compared with 2006, the total number and rate of reported abortions in 2007 was 2% lower and the abortion ratio was 3% lower. However, given the increase in the number and rate of abortions that occurred during 2005--2006, these measures still were higher in 2007 than they had been in 2005. Nonetheless, compared with 1998, the total number, rate, and ratio of reported abortions in 2007 were 6%, 7%, and 14% lower, respectively (Figure 1).
Occurrence and Residence
Total abortion numbers, rates, and ratios have been calculated by individual reporting area of occurrence and the residence status of the women who obtained the procedures (Table 2). By reporting area of occurrence, a considerable range existed in the total number of reported abortions, ranging from nine (Wyoming) to 91,954 (Florida); in the abortion rate, ranging from 4.6 (South Dakota) to 48.3 (New York City) abortions per 1,000 women§§§; and in the abortion ratio, ranging from 58 (Idaho and South Dakota) to 737 (New York City) abortions per 1,000 live births.¶¶¶ Similarly, a considerable range existed by residence status**** in the total number of reported abortions, ranging from 833 (South Dakota) to 83,326 (New York City); in the abortion rate, ranging from 5.4 (South Dakota) to 44.3 (New York City) abortions per 1,000 women; and in the abortion ratio, ranging from 67 (Utah) to 676 (New York City) abortions per 1,000 live births. Given the substantial variation that also occurred among reporting areas in the percentage of abortions obtained by out-of-state residents, ranging from none (Alaska) to 53.5% (District of Columbia), abortion rates and ratios calculated by residence status might provide a more accurate reflection of population trends. However, these measures must be viewed with caution because of the variation across reporting areas in methods used to record residence status and the resulting 12.6% of abortions reported without a state, territory, reporting area, or country of residence.
Age
Among the 48 areas that reported by age for 2007, women aged 20--29 years accounted for the majority (56.9%) of abortions and had the highest abortion rates (29.4 and 21.4 abortions per 1,000 women aged 20--24 and 25--29 years, respectively) (Figure 2; Table 3). Women in the youngest and oldest age groups (<15 or ≥40 years) accounted for the smallest percentage of abortions (0.5% and 3.2%, respectively) and had the lowest abortion rates (1.2 and 2.6 abortions per 1,000 women aged <15 and ≥40 years, respectively). Among the 44 reporting areas that provided data every year during 1998--2007, this pattern across age groups was stable, with the majority of abortions and the highest abortion rates occurring among women in their 20s and the lowest percentage of abortions and abortion rates occurring among women in the youngest and oldest age groups (Table 4). However, during 1998--2007, the abortion rate and percentage of abortions accounted for by women in the youngest age groups decreased, and the abortion rate and percentage of abortions accounted for by older women increased. From 2006 to 2007, abortion rates decreased among women aged 15--39 years; however, given the increase that occurred during 2005--2006, abortion rates still were higher in 2007 than they had been in 2005 for all women in this age range, except for adolescents aged 15--19 years, among whom a 1% decrease occurred.
In contrast to the percentage distribution of abortion numbers and abortion rates, abortion ratios for 2007 were highest at the extremes of reproductive age (Figure 2; Table 3). During 2006--2007, abortion ratios decreased among all women aged >15 years. Moreover, because abortion ratios had decreased or had increased only slightly during 2005--2006 for all women in this age range, abortion ratios were lower in 2007 than they had been in 2005. During 1998--2007, abortion ratios decreased 13%--19% for all women aged >15 years (Table 4).
Adolescents
Among the 46 areas that reported age by individual year among adolescents for 2007, adolescents aged ≤19 years accounted for 115,209 abortions (Table 5). The adolescent abortion rate was 10.7 abortions per 1,000 adolescents aged ≤19 years, and the adolescent abortion ratio was 337 abortions per 1,000 live births. Adolescents aged 18--19 years accounted for the majority (62.3%) of adolescent abortions and had the highest adolescent abortion rates (21.2 and 25.8 abortions per 1,000 adolescents aged 18 and 19 years, respectively). Adolescents aged <15 years accounted for the smallest percentage of adolescent abortions (3.1%) and had the lowest adolescent abortion rate (1.2 abortions per 1,000 adolescents). Among the 41 reporting areas that provided data every year during 1998--2007, this pattern across age groups was stable, with older adolescents accounting for a larger percentage of adolescent abortions and having higher abortion rates (Table 6); nonetheless, differences across adolescent age groups were larger in 2007 than in 1998. For abortion rates, a decrease occurred among all adolescents aged >15 years during 2006--2007. However, although 2007 abortion rates decreased below 2005 rates for adolescents aged 15--17 years, because of the increase among adolescents aged 18--19 years that had occurred during 2005--2006, the 2007 abortion rates among these older adolescents were essentially unchanged from 2005.
Adolescent abortion ratios for 2007 generally decreased with age and were lowest among adolescents aged 19 years (Table 5). Among the 41 reporting areas that provided data for every year during the preceding decade, the difference in abortion ratios between younger and older adolescents increased during 1998--2007, with a comparatively large decrease among adolescents aged 18--19 years (Table 6). During 2006--2007 abortion ratios decreased for all adolescents aged ≥15 years, and because they also had decreased during 2005--2006, abortion ratios for adolescents in this age range were 4%--7% lower in 2007 than they had been previously in 2005.
Gestational Age
Among women from the 42 areas that reported gestational age at the time of abortion for 2007 (Table 7), the majority (62.3%) of abortions were obtained at ≤8 weeks' gestation, and 91.5% were obtained at ≤13 weeks' gestation. A total of 7.2% of abortions were obtained at 14--20 weeks' gestation, and 1.3% were obtained at ≥21 weeks' gestation. Among the 34 reporting areas that provided data on gestational age every year during 1998--2007 (Table 8), the percentage of abortions obtained at ≤13 weeks' gestation was stable but shifted toward earlier gestational ages: abortions performed at ≤8 weeks' gestation increased 14.0%, whereas abortions performed at 9--13 weeks' gestation decreased 19.5%. Throughout 1998--2007, the percentage of abortions performed at >13 weeks' gestation was low (<10%), and abortions performed at ≥16 weeks' gestation decreased by 13%--14%.
In the 42 reporting areas that provided the exact week of gestational age in 2007 for abortions at ≤13 weeks' gestation, 33.0% were performed at ≤6 weeks' gestation, and 35.1% were performed at 7--8 weeks' gestation, for a total of 68.1% at ≤8 weeks' gestation (Table 9). Among the remaining abortions at ≤13 weeks' gestation, the percentage contribution was progressively lower for each additional week of gestation: 10.8% of abortions at ≤13 weeks were reported at 9 weeks' gestation, whereas 3.2% were reported at 13 weeks' gestation. Among the 34 areas that reported by the exact week of gestational age for every year during 1998--2007, the percentage of procedures shifted toward earlier gestational ages: procedures performed at ≤6 weeks' gestation increased 65%, whereas the percentage performed at 8--13 weeks' gestation decreased (Table 10).
Procedure Type
Among the 38 areas that reported by procedure type and included medical abortion on the reporting form distributed to medical providers for 2007, 78.1% of abortions were performed by curettage at ≤13 weeks' gestation, and 13.1% were performed by early medical (nonsurgical) abortion; 7.9% were performed by curettage at >13 weeks' gestation, and all other procedures were uncommon (Table 11). Among the 28 reporting areas that included medical abortion on their reporting form and provided this data for all 3 years of comparison (2001, the first full year following FDA approval of mifepristone for use in early medical abortion, as well as 2006 and 2007),†††† the use of early medical abortion increased 12% from 2006 and 243% from 2001 (from 3.5% of abortions in 2001 to 10.7% in 2006 and 12.0% in 2007). In contrast, the use of curettage at ≤13 weeks' gestation decreased 1% from 2006 and 9% from 2001 (from 87.2% of abortions in 2001 to 80.2% in 2006 and 79.0% in 2007). The use of curettage at >13 weeks' gestation remained essentially unchanged (accounting for 8.5% of abortions in 2001 and 8.3% in 2006 and 2007). All other methods accounted for a consistently small percentage of abortions (0.1%--0.7%).
Race
Among women from the 37 areas that reported race for 2007, white women (including Hispanic and non-Hispanic white women) accounted for the largest percentage (55.9%) of abortions; black women accounted for 36.5% and women of other racial groups for 7.6% of abortions (Table 12). Black women had higher abortion rates and ratios than white women and women of other races (Table 12). Among the 27 reporting areas that provided data every year during 1998--2007, the percentage distribution of abortions by race changed little; although abortions among women in the other racial category increased, the percentage remained low (Table 13). Abortion rates decreased during 2006--2007 among women from all racial groups, continuing the long-term decrease during 1998--2007 that had been interrupted by a 1-year increase during 2005--2006. However, because the increase in abortion rates during 2005--2006 had been much greater for white women (4%) than for black women (1%), the abortion rate was 2% higher for white women in 2007 than it had been in 2005 but 1% lower than it had been for black women. Abortion ratios also decreased during 2006--2007 among women from all racial groups, with a larger cumulative decrease during 2005--2007 among black women (7%) compared with white women (2%) (Table 13).
Race/Ethnicity
Among women from the 25 areas that reported cross-classified race/ethnicity data for 2007 (Table 14), non-Hispanic white women accounted for the largest percentage of abortions (37.1%), followed by non-Hispanic black women (34.4%), Hispanic women (22.1%), and non-Hispanic women of other races (6.4%). Non-Hispanic white women had the lowest abortion rates (8.5 abortions per 1,000 women aged 15--44 years) and ratios (144 abortions per 1,000 live births); in contrast, non-Hispanic black women had the highest abortion rates (32.1 abortions per 1,000 women aged 15--44 years) and ratios (480 abortions per 1,000 live births). Hispanic women had intermediate abortion rates and ratios; however, although Hispanic women had abortion rates that were 125% higher than non-Hispanic white women, their abortion ratios were only 34% higher. Because 2007 is the first year for which cross-classified race/ethnicity data have been compiled, trends over time could not be evaluated.
Ethnicity
Among the 33 areas that reported ethnicity for 2007, Hispanic women accounted for 19.8% of all abortions and had an abortion rate of 20.5 abortions per 1,000 Hispanic women; they had an abortion ratio of 193 abortions per 1,000 live births to Hispanic women (Table 15). These results are similar to those for Hispanic women who obtained abortions in the 25 reporting areas that provided cross-classified race/ethnicity data (Table 14). Among the 18 reporting areas that provided ethnicity data every year during 1998--2007, the percentage of abortions accounted for by Hispanic women increased 18% (Table 16). In contrast, during 2006--2007, abortion rates and ratios among Hispanic women decreased, continuing the pattern observed during 1998--2007, when the decrease in abortion rates and ratios was greater for Hispanic women than for non-Hispanic women of white, black, and other racial groups combined (Table 16).
Marital Status
Among the 41 areas that reported marital status for 2007, 83.7% of all women obtaining abortions were unmarried, and 16.3% were married (Table 17). For the 35 reporting areas that provided these data for 1998, 2006, and 2007, §§§§ unmarried women accounted for a slightly higher percentage of abortions in 2007 (83.8%) than in 1998 (81.1%); the percentage was unchanged from 2006.
Previous Live Births and Abortions
Among the 41 areas that reported the number of previous live births for 2007, 41.4%, 26.3%, and 32.3% of all women who obtained abortions had previously had zero, one, or two or more live births, respectively (Table 18). Among the 36 reporting areas that provided these data for 1998, 2006, and 2007, ¶¶¶¶ the change in the distribution of women obtaining abortions by the number of previous live births was minimal (zero previous births: 40.9% in 1998 vs. 41.4% in 2007; one previous birth: 27.9% in 1998 vs. 26.4% in 2007; two or more previous births: 31.2% in 1998 vs. 32.2% in 2007).
Among the 41 areas that reported the number of previous abortions for 2007, the majority of women (55.9%) who obtained abortions had not previously had an abortion; 25.1% and 19.0%, respectively, had previously had either one abortion or two or more abortions (Table 19). Among the 33 reporting areas that provided data in 1998, 2006, and 2007, ***** the percentage of women who had obtained no previous abortions increased 4% (from 53.8% in 1998 to 55.9% in 2007), whereas the percentage of women who had obtained one previous abortion decreased 8% (from 26.9% in 1998 to 24.9% in 2007); the percentage of women who had obtained two or more previous abortions was stable (19.3% in 1998 vs. 19.2% in 2007).
Age and Marital Status by Race and Race/Ethnicity
In some reporting areas, women of each racial and racial/ethnic group were classified further by age and marital status (Tables 20 and 21). By age, a consistent pattern existed across all racial and racial/ethnic groups: the smallest percentage of abortions occurred among adolescents aged <15 years (0.2%--0.7%), and the largest percentage occurred among women aged 20--24 years (26.3%--33.8%). By marital status, a consistent pattern also existed across all racial and racial/ethnic groups, with a higher percentage of abortions occurring among women who were unmarried (64.5%--89.5%) compared with those who were married (10.5%--35.5%).
Weeks of Gestation by Age, Race, Race/Ethnicity, and Type of Procedure
In some reporting areas, women who obtained abortions at different gestational ages were categorized further by age, race, and race/ethnicity (Tables 22 and 23). In every subgroup for these three variables, the largest percentage of abortions was obtained at ≤8 weeks' gestation. However, whereas 44.4% of adolescents aged <15 years and 52.5% adolescents aged 15--19 years obtained an abortion by ≤8 weeks' gestation, 60.7%--70.9% of adult women aged ≥20 years obtained an abortion by this point in gestation (Figure 3; Table 22). Conversely, 19.6% of adolescents aged <15 years and 12.1% of adolescents 15--19 years obtained an abortion after 13 weeks' gestation, whereas this percentage ranged from 6.7%--8.6% for adult women. By race/ethnicity, 58.9% of non-Hispanic black women obtained an abortion by ≤8 weeks' gestation, whereas 65.7%--69.8% of women from other racial/ethnic groups obtained an abortion by this point in gestation. Non-Hispanic black women also obtained the highest percentage of abortions after 13 weeks' gestation; however, differences across racial/ethnic groups were less apparent than differences across age groups (Table 22).
Among women obtaining abortions in reporting areas that further categorized the method used by gestational age, curettage accounted for the largest percentage of abortions within every gestational age category (Table 24). At ≤8 weeks' gestation, curettage accounted for 79.4% of all procedures because of the comparatively high percentage of early medical abortions (20.3%). However, from 9--20 weeks' gestation, curettage accounted for 94.2%--98.6% of all abortions and then decreased to 89.0% of abortions at ≥21 weeks' gestation. Medical abortion at >8 weeks' gestation was uncommon at any time before 18 weeks' gestation, when its use increased to 2.7% at 18--20 weeks and 9.0% at ≥21 weeks' gestation. Throughout gestation, intrauterine instillations and other procedures accounted for a very low percentage of abortions (0%--2.4%).
Abortion Mortality
Using national PMSS data (36), CDC identified nine deaths for 2006 that were potentially related to abortion. These deaths were identified either by some indication of abortion on the death certificate or by reports from a health-care provider or public health agency. Investigation of these cases indicated that six of the nine deaths were related to legal abortion and none to illegal abortion (Table 25). One of the six deaths related to a legal induced abortion occurred after a medical (nonsurgical) abortion procedure; this case has been described previously (38). Of the three deaths that were determined not to be related to a legal induced abortion, one was determined to be unrelated to the pregnancy or the abortion procedure, whereas two were attributed to pregnancy outcomes other than induced abortion (one spontaneous abortion and one live birth). Possible abortion-related deaths that occurred during 2007--2010 are under investigation.
Discussion
For 2007, a total of 827,609 abortions were reported in the United States. Among the 45 reporting areas that provided data for every year during 1998--2007, a total of 810,582 abortions were reported for 2007. These same 45 areas reported an abortion rate of 16.0 abortions per 1,000 women aged 15--44 years and an abortion ratio of 231 abortions per 1,000 live births. Compared with 2006, this represents a 2% decrease in the total number and rate of reported abortions and a 3% decrease in the abortion ratio. Thus, the decrease that occurred during 2006--2007 is consistent with the general decrease that occurred during 1998--2007. However, the changes that occurred during 2006--2007 contrast with the pattern observed during 2005--2006, when a 3% increase in the total number and rate of reported abortions paralleled a 3% increase in both the total number of live births and the fertility rate (live births per 1,000 women aged 15--44 years) for the United States (12,39). Because birth data for 2008 and preliminary numbers for 2009 show a decrease in the total number of births and the fertility rate for the United States (40,41), subsequent years of abortion data, when available, will be important for evaluating trends in pregnancy outcomes.
In addition to overall population changes, this report highlights important age differences in abortion trends. During 1998--2007, women in their 20s obtained the majority of abortions (>55%) and therefore accounted for most of the overall changes in abortion rates. Conversely, women aged ≥35 years consistently accounted for a small percentage of abortions, although their abortion rates increased slowly during this entire period. This slow but persistent increase suggests that unintended pregnancy is a problem that women continue to face throughout their reproductive years and that women in older age groups might need additional assistance with avoiding unintended pregnancies.
The adolescent abortion trends described in this report are important for the evaluation of recent changes in adolescent pregnancy and birth rates. During 1990--2005, pregnancy rates among adolescents aged 15--19 years decreased 40%, reflecting decreases in both adolescent abortions and live births (5). However, this long-term trend was interrupted during 2005--2007, when the birth rate for adolescents increased 5% (39). By comparison, during 2005--2007, the abortion rate among adolescents aged 15--19 years decreased 1%. Because adolescent abortion rates decreased during this period, albeit slightly, with a corresponding decrease in adolescent abortion ratios, a portion of the increase in adolescent births might be accounted for by an increasing tendency for adolescents to continue their pregnancies. However, the much larger increase in adolescent births, compared with the small decrease in adolescent abortions, suggests that part of the increase in adolescent births during 2005--2007 can be attributed to an increase in adolescent pregnancies. Because 2008 birth data and preliminary numbers for 2009 once again show a decrease in births and the birth rate for adolescents (40,41), fully evaluating these trends when the abortion data for 2008 and 2009 are available will be important.
The findings in this report on race and ethnicity reflect differences in patterns of obtaining abortions that have been well-documented and observed for many years (2--10,12). Comparatively high abortion rates and ratios among black women have been attributed to higher unintended pregnancy rates and a higher percentage of unintended pregnancies ending in abortion (21). Data from this and one other report (10) suggest that the differences between black women and women of other races might have narrowed slightly in recent years. Accumulation of data over time is needed to determine whether this is a sustained trend. High abortion rates among Hispanic women compared with non-Hispanic white women have been attributed to high pregnancy rates among Hispanic women. However, abortion ratios in these two groups have been more comparable. Compared with non-Hispanic white women, Hispanic women have a slightly higher percentage of pregnancies that are unintended but are no more likely than non-Hispanic white women to terminate unintended pregnancies (21). Relative changes over time in abortion rates and ratios for Hispanic women are difficult to interpret from this report because records before 2007 for non-Hispanic women combined women from white, black, and other racial populations.
The findings presented in this report indicate that more women are obtaining abortions earlier in gestation, when the risks for complications are lowest (42). Among the areas that reported data every year during 1998--2007, the percentage of abortions performed at ≤8 weeks' gestation increased 14%. Moreover, among the areas that reported abortions at ≤13 weeks' gestation by individual week, a clear shift in the distribution toward earlier weeks of gestation was observed: the percentage performed at ≤6 weeks' gestation increased 65%, whereas the percentage performed at ≥8 weeks' gestation decreased. Nonetheless, the overall percentage of abortions performed at ≤13 weeks' gestation changed little, and the reduction in the small proportion of abortions obtained after this point in gestation was slight. Because the risks for abortion complications are the very lowest early in gestation, it is important to understand the factors that cause women to delay their requests for pregnancy termination (43--46).
Several factors have been suggested to explain the reason a greater proportion of black women and adolescents obtained an abortion after the initial weeks of pregnancy. Because women with low incomes frequently need additional time to raise the necessary funds and make arrangements for an abortion (44,47), some of the delays among black women might be related to their higher poverty rates (48). Delays among adolescents might reflect the fact that they often take longer to suspect and then confirm they are pregnant (44,46) and might take longer to arrange an abortion because of parental involvement laws (49). In addition, certain pregnant adolescents approaching age 18 years wait until they are old enough to obtain an abortion without parental involvement (50,51), thereby delaying their procedure.
The shift in abortion to earlier stages of gestation, although not observed equally among all women, has been facilitated by changes in the types of procedures being used. Curettage has remained the most common method for performing abortions. Although for many years this type of abortion had been performed only after the initial weeks of gestation, the development of highly sensitive pregnancy tests and transvaginal ultrasonography increasingly have allowed clinicians to diagnose pregnancy and confirm its termination at ≤6 weeks' gestation (52--57). In addition, the increasing use of medical abortion has contributed to the increasing percentage of abortions performed early in gestation. In September 2000, FDA approved mifepristone for use in early medical abortion (33), and the American College of Obstetricians and Gynecologists has endorsed an evidence-based protocol that can be used up to 63 days of gestation (18). In 2007, 63.3% of abortions were performed at ≤8 weeks' gestation and thus were eligible for early medical abortion; 20.3% of these eligible abortions and 13.1% of all abortions were reported as early medical abortions. The use of early medical abortion also has increased substantially since FDA approved the use of mifepristone: during 2001--2007 the percentage of all reported abortions accounted for by this method increased 243%. Moreover, whereas the rate of increase leveled off after the initial years of approval (58), the proportional use of this method continues to increase, with the percentage of all abortions reported as early medical abortion increasing 12% during 2006--2007.
The annual number of deaths associated with known legal induced abortions during 1997--2006 was 57% lower, on average, than during 1972--1981. In 2006, six women died from causes known to be associated with legal abortion, and none died as a result of known illegal abortions. CDC data cannot be used to calculate national case-fatality rates for 1998--2006 because certain states (four during 1998--1999, three during 2000--2005 and 2007, and two during 2006), including California, did not report abortion surveillance data. Because a substantial number of abortions have been documented in California (3,37), CDC data cannot be used to approximate the total number of abortions as the denominator.
Limitations
The findings in this report are subject to at least four limitations. First, because reporting requirements are established by the individual reporting areas (15), the collection of data varies, and CDC is unable to obtain the total number of abortions performed in the United States. During 1998--2007, the total annual number of abortions recorded by CDC was only 65%--69% of the number recorded by the Guttmacher Institute (37), which uses numerous active follow-up techniques to increase the completeness of the data obtained through its periodic national survey of abortion providers (11). Although most reporting areas collect and send abortion data to CDC, this information is given to CDC voluntarily; consequently, during 1998--2007, 45 of the 52 reporting areas provided CDC data on a consistent annual basis, and CDC did not obtain any information from California, Maryland, or New Hampshire for 2007.††††† In addition, whereas most of the reporting areas that send abortion data to CDC have laws requiring medical providers to submit a report for every abortion they perform to a central health agency, in New Jersey and the District of Columbia, medical providers submit this information voluntarily (14). As a result, the abortion numbers these areas report to CDC tend to be relatively incomplete.§§§§§ Moreover, even in states that legally require medical providers to submit a report for all the abortions they perform, enforcement of this requirement varies (59), and thus several other reporting areas provide CDC with comparatively incomplete numbers.¶¶¶¶¶
Second, because reporting requirements are established by the individual reporting areas, CDC's model reporting form (16) is not consistently used to request information from abortion providers. Consequently, many reporting areas do not collect all the information CDC requests on the characteristics of women obtaining abortions (e.g., age, race, and ethnicity) (59); similarly, some reporting areas do not specifically include medical abortion as one of the potential methods for terminating a pregnancy (14). Although missing demographic information might reduce the extent to which the statistics in this report represent all women in the United States, three nationally representative surveys of women obtaining abortions in 1987, 1994--1995, and 2001--2002 have produced distributions of characteristics similar to the distributions reported by CDC for the relevant years (7--9). However, compared with estimates for demographic variables, CDC's early estimates for the use of medical abortion might not as accurately represent the proportional contribution of this method because these estimates were based on comparatively incomplete data. In 2001, the first full year following FDA approval of mifepristone for early medical abortion, only 28 reporting areas specifically requested information on the use of this method from abortion providers. As more states add medical abortion to their reporting forms, CDC estimates of the proportional contribution of this method should improve; however, trend analyses will continue to be affected by early data.
Third, abortion data are compiled and reported to CDC by the central health agency of the reporting area in which the abortion was performed rather than the reporting area in which the woman lived. This inflates abortion statistics for reporting areas in which a high percentage of abortions are obtained by out-of-state residents and undercounts procedures for states with limited abortion services, more stringent legal requirements for obtaining an abortion, or geographic proximity to services in another state. To correct for these biases, CDC attempts to categorize abortions by residence in addition to occurrence but was unable to identify the state, territory, reporting area, or country of residence for 12.6% of reported abortions.
Finally, adjustments for socioeconomic status cannot be made without data on education or income, and joint analysis of many variables of interest (e.g., age, race, and ethnicity) is precluded because reporting areas provide CDC with aggregate numbers rather than individual-level records.
Public Health Implications
Ongoing abortion surveillance is important for several reasons. First, ongoing abortion surveillance is needed to guide and evaluate programs aimed at preventing unintended pregnancies. Although pregnancy intentions are complex and difficult to assess (60--66), abortion provides a proxy measure for the number of pregnancies that are unwanted. Second, routine abortion surveillance is needed to assess changes in clinical practice patterns over time (e.g., types of procedures being used and the gestational age at which procedures are performed). Finally, statistics on the number of pregnancies ending in abortion can be used in conjunction with data on births and fetal deaths to more accurately estimate the number of pregnancies in the United States and determine rates for a variety of outcomes (e.g., adolescent pregnancy rates) (67).
According to the most recent national estimates, nearly one fifth of all pregnancies in the United States end in abortion (5). Multiple factors can influence the incidence of abortion, including the availability of abortion providers (11,68--70); the adoption of state regulations, such as mandatory waiting periods and parental involvement laws (49,71); increasing acceptance of nonmarital childbearing (72,73); shifts in the racial/ethnic composition of the U.S. population (74,75); and changes in the economy and the resulting impact on fertility preferences and access to health-cares services, including contraception (76,77). However, even with these influences, most abortions are preceded by an unintended pregnancy, with intended pregnancies estimated to account for 4% of all abortions (21), including those which presumably are performed for maternal medical indications and fetal abnormalities. Providing women with the knowledge and resources necessary to make decisions about their sexual behavior and use of contraception can help them avoid unintended pregnancies and thus reduce the number of women seeking abortion. However, efforts to reduce the number of unintended pregnancies in the United States have been challenging. Findings from the National Survey of Family Growth (NSFG), the primary national source of data on unintended pregnancy in the United States, suggest that unintended pregnancy rates decreased during 1982--1995 in conjunction with an increase in the proportion of women at risk for unintended pregnancy****** who were using contraception (79--81). However, by 2002, contraceptive use among women at risk for unintended pregnancy had decreased (80), and decreases in unintended pregnancy had plateaued (21). Data from the 2006--2008 NSFG indicate that contraceptive use among women at risk for unintended pregnancy has not increased subsequently, and only small increases have occurred in the use of the most effective forms of reversible contraception (78). Previous research has shown that the total number of unintended pregnancies and abortions is similar for the comparatively small group of women at risk for unintended pregnancy who are not using any form of contraception and for the much larger group of women who are not using contraception effectively (21,82,83). Therefore, improvements in use of family planning for both of these groups are needed to reduce the number of unintended pregnancies, and thus the number of abortions that are performed, in the United States.
Acknowledgments
This report is based, in part, on contributions by Jessica Reno, Rollins School of Public Health, Emory University, Atlanta, Georgia; and Kristi Seed, Science Applications International Corporation, Atlanta, Georgia.
References
- Smith JC. Abortion surveillance report, hospital abortions, annual summary 1969. Atlanta, GA: US Department of Health, Education, and Welfare, Public Health Service, Health Services and Mental Health Administration, National Communicable Disease Center; 1970.
- CDC. Abortion surveillance---United States, 2005. MMWR 2008;57(No. SS-13).
- Henshaw SK, Kost K. Trends in the characteristics of women obtaining abortions, 1974 to 2004. New York, NY: Guttmacher Institute; 2008. Available at http://www.guttmacher.org/pubs/2008/09/23/TrendsWomenAbortions-wTables.pdf. Accessed November 10, 2010.
- Jones RK, Kost K, Singh S, Henshaw SK, Finer LB. Trends in abortion in the United States. Clin Obstet Gynecol 2009;52:119--29.
- Ventura SJ, Abma JC, Mosher WD, Henshaw SK. Estimated pregnancy rates by outcome for the United States, 1990--2005: an update. Natl Vital Stat Rep 2009;58(4).
- Ventura SJ, Mosher WD, Curtin SC, Abma JC, Henshaw S. Trends in pregnancies and pregnancy rates by outcome: estimates for the United States, 1976--1996. Vital Health Stat 2000;21(56).
- Henshaw SK, Kost K. Abortion patients in 1994--1995: characteristics and contraceptive use. Fam Plann Perspect 1996;28:140--7, 58
- Henshaw SK, Silverman J. The characteristics and prior contraceptive use of U.S. abortion patients. Fam Plann Perspect 1988;20:158--68.
- Jones RK, Darroch JE, Henshaw SK. Patterns in the socioeconomic characteristics of women obtaining abortions in 2000--2001. Perspect Sex Reprod Health 2002;34:226--35.
- Jones RK, Finer LB, Singh S. Characteristics of U.S. abortion patients, 2008. New York, NY: Guttmacher Institute. Available at http://www.guttmacher.org/pubs/US-Abortion-Patients.pdf. Accessed November 10, 2010.
- Jones RK, Kooistra K. Abortion incidence and access to services in the United States, 2008. Perspectives on Sexual and Reproductive Health 2011;43:41-50.
- CDC. Abortion surveillance---United States, 2006. MMWR 2009;58(No. SS-8).
- CDC. Abortion surveillance, 1981. Atlanta, GA: US Department of Health, Education, and Welfare, Public Health Service, CDC; 1985.
- Guttmacher Institute. State policies in brief: abortion reporting requirements. New York, NY: Guttmacher Institute. Available at http://www.guttmacher.com/statecenter/spibs/spib_ARR.pdf. Accessed November 10, 2010.
- Saul R. Abortion reporting in the United States: an examination of the federal-state partnership. Fam Plann Perspect 1998;30:244--7.
- CDC. Handbook on the reporting of induced termination of pregnancy. Hyattsville, MD: US Department of Health and Human Services, CDC, National Center for Health Statistics; 1998; DHHS publication no. (PHS)98 1117:1--18.
- Paul M, Lichtenberg ES, Borgatta L, Grimes DA, Stubblefield PG, Creinin MD. Management of unintended and abnormal pregnancy: comprehensive abortion care. Oxford, England: Blackwell Publishing; 2009.
- ACOG Committee. ACOG practice bulletin: clinical management guidelines for obstetrician-gynecologists. Obstet Gynecol 2005;106:871--82.
- Grimes DA, Schultz KF, Cates W, Jr., Tyler CW. The Joint Program for the Study of Abortion/CDC: A preliminary report. In: Hern WM, Andrikopoulos B, eds. Abortion in the Seventies: Proceedings of the Western Regional Conference on Abortion New York, NY: National Abortion Federation; 1977:41--54.
- Grimes DA, Schulz KF, Cates Jr W, Tyler Jr CW. Mid-trimester abortion by dilatation and evacuation: a safe and practical alternative. N Engl J Med 1977;296:1141--5.
- Finer LB, Henshaw SK. Disparities in rates of unintended pregnancy in the United States, 1994 and 2001. Perspect Sex Reprod Health 2006;38:90--6.
- CDC. VitalStats---births, birth data files. Hyattsville, MD: CDC, National Center for Health Statistics. Available at http://www.cdc.gov/nchs/data_access/vitalstats/VitalStats_Births.htm. Accessed November 10, 2010.
- CDC. Postcensal estimates of the resident population of the United States as of July 1, 2007, by year, state and county, age, bridged race, sex, and Hispanic origin (Vintage 2007) [File pcen_v2007_y07.sasbdat]. Hyattsville, MD: CDC, National Center for Health Statistics; 2008. Available at http://www.cdc.gov/nchs/nvss/bridged_race/data_documentation.htm#vintage2007. Accessed November 10, 2010.
- CDC. Postcensal estimates of the resident population of the United States as of July 1, 2006, by year, state and county, age, bridged race, sex, and Hispanic origin (Vintage 2006) [File pcen_v2006_y06.sasbdat]. Hyattsville, MD: CDC, National Center for Health Statistics; 2007. Available at http://www.cdc.gov/nchs/nvss/bridged_race/data_documentation.htm#vintage2006. Accessed November 10, 2010.
- CDC. Postcensal estimates of the resident population of the United States as of July 1, 2005, by year, state and county, age, bridged race, sex, and Hispanic origin (Vintage 2005) [File pcen_v2005_y05.sasbdat]. Hyattsville, MD: CDC, National Center for Health Statistics; 2006. Available at http://www.cdc.gov/nchs/nvss/bridged_race/data_documentation.htm#vintage2005. Accessed November 10, 2010.
- CDC. Postcensal estimates of the resident population of the United States as of July 1, 2004, by year, state and county, age, bridged race, sex, and Hispanic origin (Vintage 2004) [File pcen_v2004_y04.sasbdat]. Hyattsville, MD: CDC, National Center for Health Statistics; 2005. Available at http://www.cdc.gov/nchs/nvss/bridged_race/data_documentation.htm#vintage2004. Accessed November 10, 2010.
- CDC. Postcensal estimates of the resident population of the United States as of July 1, 2003, by year, state and county, age, bridged race, sex, and Hispanic origin (Vintage 2003) [File pcen_v2003_y03.zip]. Hyattsville, MD: CDC, National Center for Health Statistics; 2004. Available at http://www.cdc.gov/nchs/nvss/bridged_race/data_documentation.htm#vintage2003. Accessed November 10, 2010.
- CDC. Postcensal estimates of the resident population of the United States as of July 1, 2002, by year, state and county, age, bridged race, sex, and Hispanic origin (Vintage 2002) [File pcen_v2002_y02.zip]; 2003. Available at http://www.cdc.gov/nchs/nvss/bridged_race/data_documentation.htm#vintage2002. Accessed November 10, 2010.
- CDC. Bridged-race population estimates of the resident population of the United States as of April 1, 2000, by state and county, single year of age, bridged race, sex, and Hispanic origin [File br040100.zip]. Hyattsville, MD: CDC, National Center for Health Statistics; 2003. Available at http://www.cdc.gov/nchs/nvss/bridged_race/data_documentation.htm#april2000. Accessed November 10, 2010.
- CDC. Bridged-race intercensal estimates of the July 1, 1990--July 1, 1999, resident population of the United States by state, single year of age, bridged race, sex, and Hispanic origin [File icen_stA1.zip]. Hyattsville, MD: CDC, National Center for Health Statistics, National Center for Health Statistics; 2004. Available at http://www.cdc.gov/nchs/nvss/bridged_race/data_documentation.htm#april2000. Accessed November 10, 2010.
- CDC. Bridged-race intercensal estimates of the July 1, 1990---July 1, 1999, resident population of the United States by state and county, single year of age, bridged race, sex, and Hispanic origin [File icen_A1_3.zip]. Hyattsville, MD: CDC, National Center for Health Statistics; 2004. Available at http://www.cdc.gov/nchs/nvss/bridged_race/data_documentation.htm#april2000. Accessed November 10, 2010.
- Kochanek KD. Induced terminations of pregnancy: reporting states, 1988. Monthly Vital Stat Rep 1991;39(Suppl 12).
- US Food and Drug Administration. Orange book: approved drug products with therapeutic equivalence evaluations [Mifepristone]. Available at http://www.accessdata.fda.gov/scripts/cder/ob/docs/obdetail.cfm?Appl_No=020687&TABLE1=OB_Rx. Accessed August 30, 2010.
- CDC. Abortion surveillance, 1972. Atlanta, GA: US Department of Health, Education, and Welfare, Public Health Service, CDC; 1974.
- CDC. Abortion surveillance, 1977. Atlanta, GA: US Department of Health, Education, and Welfare, Public Health Service, CDC; 1979.
- CDC. Pregnancy-related mortality surveillance---United States, 1991--1999. MMWR 2003;52(No. SS-2).
- Guttmacher Institute. State data center, trend data, abortions by state of occurrence. Available at http://www.guttmacher.org/datacenter/trend.jsp#. Accessed November 10, 2010.
- Cohen AL, Bhatnagar J, Reagan S, et al. Toxic shock associated with Clostridium sordellii and Clostridium perfringens after medical and spontaneous abortion. Obstet Gynecol 2007;110:1027--33.
- Martin JA, Hamilton BE, Sutton PD, et al. Births: final data for 2007. Natl Vital Stat Rep 2010;58(24).
- Martin JA, Hamilton BE, Sutton PD, et al. Births: final data for 2008. Natl Vital Stat Rep 2010;59(1).
- Hamilton BE, Martin JA, Ventura SJ. Births preliminary data for 2009. Natl Vital Stat Rep 2010;59(3).
- Bartlett LA, Berg CJ, Shulman HB, et al. Risk factors for legal induced abortion-related mortality in the United States. Obstet Gynecol 2004;103:729--37.
- Drey EA, Foster DG, Jackson RA, Lee SJ, Cardenas LH, Darney PD. Risk factors associated with presenting for abortion in the second trimester. Obstet Gynecol 2006;107:128--35.
- Finer LB, Frohwirth LF, Dauphinee LA, Singh S, Moore AM. Timing of steps and reasons for delays in obtaining abortions in the United States. Contraception 2006;74:334--44.
- Foster DG, Jackson RA, Cosby K, Weitz TA, Darney PD, Drey EA. Predictors of delay in each step leading to an abortion. Contraception 2008;77:289--93.
- Kiley JW, Yee LM, Niemi CM, Feinglass JM, Simon MA. Delays in request for pregnancy termination: comparison of patients in the first and second trimesters. Contraception 2010;81:446--51.
- Boonstra HD. The heart of the matter: public funding of abortion for poor women in the United States. Guttmacher Policy Review 2007;10:12--6.
- US Census Bureau. POV01. Age and sex of all people, family members and unrelated individuals iterated by income-to-poverty ratio and race, subtables for all races and black alone; 2007. Available at http://pubdb3.census.gov/macro/032008/pov/new01_100.htm. Accessed November 10, 2010.
- Dennis A, Henshaw SK, Joyce TJ, Finer LB, Blanchard K. The impact of laws requiring parental involvement for abortion: a literature review. New York, NY: Guttmacher Institute; 2009 Available at http://www.guttmacher.org/pubs/ParentalInvolvementLaws.pdf. Accessed September 15, 2010.
- Colman S, Joyce T. Minors' behavioral responses to parental involvement laws: delaying abortion until age 18. Perspect Sex Reprod Health 2009;41:119--26.
- Joyce T, Kaestner R, Colman S. Changes in abortions and births and the Texas parental notification law. N Engl J Med 2006;354:1031--8.
- Creinin MD, Edwards J. Early abortion: surgical and medical options. Curr Probl Obstet Gynecol Fertil 1997;20:1--32.
- Edwards J, Carson SA. New technologies permit safe abortion at less than six weeks' gestation and provide timely detection of ectopic gestation. Am J Obstet Gynecol 1997;176:1101--6.
- Fjerstad M, Stewart F. Pregnancy testing and management of early pregnancy. In: Hatcher RA, Trussell J, Nelson AL, Cates Jr. W, Stewart F, Kowal D, editors. Contraceptive technology. 19th rev ed. New York, NY: Ardent Media; 2008:591--635.
- Goldstein SR, Reeves MF. Clinical assessment and ultrasound in early pregnancy. In: Paul M, Lichtenberg ES, Borgatta L, Grimes DA, Stubblefield PG, Creinin MD, eds. Management of unintended and abnormal pregnancy: comprehensive abortion care. West Sussex, England: Blackwell Publishing; 2009:63--77.
- Grimes DA. Management of abortion. In: Rock JA, Thompson JD, eds. Te Linde's operative gynecology. Philadelphia, PA: Lippincott-Raven Publishers; 1997:477--99.
- Mechstroth K, Paul M. First-trimester aspiration abortion. In: Paul M, Lichtenberg ES, Borgatta L, Grimes DA, Stubblefield PG, Creinin MD, editors. Management of unintended and abnormal pregnancy: comprehensive abortion care. West Sussex, England: Blackwell Publishing; 2009:135--56.
- Finer LB, Wei J. Effect of mifepristone on abortion access in the United States. Obstet Gynecol 2009;114:623--30.
- Pazol K. Abortion surveillance in the United States: future directions and challenges. Paper presented at the annual meeting of the National Association for Public Health Statistics and Information Systems; 2010. Available at http://www.naphsis.org/naphsis/files/ccLibraryFiles/Filename/000000001291/Pazol_Abortion%20Surveillance%206-9-10_03.ppt. Accessed September 15, 2010.
- Dott M, Rasmussen SA, Hogue CJ, Reefhuis J. Association between pregnancy intention and reproductive-health related behaviors before and after pregnancy recognition, National Birth Defects Prevention Study, 1997--2002. Matern Child Health J 2010;14:373--81.
- Klerman LV. The intendedness of pregnancy: a concept in transition. Matern Child Health J 2000;4:155--62.
- Lifflander A, Gaydos LM, Hogue CJ. Circumstances of pregnancy: low income women in Georgia describe the difference between planned and unplanned pregnancies. Matern Child Health J 2007;11:81--9.
- Sable MR, Spencer JC, Stockbauer JW, Schramm WF, Howell V, Herman AA. Pregnancy wantedness and adverse pregnancy outcomes: differences by race and Medicaid status. Fam Plann Perspect 1997;29:76--81.
- Sable MR, Wilkinson DS. Pregnancy intentions, pregnancy attitudes, and the use of prenatal care in Missouri. Matern Child Health J 1998;2:155--65.
- Santelli J, Rochat R, Hatfield-Timajchy K, et al. The measurement and meaning of unintended pregnancy. Perspect Sex Reprod Health 2003;35:94--101.
- Santelli JS, Lindberg LD, Orr MG, Finer LB, Speizer I. Toward a multidimensional measure of pregnancy intentions: evidence from the United States. Stud Fam Plann 2009;40:87--100.
- Ventura SJ, Abma JC, Mosher WD, Henshaw SK. Estimated pregnancy rates by outcome for the United States, 1990--2004. Natl Vital Stat Rep 2008;56(15).
- Finer LB, Henshaw SK. Abortion incidence and services in the United States in 2000. Perspect Sex Reprod Health 2003;35:6--15
- Henshaw SK. Abortion incidence and services in the United States, 1995--1996. Fam Plann Perspect 1998;30:263--70, 87.
- Jones RK, Zolna MR, Henshaw SK, Finer LB. Abortion in the United States: incidence and access to services, 2005. Perspect Sex Reprod Health 2008;40:6--16.
- Joyce TJ, Henshaw SK, Dennis A, Finer LB, Blanchard K. The impact of state mandatory counseling and waiting period laws on abortion: a literature review. New York, NY: Guttmacher Institute; 2009. Available at http://www.guttmacher.org/pubs/MandatoryCounseling.pdf. Accessed October 15, 2010.
- Martinez GM, Chandra A, Abma JC, Jones J, Mosher WD. Fertility, contraception, and fatherhood: data on men and women from Cycle 6 (2002) of the National Survey of Family Growth. Hyattsville, MD: US Department of Health and Human Services, CDC, National Center for Health Statistics. Vital Health Stat 2006;23(26).
- Ventura SJ. Changing patterns of nonmarital childbearing in the United States. Hyattsville, MD: US Department of Health and Human Services, CDC, National Center for Health Statistics; 2009. (NCHS data brief, no. 18).
- Moore KA. Teen births: examining the recent increase. Washington DC: The National Campaign to Prevent Teen and Unplanned Pregnancy; 2008. Available at http://www.thenationalcampaign.org/resources/pdf/TeenBirths_ExamIncrease.pdf. Accessed June 18, 2009.
- Yang Z, Gaydos LM. Reasons for and challenges of recent increases in teen birth rates: a study of family planning service policies and demographic changes at the state level. J Adolesc Health 2010;46:517--24.
- American College of Obstetricians and Gynecologists. Bad economy blamed for women delaying pregnancy and annual check-up; 2009. Available at http://www.acog.org/from_home/publications/press_releases/nr05-05-09-1.cfm. Accessed September 15, 2010.
- Guttmacher Institute. A real-time look at the impact of the recession on women's family planning and pregnancy decisions. New York, NY: Guttmacher Institute; 2009. Available at http://www.guttmacher.org/pubs/RecessionFP.pdf. Accessed September 15, 2010.
- Mosher WD, Jones J. Use of contraception in the United States: 1982--2008. Hyattsville, MD: US Department of Health and Human Services, CDC, National Center for Health Statistics. Vital Health Stat 2010;23(29).
- Henshaw SK. Unintended pregnancy in the United States. Fam Plann Perspect 1998;30:24--9, 46.
- Mosher WD, Martinez GM, Chandra A, Abma JC, Willson SJ. Use of contraception and use of family planning services in the United States: 1982--2002. Hyattsville, MD: US Department of Health and Human Services, CDC, National Center for Health Statistics; 2004. Advance Data from Vital Health Stat 2004; no. 350.
- Piccinino LJ, Mosher WD. Trends in contraceptive use in the United States: 1982--1995. Fam Plann Perspect 1998;30:4--10, 46.
- Benson Gold R, Sonfield A, Richards CL, Frost JJ. Next steps for America's family planning program: leveraging the potential of Medicaid and Title X in an evolving health care system. New York, NY: Guttmacher Institute; 2009. Available at http://www.guttmacher.org/pubs/NextSteps.pdf. Accessed September 15, 2010.
- Jones RK, Darroch JE, Henshaw SK. Contraceptive use among U.S. women having abortions in 2000--2001. Perspect Sex Reprod Health 2002;34:294--303.
* Hereafter, all abortions in this report are considered to be legally induced unless otherwise stated to be illegally induced.
† Data were not reported during ≥1 year by Alaska (1998--2002), California (1998--2007), Louisiana (2005), Maryland (2007), New Hampshire (1998--2007), Oklahoma (1998--1999), and West Virginia (2003--2004).
§ Excludes California, Maryland, and New Hampshire.
¶ Curettage includes vacuum aspiration, suction curettage, sharp curettage, and dilation and evacuation procedures.
** Includes hysterectomy/hysterotomy, as well as other procedures not belonging to defined categories.
†† The cutoff of ≤8 weeks acknowledges the conventional use of completed weeks of gestation and thus includes up to 8 weeks and 6 days, thereby matching the gestational age limit of 63 days for the early medical abortion protocol endorsed by the American College of Obstetricians and Gynecologists (18).
§§ The cutoff of ≤12 weeks has been selected on the basis of the implausibility of this procedure being performed at earlier gestational ages, and on the basis of early research assessing the safety of intrauterine instillations starting at 13 weeks' gestation (19,20).
¶¶ Excludes four states that did not report or did not report by maternal residence status (California, Florida, Maryland and New Hampshire).
*** Excludes California, Maryland, and New Hampshire.
††† Excludes Alaska, California, Louisiana, Maryland, New Hampshire, Oklahoma, and West Virginia.
§§§ Does not consider the abortion rate for Wyoming, which was based on only nine abortions and was judged to be unstable.
¶¶¶ Does not consider the abortion ratio for Wyoming, which was based on only nine abortions and was judged to be unstable.
**** Comparisons by residence status do not consider California, Florida, Maryland or New Hampshire. Because these states either did not report or did not report abortions by residence status, numbers are available only from other states where their residents obtained abortions, and as a consequence are artificially low.
†††† Excludes Alaska, Alabama, Arkansas, Arizona, California, Colorado, Connecticut, Florida, Georgia, Hawaii, Iowa, Illinois, Indiana, Kentucky, Louisiana, Massachusetts, Maryland, New Hampshire, Nevada, Oklahoma, Rhode Island, Tennessee, West Virginia, and Wisconsin.
§§§§ Excludes Alaska, Arizona, Arkansas, California, Connecticut, District of Columbia, Florida, Louisiana, Maine, Maryland, Nebraska, New Hampshire, New York State, Oklahoma, Rhode Island, Virginia, and Washington.
¶¶¶¶ Excludes Alaska, Arkansas, California, Connecticut, District of Columbia, Florida, Illinois, Maine, Maryland, Massachusetts, New Hampshire, New Mexico, North Carolina, Oklahoma, Rhode Island, and Wisconsin.
***** Excludes Alaska, Arkansas, California, Connecticut, District of Columbia, Florida, Illinois, Louisiana, Massachusetts, Maine, Maryland, New Hampshire, New Mexico, North Carolina, Ohio, Oklahoma, Rhode Island, Wisconsin, and Wyoming.
††††† For 2005, the most recent year for which the Guttmacher Institute has published data, procedures performed in California, Maryland, and New Hampshire accounted for 21% of all abortions counted in their national survey of abortion providers (2,37).
§§§§§ For 2005, the abortion counts that CDC obtained from New Jersey and the District of Columbia were 51% and 35%, respectively, of the abortion counts that the Guttmacher Institute obtained for these areas in their national survey of abortion providers (2,37).
¶¶¶¶¶ For 2005, the abortion counts CDC obtained from Wyoming were 20% of the counts obtained for this state by the Guttmacher Institute in their national survey of abortion providers. The counts CDC obtained for Arizona were 55% of the Guttmacher Institutes counts. For Hawaii, Idaho, and Michigan, CDC counts were 60% to <70% of the Guttmacher Institute counts; for Colorado, Connecticut, Nevada, and West Virginia, CDC counts were 70% to <80% of the Guttmacher Institute counts; and for New York, Delaware, Illinois, Massachusetts, Oregon, and Tennessee, CDC counts were 80% to <90% of the Guttmacher Institute counts. All other areas with legal reporting requirements that provided data to CDC for this report obtained counts that were at least 90% of the Guttmacher Institute counts (2,37).
****** Women are considered to be at risk for unintended pregnancy if they are fertile, have had intercourse in the past 3 months, and are not intentionally pregnant or seeking pregnancy (78).
|
TABLE 2. (Continued) Number, rate,* and ratio† of reported abortions, by reporting area of residence and occurrence and by percentage of abortions obtained by out-of-state residence§ --- United States, 2007 |
|||||||
|---|---|---|---|---|---|---|---|
|
State/Area (Continued) |
Residence |
Occurrence |
% obtained by out-of-state residents |
||||
|
No. |
Rate |
Ratio |
No. |
Rate |
Ratio |
||
|
Oklahoma |
7,086 |
9.8 |
129 |
6,640 |
9.2 |
121 |
4.2 |
|
Oregon |
10,976 |
14.7 |
222 |
11,883 |
15.9 |
241 |
10.1 |
|
Pennsylvania |
38,559 |
15.8 |
256 |
36,663 |
15.1 |
243 |
3.9 |
|
Rhode Island¶ |
3,819 |
17.2 |
309 |
4,820 |
21.7 |
389 |
23.8 |
|
South Carolina |
13,025 |
14.5 |
207 |
7,544 |
8.4 |
120 |
4.5 |
|
South Dakota |
833 |
5.4 |
68 |
707 |
4.6 |
58 |
13.9 |
|
Tennessee |
15,097 |
12.0 |
174 |
18,171 |
14.4 |
210 |
22.0 |
|
Texas |
78,034 |
15.3 |
191 |
80,886 |
15.9 |
198 |
3.9 |
|
Utah |
3,679 |
6.3 |
67 |
3,933 |
6.7 |
71 |
10.6 |
|
Vermont |
1,448 |
11.8 |
222 |
1,582 |
12.9 |
243 |
10.3 |
|
Virginia |
28,179 |
17.3 |
259 |
27,981 |
17.2 |
257 |
5.5 |
|
Washington |
24,773 |
18.6 |
278 |
24,850 |
18.7 |
279 |
4.9 |
|
West Virginia |
2,215 |
6.4 |
101 |
1,853 |
5.3 |
84 |
10.2 |
|
Wisconsin |
9,622 |
8.6 |
132 |
8,267 |
7.4 |
114 |
2.0 |
|
Wyoming |
839 |
8.3 |
106 |
9 |
---*** |
---*** |
12.5 |
|
Canada |
161 |
--- |
--- |
--- |
--- |
--- |
--- |
|
Mexico |
1,124 |
--- |
--- |
--- |
--- |
--- |
--- |
|
Total |
723,529 |
--- |
--- |
--- |
--- |
--- |
8.54 |
|
Percentage reported by known residence |
87.4 |
--- |
--- |
--- |
--- |
--- |
--- |
|
Total unknown residence |
104,080 |
--- |
--- |
--- |
--- |
--- |
--- |
|
Out-of-state, residence not stated |
5,654 |
--- |
--- |
--- |
--- |
--- |
--- |
|
No information provided on residence |
98,426 |
--- |
--- |
--- |
--- |
--- |
--- |
|
Percentage reported by unknown residence |
12.6 |
--- |
--- |
--- |
--- |
--- |
--- |
|
Total |
827,609 |
--- |
--- |
--- |
--- |
--- |
--- |
|
* Number of abortions per 1,000 women aged 15--44 years. † Number of abortions per 1,000 live births. § Based on the number of abortions for which residence status was known. ¶ State reported abortion numbers for both in-state and out-of-state residents; for out-of-state residents, the state or area of residence was not provided. ** State did not report; because numbers for this state are available only from other states where residents obtained abortions, meaningful rates and ratios cannot be calculated. †† Because reporting is not mandatory, a complete count of abortions performed in the District of Columbia could not be obtained. §§ State reported by occurrence only; because abortions by residence for this state are available only from other states where residents obtained abortions, meaningful rates and ratios cannot be calculated. ¶¶ Data from hospitals and licensed ambulatory care facilities only; because reporting is not mandatory for private physicians and women's centers, a complete count of abortions performed in New Jersey could not be obtained. *** Abortion rates and ratios were not calculated for Wyoming because results based on only nine abortions were judged to be unstable. |
|||||||
|
TABLE 9. (Continued) Reported abortions obtained at ≤13 weeks' gestation, by known weeks of gestation* and reporting area of occurrence --- selected states,† United States, 2007 |
|||||||||||||||||
|---|---|---|---|---|---|---|---|---|---|---|---|---|---|---|---|---|---|
|
* Gestational age based on the clinician's estimate (Alabama, Alaska, Arizona, Colorado, Delaware, Hawaii, Kansas, Kentucky, Louisiana, Michigan, Minnesota, Montana, Nevada, New Jersey, New Mexico, New York City, North Carolina, North Dakota, Oklahoma, Oregon, Pennsylvania, South Carolina, South Dakota, Tennessee, Texas, Utah, Virginia, Washington, and Wyoming); gestational age calculated from the last normal menstrual period (District of Columbia, Idaho, Iowa, Mississippi, Missouri, New York State, Ohio, and West Virginia); gestational age based on the clinician's estimate only when the date of the last menstrual period unavailable (Arkansas, Georgia, and Vermont); and gestational age calculated from the last normal menstrual period only when the clinician's estimate unavailable (Indiana and Maine). † Data from 42 reporting areas; excludes 10 states (California, Connecticut, Florida, Illinois, Maryland, Massachusetts, Nebraska, New Hampshire, Rhode Island, and Wisconsin) that did not report, did not report by gestational age, or did not meet reporting standards for gestational age. § Percentages for the component categories might not add up to 100.0 because of rounding. ¶ Includes residents only. ** Because reporting is not mandatory, information could not be obtained for all abortions performed in the District of Columbia. †† Data from hospitals and licensed ambulatory care facilities only; because reporting is not mandatory for private physicians and women's centers, information could not be obtained for all abortions performed in New Jersey. §§ Cell details not displayed because of small numbers (N = 1--4). ¶¶ Small numbers (N = 1--4) removed from individual cells have been subtracted from the column total. |
|
TABLE 11. (Continued) Reported abortions, by known type of procedure and reporting area of occurrence --- selected states,* United States, 2007 |
||||||||||||||||||
|---|---|---|---|---|---|---|---|---|---|---|---|---|---|---|---|---|---|---|
|
State/Area |
Curettage† |
Medical |
Total abortions reported by known procedure |
|||||||||||||||
|
≤13 weeks' gestation |
>13 weeks' gestation |
Unknown gestational age |
≤8 weeks' gestation |
>8 weeks' gestation |
Unknown gestational age |
Intrauterine instillation§ |
Other¶ |
|||||||||||
|
No. |
% of all |
|||||||||||||||||
|
No. |
(%)** |
No. |
(%) |
No. |
(%) |
No. |
(%) |
No. |
(%) |
No. |
(%) |
No. |
(%) |
No. |
(%) |
|||
|
Nevada§§ |
8,203 |
(81.9) |
705 |
(7.0) |
1,011 |
(10.1) |
NA |
NA |
NA |
NA |
NA |
NA |
0 |
(0.0) |
99 |
(1.0) |
10,018 |
(94.1) |
|
New Jersey†††† |
21,495 |
(80.6) |
4,335 |
(16.3) |
0 |
0.0 |
606 |
(2.3) |
16 |
(0.1) |
--- |
--- |
--- |
--- |
212 |
(0.8) |
26,668 |
(100.0) |
|
New Mexico |
4,642 |
(78.9) |
555 |
(9.4) |
44 |
(0.7) |
546 |
(9.3) |
78 |
(1.3) |
17 |
(0.3) |
--- |
--- |
--- |
--- |
5,884 |
(97.5) |
|
New York |
97,983 |
(77.5) |
12,924 |
(10.2) |
3,448 |
(2.7) |
10,633 |
(8.4) |
982 |
(0.8) |
1,072 |
(0.8) |
44 |
(0.0) |
300 |
(0.2) |
126,498 |
(98.8) |
|
New York City |
71,091 |
(79.0) |
9,781 |
(10.9) |
797 |
(0.9) |
7,606 |
(8.5) |
237 |
(0.3) |
345 |
(0.4) |
15 |
(0.0) |
85 |
(0.1) |
89,957 |
(99.0) |
|
New York State |
26,892 |
(73.6) |
3,143 |
(8.6) |
2,651 |
(7.3) |
3,027 |
(8.3) |
745 |
(2.0) |
727 |
(2.0) |
29 |
(0.1) |
215 |
(0.6) |
36,541§§§§ |
(98.3) |
|
North Carolina |
23,366 |
(73.3) |
2,337 |
(7.3) |
2,221 |
(7.0) |
3,492 |
(11.0) |
90 |
(0.3) |
287 |
(0.9) |
47 |
(0.1) |
24 |
(0.1) |
31,864 |
(95.9) |
|
North Dakota |
1,179 |
(95.5) |
51 |
(4.1) |
0 |
0.0 |
0 |
(0.0) |
0 |
(0.0) |
0 |
(0.0) |
0 |
(0.0) |
5 |
(0.4) |
1,235 |
(100.0) |
|
Ohio |
21,796 |
(71.9) |
3,239 |
(10.7) |
268 |
(0.9) |
3,900 |
(12.9) |
625 |
(2.1) |
143 |
(0.5) |
62 |
(0.2) |
507 |
(1.7) |
30,323§§§§ |
(98.3) |
|
Oklahoma |
5,023 |
(75.6) |
562 |
(8.5) |
0 |
0.0 |
1,048 |
(15.8) |
--- |
--- |
0 |
(0.0) |
0 |
(0.0) |
--- |
--- |
6,640 |
(100.0) |
|
Oregon |
8,624 |
(72.7) |
1,081 |
(9.1) |
151 |
(1.3) |
1,908 |
(16.1) |
54 |
(0.5) |
31 |
(0.3) |
0 |
(0.0) |
14 |
(0.1) |
11,863 |
(99.8) |
|
Pennsylvania |
29,464 |
(80.4) |
3,036 |
(8.3) |
0 |
0.0 |
4,013 |
(10.9) |
127 |
(0.3) |
0 |
(0.0) |
6 |
(0.0) |
9 |
(0.0) |
36,655 |
(100.0) |
|
South Carolina |
5,280 |
(70.2) |
5 |
(0.1) |
6 |
(0.1) |
2,193 |
(29.2) |
33 |
(0.4) |
--- |
--- |
--- |
--- |
--- |
--- |
7,523 |
(99.7) |
|
South Dakota |
590 |
(83.5) |
0 |
0.0 |
0 |
0.0 |
109 |
(15.4) |
8 |
(1.1) |
0 |
(0.0) |
0 |
(0.0) |
0 |
(0.0) |
707 |
(100.0) |
|
Texas |
62,156 |
(76.9) |
4,320 |
(5.3) |
5 |
(0.0) |
14,141 |
(17.5) |
173 |
(0.2) |
--- |
--- |
--- |
--- |
24 |
(0.0) |
80,830 |
(99.9) |
|
Utah |
2,380 |
(60.5) |
299 |
(7.6) |
29 |
(0.7) |
1,133 |
(28.8) |
67 |
(1.7) |
24 |
(0.6) |
--- |
--- |
--- |
--- |
3,933 |
(100.0) |
|
Vermont |
1,219 |
(77.1) |
48 |
(3.0) |
0 |
0.0 |
295 |
(18.6) |
18 |
(1.1) |
--- |
--- |
0 |
(0.0) |
--- |
--- |
1,582 |
(100.0) |
|
Virginia |
25,155 |
(90.1) |
384 |
(1.4) |
123 |
(0.4) |
1,782 |
(6.4) |
15 |
(0.1) |
--- |
--- |
--- |
--- |
435 |
(1.6) |
27,906 |
(99.7) |
|
Washington |
19,171 |
(77.2) |
2,303 |
(9.3) |
43 |
(0.2) |
3,222 |
(13.0) |
29 |
(0.1) |
33 |
(0.1) |
30 |
(0.1) |
6 |
(0.0) |
24,837 |
(99.9) |
|
West Virginia |
1,594 |
(87.3) |
123 |
(6.7) |
51 |
(2.8) |
43 |
(2.4) |
8 |
(0.4) |
--- |
--- |
--- |
--- |
--- |
--- |
1,826 |
(98.5) |
|
Wyoming |
9 |
(100.0) |
0 |
0.0 |
0 |
0.0 |
0 |
(0.0) |
0 |
(0.0) |
0 |
(0.0) |
0 |
(0.0) |
0 |
(0.0) |
9 |
(100.0) |
|
Total |
503,681 |
(78.6) |
49,593 |
(7.7) |
---¶¶¶¶ |
---¶¶¶¶ |
76,442 |
(11.9) |
3,399 |
(0.5) |
---***** |
---***** |
371 |
(0.1) |
8,564 |
(1.3) |
640,945††††† |
(99.1) |
|
Total among states with medical abortion on reporting form §§§§§ |
457,572 |
(78.1) |
46,551 |
(7.9) |
---¶¶¶¶ |
---¶¶¶¶ |
76,442 |
(13.1) |
3,399 |
(0.6) |
---***** |
---***** |
367 |
(0.1) |
2,324 |
(0.4) |
585,495††††† |
(99.3) |
|
* Data from 42 reporting areas; excludes 10 states (California, Florida, Illinois, Kentucky, Louisiana, Maryland, New Hampshire, Rhode Island, Tennessee, and Wisconsin) that did not report, did not report by procedure, or did not meet reporting standards for procedure. † Includes vacuum aspiration, suction curettage, sharp curettage, and dilation and evacuation procedures. § Intrauterine instillations reported at ≤12 weeks' gestation are not presented with known procedures. ¶ Includes hysterotomy/hysterectomy and procedures reported as "other." ** Percentages for the individual component categories might not add up to 100.0 because of rounding, and because some areas report more than one method for each abortion. †† Calculated as the number of abortions reported by known method type, divided by the sum of abortions reported by known and unknown method type. §§ Numbers for medical abortion are not presented because medical abortion was not included as a separate category on the reporting form. ¶¶ Not available. *** Cells details not displayed because of small numbers (N = 1--4). ††† Numbers for medical abortion at ≤8 weeks versus >8 weeks are not presented because gestational age data were not provided or were provided in incompatible categories. §§§ Includes residents only. ¶¶¶ Because reporting is not mandatory, information could not be obtained for all abortions performed in the District of Columbia. **** Because most abortions reported in Georgia for 2007 were entered into a data system that did not include a separate category for medical abortion, 870 medical abortions reported to CDC were placed in the "other" category, and Georgia was excluded from the analysis of medical abortion. †††† Data from hospitals and licensed ambulatory care facilities only; because reporting is not mandatory for private physicians and women's centers, information could not be obtained for all abortions performed in New Jersey. §§§§ Exceeds the total number of abortions reported for other variables because of the reporting of some abortions with more than one method; "other" methods may have been used concomitantly with another method belonging to a defined category to aid in its completion. ¶¶¶¶ Distributed among abortions performed by curettage at ≤13 weeks' gestation and >13 weeks' gestation according to the distribution of abortions performed by curettage at known gestational age. ***** Distributed among medical abortions at ≤8 weeks' gestation and >8 weeks' gestation according to the distribution of medical abortions at known gestational age. ††††† Because some states reported more than one procedure for some abortions, the sum of the individual procedures exceeds the total number of abortions reported by known method type. §§§§§ Excludes four states (Alabama, Georgia, Hawaii, and Nevada) that have been included in the total for all areas reporting by method type. These four states were excluded because medical abortion was not included as a separate category on their reporting form or because they did not enter medical abortions into their records as a separate category. |
||||||||||||||||||
FIGURE 1. Number, rate, and ratio of abortions performed, by year --- selected states,* United States, 1998--2007
* Data are for 45 reporting areas; excludes Alaska, California, Louisiana, Maryland, New Hampshire, Oklahoma, and West Virginia.
† Number of abortions per 1,000 women aged 15--44 years.
§ Number of abortions per 1,000 live births.
Alternate Text: This figure is a line graph that displays the data from 45 reporting areas (excluding Alaska, California, Louisiana, Maryland, New Hampshire, Oklahoma, and West Virginia) for 1998-2007 showing the number of abortions, the abortion rate (i.e., the number of abortions per 1,000 women aged 15-44 years), and the abortion ratio (i.e., the number of abortions per 1,000 live births) per year. Compared with 2006, the total number and rate of reported abortions in 2007 was 2% lower and the abortion ratio was 3% lower. However, given the increase in the number and rate of abortions that occurred during 2005-2006, these measures still were higher in 2007 than they had been in 2005. Nonetheless, compared with 1998, the total number, rate, and ratio of reported abortions in 2007 were 6%, 7%, and 14% lower, respectively.
FIGURE 2. Percentage of total abortions, abortion rate, and abortion ratio, by age group of women who obtained an abortion --- selected states,* United States, 2007
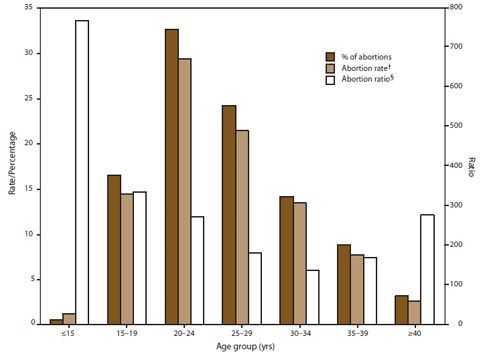
* Data are for 48 areas; excludes California, Florida, Maryland, and New Hampshire.
† Number of abortions obtained by women in a given age group per 1,000 women in that age group. Adolescents aged 13--14 years were used as the denominator for the group of adolescents aged <15 years, and women aged 40--44 years were used as the denominator for the group of women aged ≥40 years.
§ Number of abortions obtained by women in a given age group per 1,000 live births to women in that age group.
Alternate Text: : This figure is a bar graph that displays data from 48 reporting areas (excludes California, Florida, Maryland, and New Hampshire) for 2007 showing the abortion rate (i.e., the number of abortions per 1,000 women aged 15-44 years, the abortion ratio (i.e., the number of abortions per 1,000 live births), and the percentage of total abortions by the age group of women who obtained an abortion. Among the 48 areas that reported by age for 2007, women aged 20-29 years accounted for the majority (56.9%) of abortions and had the highest abortion rates (29.4 and 21.4 abortions per 1,000 women aged 20-24 and 25-29 years, respectively). Women in the youngest and oldest age groups (<15 or ≥40 years) accounted for the smallest percentage of abortions (0.5% and 3.2%, respectively) and had the lowest abortion rates (1.2 and 2.6 abortions per 1,000 women aged <15 and ≥40 years, respectively).
FIGURE 3. Percentage* of abortions, by age group of women who obtained an abortion and weeks of gestation --- selected states,† United States, 2007
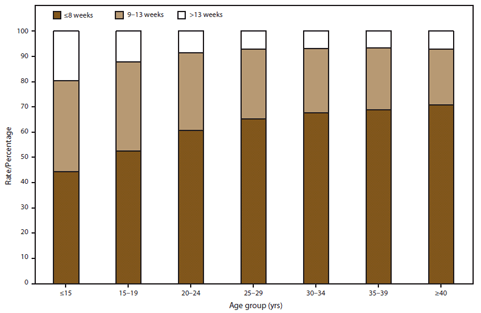
* Based on total number of abortions reported by known weeks of gestation.
† Data from 40 reporting areas; excludes California, Connecticut, District of Columbia, Florida, Illinois, Louisiana, Maryland, Massachusetts, Nebraska, New Hampshire, Rhode Island, and Wisconsin.
Alternate Text: This figure is a bar graph that displays data for 40 reporting areas (excludes California, Connecticut, District of Columbia, Florida, Illinois, Louisiana, Maryland, Massachusetts, Nebraska, New Hampshire, Rhode Island, and Wisconsin) showing the percentage of women who obtained abortions at ≤8 weeks' gestation, 9-13 weeks' gestation, or >13 weeks' gestation. Whereas 44.4% of adolescents aged <15 years and 52.5% adolescents aged 15-19 years obtained an abortion by ≤8 weeks' gestation, 60.7%-70.9% of adult women aged ≥20 years obtained an abortion by this point in gestation . Conversely, 19.6% of adolescents aged <15 years and 12.1% of adolescents aged 15-19 years obtained an abortion after 13 weeks' gestation, whereas this percentage ranged from 6.7%-8.6% for adult women.
Use of trade names and commercial sources is for identification only and does not imply endorsement by the U.S. Department of
Health and Human Services.
References to non-CDC sites on the Internet are
provided as a service to MMWR readers and do not constitute or imply
endorsement of these organizations or their programs by CDC or the U.S.
Department of Health and Human Services. CDC is not responsible for the content
of pages found at these sites. URL addresses listed in MMWR were current as of
the date of publication.
All MMWR HTML versions of articles are electronic conversions from typeset documents.
This conversion might result in character translation or format errors in the HTML version.
Users are referred to the electronic PDF version (http://www.cdc.gov/mmwr)
and/or the original MMWR paper copy for printable versions of official text, figures, and tables.
An original paper copy of this issue can be obtained from the Superintendent of Documents, U.S.
Government Printing Office (GPO), Washington, DC 20402-9371;
telephone: (202) 512-1800. Contact GPO for current prices.
**Questions or messages regarding errors in formatting should be addressed to
mmwrq@cdc.gov.
