Persons using assistive technology might not be able to fully access information in this file. For assistance, please send e-mail to: mmwrq@cdc.gov. Type 508 Accommodation and the title of the report in the subject line of e-mail.
Adult Tobacco Survey --- 19 States, 2003--2007
Abstract
Problem/Condition: Tobacco use is the leading cause of preventable death in the United States.
Reporting Period: This report includes data collected during February 2003--November 2007.
Description of the System: The Adult Tobacco Survey (ATS) is a state-administered, random-digit--dialed telephone survey of the noninstitutionalized U.S. population aged ≥18 years. ATS collects data on tobacco use, smoking cessation, secondhand smoke exposure, risk perception and social influences, health influences, and tobacco-related policy issues in the United States. ATS was developed primarily for evaluation of state tobacco control programs rather than for surveillance and offers states a great deal of flexibility in terms of when and how often the surveys can be conducted. During 2003--2007, a total of 33 state ATSs were conducted by 19 states, with sample sizes ranging from 1,301 to 12,734 completed and partially completed interviews.
Results: ATS data indicate that during 2003--2007, 13.3%--25.4% of adults smoked cigarettes (median: 19.2%); fewer adults smoked cigars (median: 6.4%) or used smokeless tobacco (median: 3.5%). The majority of tobacco users used one tobacco product (median: 82.5%). In most states, approximately half of cigarette smokers reported that they would try to quit in the next 6 months (median: 58.4%), and approximately half made an attempt to quit in the preceding year (median: 46.8%). The majority of adults (i.e., smokers and nonsmokers combined) reported that smoking should not be allowed at all in workplaces (median: 77.6%), restaurants (median: 65.5%), public buildings (median: 72.5%), or indoor sporting events/concerts (median: 72.1%). One third of adults reported smoking should not be allowed at all in cocktail lounges or bars (median: 33.1%). The percentage of adults who reported having smoke-free policies at work or home ranged from 51.2% to 75.2% (median: 61.7%).
Interpretation: These data indicate that respondents support certain state tobacco control measures; for example, the majority of adults in participating states were supportive of smoke-free policies as well as of an increase in tobacco excise tax. However, one of every five tobacco users in the participating states used multiple tobacco products, a behavior that was more common among young adults. Therefore, these data also underscore a continued need for monitoring and evaluating evidence-based, comprehensive U.S. tobacco control programs and policies.
Public Health Actions: State ATSs can be used by states to monitor and evaluate comprehensive statewide tobacco control programs. Continued surveillance of tobacco use and tobacco control outcome indicators are needed to monitor, evaluate, and improve state programs that address tobacco use, cessation, and secondhand smoke exposure.
Introduction
Tobacco use is the leading cause of preventable death in the United States (1). Each year, approximately 443,000 persons die from smoking-related diseases (2). In 1999, CDC created the National Tobacco Control Program (NTCP) to encourage coordinated, national measures to reduce tobacco-related diseases and deaths. NTCP-funded programs are working toward the four NTCP goals, which are to prevent initiation of tobacco use among youths, promote cessation among adults and youths, eliminate exposure to secondhand smoke, and identify and eliminate tobacco-related disparities among population groups. The NTCP-recommended strategies to achieve these goals include population-based community interventions, countermarketing, program policy and regulation, and surveillance and evaluation. In 2002, CDC developed the Adult Tobacco Survey (ATS) to evaluate state progress toward the four NTCP goals. State ATSs are especially useful for evaluation of tobacco control programs because they include questions intended to measure evidence-based short-term, intermediate, and long-term outcome indicators (i.e., specific, observable, and measurable characteristics or changes that represent achievement of an outcome in tobacco control, such as smoking prevalence), and these indicators are related to the four NTCP goals. ATS provides state-specific data on tobacco use, smoking cessation, perceptions of health risks from smoking and secondhand smoke, and tobacco-related policy issues; therefore, the data can be used not only to monitor tobacco use within a state but also to help states evaluate state-level tobacco control programs. Many of the ATS questions are similar or identical to questions on other surveys, such as the Behavioral Risk Factor Surveillance System (BRFSS), that are intended for surveillance purposes. However, chronic disease surveillance systems such as BRFSS do not include as many tobacco-related questions as a tobacco-specific survey such as ATS and therefore cannot measure all the outcome indicators needed to evaluate tobacco control programs.
Comprehensive, evidence-based tobacco control programs can substantially reduce tobacco use and smoking prevalence (3,4). A comprehensive statewide tobacco control program is a coordinated measure to establish smoke-free policies and change social norms associated with tobacco use, to promote and assist with cessation of tobacco use, and to prevent initiation of tobacco use through a combination of economic, regulatory, social, clinical, and educational strategies (3). Previous studies have documented the effectiveness of state tobacco control programs and policies (i.e., establishing policies that make public places, workplaces, and vehicles smoke-free and increasing the real price [adjusted to the buying power of the dollar] of tobacco products) in achieving progress toward the four NTCP goals (3). Expenditures by state tobacco control programs are associated with a decrease in adult smoking prevalence (5); smoking prevalence decreases as state expenditures on comprehensive tobacco control programs increase (3). Several Healthy People 2010 objectives address tobacco control program initiatives, including reducing the proportion of nonsmokers exposed to secondhand smoke (objective 27-10), increasing the number of persons covered by indoor worksite policies that prohibit smoking (objective 27-12), establishing laws on smoke-free indoor air that prohibit smoking in public places and worksites (objective 27-13), and increasing the average federal and state tax on tobacco products (objective 27-21) (6).
In 2008, the World Health Organization (WHO) developed MPOWER, a technical assistance package for global tobacco control (7). The MPOWER package contains the six tobacco control strategies proven to be most effective in reducing smoking prevalence: 1) monitor tobacco use; 2) protect persons from tobacco smoke; 3) offer help with tobacco use cessation; 4) warn persons about the dangers of tobacco; 5) enforce bans on tobacco advertising, promotion, and sponsorship; and 6) raise taxes on tobacco products. State tobacco control programs can implement these six strategies in conjunction with the NTCP-recommended strategies for tobacco control. By monitoring the progress of state tobacco control programs through an ATS, states can guide implementation of the MPOWER package and NTCP strategies.
In Key Outcome Indicators for Evaluating Comprehensive Tobacco Control Programs (8), CDC identified the short-term, intermediate, and long-term outcomes that are most useful for evaluating the effectiveness of comprehensive tobacco control programs (Appendix). ATS provides information on adult tobacco use and data on these outcome indicators that are useful for measuring state-level progress in preventing smoking initiation, including level of support for increasing excise tax on tobacco products, level of support for creating tobacco-free policies in schools, the average age at which persons first smoked a whole cigarette, and the prevalence of tobacco use among young adults.
Since 2003, a total of 19 states have implemented at least one ATS with support from CDC. This support includes the provision of technical assistance throughout the survey process, sample selection, data quality checks and data processing, and weighted data and tables. Several states have conducted an ATS either annually or more than once. This report summarizes data from 33 ATSs that were collected by 19 states during 2003--2007.
Methods
Sampling
ATS is a random-digit--dialed telephone survey of the civilian, noninstitutionalized U.S. population aged ≥18 years. The number of targeted complete interviews was determined by each state depending on state needs and funding. As a result, sample sizes varied by state and year. In addition, states had the option to oversample specific population groups.
Questionnaire
ATS includes 1) a core set of questions for all state surveys, 2) CDC-recommended supplemental questions that states may select to include in their surveys, and 3) additional questions developed and added by the state to meet state-specific needs for the evaluation of their tobacco control programs. The core ATS includes 49 questions for current smokers, 38 questions for former smokers, and 34 questions for never smokers, including questions about tobacco use, tobacco use cessation, secondhand smoke exposure, smoke-free workplace policies, risk perception, social influences, and demographic questions. The majority of these questions were included in all state surveys. States had the option of including CDC-recommended standard supplemental questions and any state-added questions needed (in accordance with each individual state's approval procedures). Supplemental questions collected additional information on demographic characteristics, tobacco use, tobacco use cessation, secondhand smoke, health and social influences, policy issues, parental involvement, and media exposure. State-developed questions included any questions designed by a state that were not part of the core or supplemental questions, as well as any core or supplemental questions that were altered or had altered corresponding answer choices. Only data obtained from core and standard supplemental questions (i.e., no state-developed questions) are presented in this report.
Final questionnaires were developed by each state, and survey data collection varied somewhat by state. Therefore, data regarding certain tobacco-related variables are unavailable for certain states. Variables without data indicate that either the state did not include a particular question in its survey or that the state might have altered the question in a way that made the results incomparable to those from other states.
Data Collection
Survey data were collected using a uniform, detailed telephone-calling protocol. Telephone numbers that had not received a final disposition code after at least 15 call attempts and had received at least three weekday calls, three weeknight calls, and three weekend calls were assigned a final disposition code and no longer called. Surveys were administered over a period ranging from 3 to 12 months. To ensure data quality, data checks were conducted monthly at CDC to detect out-of-range values and skip pattern and disposition code errors.
A total of 33 CDC-supported ATSs were conducted by 19 states during 2003--2007 (Figure 1): four states in 2003 (Alaska, Florida, Illinois, and New Mexico), seven states in 2004 (Florida, Georgia, Iowa, Montana, Ohio, Oklahoma, and Wyoming), seven states in 2005 (Florida, Idaho, Illinois, Michigan, Montana, Pennsylvania, and West Virginia), 10 states in 2006 (Arkansas, Florida, Hawaii, Iowa, Kansas, Montana, New Jersey, New Mexico, Ohio, and Wyoming), and five states in 2007 (Florida, Illinois, South Carolina, West Virginia, and Wyoming).
Data Analysis
Weighted percentages and 95% confidence intervals (CIs) were calculated using statistical software. Data were weighted for the probability of selection of a telephone number, the number of adults in a household, and the number of phones in a household and were poststratified by region or state-level estimates of age, race, Hispanic origin, and sex for the year of the survey. Data from questions with <50 respondents were not analyzed.
Tobacco use prevalence included current cigarette smoking prevalence, current cigar smoking prevalence, current smokeless tobacco use prevalence, and current pipe smoking prevalence. Prevalence of use of each tobacco product was assessed among all adults (respondents aged ≥18 years) and among young adults (respondents aged 18--29 years).
Certain tobacco-related measures were stratified by smoking status, and others were stratified by demographic variables, including race/ethnicity, sex, age group, and education level. Race/ethnicity was categorized as non-Hispanic white, non-Hispanic black or African American, non-Hispanic person of multiple or other races (including Asian, Native Hawaiian or other Pacific Islander, American Indian, Alaska Native, or other race), or Hispanic. For certain measures, age-specific responses were analyzed for adults assigned to one of five age groups: 18--29 years, 30--39 years, 40--49 years, 50--59 years, and ≥60 years. Education-specific responses were analyzed for adults aged ≥25 years and were assigned to one of four categories: some high school or less, graduated from high school or obtained GED (general educational development) equivalent, attended some college but did not graduate, or graduated from college or received higher education.
Results
Survey sample sizes during 2003--2007 ranged from 1,301 (Florida in 2003) to 12,734 (Arkansas in 2006) (Table 1). Survey response rates (number of interviews conducted divided by the number of eligible respondents, including those not interviewed) ranged from 31.5% (Michigan in 2005) to 75.6% (Oklahoma in 2004). Cooperation rates (number of interviews conducted divided by the number of eligible respondents contacted) ranged from 25.6% (New Jersey in 2006) to 100% (Arkansas in 2006).
Tobacco Use
Current Tobacco Use
Respondents aged ≥18 years were asked, "Have you smoked at least 100 cigarettes in your entire life?" Respondents were then asked, "Do you now smoke cigarettes every day, some days, or not at all?" Respondents who reported smoking at least 100 cigarettes in their lifetimes and currently smoking every day or some days were categorized as current smokers. Respondents also were asked whether they had ever smoked or used a tobacco product, including cigars, smokeless tobacco (chewing tobacco or snuff), or pipes. Respondents who reported having ever smoked or used one of these products were asked about current use. Current use of cigars, smokeless tobacco, or a pipe were defined as an answer of "yes" to using any of these products every day or on some days. Prevalence of current tobacco use was calculated for all adults aged ≥18 years and for young adults by age group, race/ethnicity, sex, and education level.
Adults. Among 33 ATSs conducted in 19 states during 2003--2007, current cigarette use by adults ranged from 13.3% (Hawaii in 2006) to 25.4% (West Virginia in 2005) (median: 19.2%) (Table 2). Among 16 ATSs, current cigar use by adults ranged from 3.9% (South Carolina in 2007) to 9.0% (Oklahoma in 2004) (median: 6.4%). Among 24 ATSs, current smokeless tobacco use by adults ranged from 0.9% (Florida in 2007) to 14.2% (Oklahoma in 2004) (median: 3.5%). Among 12 ATSs, current pipe use by adults ranged from 0.5% (South Carolina in 2007) to 4.6% (Oklahoma in 2004) (median: 1.1%).
Data were available from 10 ATSs on current use of all four tobacco products. In these surveys, cigarettes were the most prevalent form of current tobacco use among adults, ranging from 15.7% (Idaho in 2005) to 22.3% (Ohio in 2006) (median: 19.0%) (Table 2). Cigars were the second most prevalent, ranging from 3.9% (South Carolina in 2007) to 9.0% (Oklahoma in 2004) (median: 5.6%). Smokeless tobacco was the third most prevalent, ranging from 2.6% (Michigan in 2005, Iowa in 2006) to 14.2% (Oklahoma in 2004) (median: 3.4%). Pipes were the least prevalent, ranging from 0.5% (South Carolina in 2007) to 4.6% (Oklahoma in 2004) (median: 1.1%).
Young Adults. Among 33 ATSs, current cigarette use by young adults aged 18--29 years ranged from 15.8% (Hawaii in 2006) to 40.4% (West Virginia in 2005) (median: 26.7%) (Table 3). Among 16 ATSs, current cigar use by young adults ranged from 4.4% (South Carolina in 2007) to 14.7% (Ohio in 2006) (median: 10.0%). Among 24 ATSs, current smokeless tobacco use by young adults ranged from 0.7% (Florida in 2007) to 15.0% (Oklahoma in 2004) (median: 4.4%). Among 12 ATSs, current pipe use by young adults ranged from 0.0% (Iowa in 2006) to 3.0% (Ohio in 2006) (median: 1.2%).
Data were available from 10 ATSs on current use of all four tobacco products. In these surveys, cigarettes were the most prevalent form of current tobacco use among young adults, ranging from 18.5% (Idaho in 2005) to 31.7% (Pennsylvania in 2005) (median: 26.6%) (Table 3). Cigars were the second most prevalent, ranging from 4.4% (South Carolina in 2007) to 14.7% (Ohio in 2006) (median: 8.7%). Smokeless tobacco was the third most prevalent, ranging from 1.1% (Iowa in 2006) to 15.0% (Oklahoma in 2004) (median: 4.7%). Pipes were the least prevalent, ranging from 0.0% (Iowa in 2006) to 3.0% (Ohio in 2006) (median: 1.1%).
By Age Group. With the exception of smokeless tobacco use and pipe use, the median prevalence of current use of each tobacco product was consistently highest among adults aged 18--24 years and lowest among adults aged ≥65 years. Among 33 ATSs, current cigarette use by adults aged 18--24 years ranged from 13.9% (Hawaii in 2006) to 40.7% (West Virginia in 2005) (median: 26.6%). Current cigarette use by adults aged ≥65 years ranged from 5.3% (Iowa in 2006) to 13.2% (Oklahoma in 2004) (median: 7.7%) (Table 4). Among 16 ATSs, current cigar use ranged from 4.4% (South Carolina in 2007) to 18.3% (Ohio in 2006) for adults aged 18--24 years (median: 9.9%) and ranged from 0.3% (Iowa in 2004) to 9.6% (Oklahoma in 2004) for adults aged ≥65 years (median: 2.2%) (Table 5).
The median prevalence of current smokeless tobacco use was highest for adults aged 25--44 years and lowest for adults aged ≥65 years (Table 6). Among 24 ATSs, current smokeless tobacco use by adults aged 25--44 years ranged from 1.4% (Florida in 2007; New Jersey in 2006) to 18.2% (Oklahoma in 2004) (median: 5.1%), and current smokeless tobacco use by adults ≥65 years of age ranged from 0.2% (New Jersey in 2006) to 9.4% (Oklahoma in 2004) (median: 1.4%) (Table 6).
Among 12 ATSs, current pipe use by adults aged 45--64 years ranged from 0.6% (Georgia in 2004) to 6.3% (Oklahoma in 2004) (median: 1.3%) (Table 7). Current pipe use by adults aged 25--44 years ranged from 0.3% (South Carolina in 2007) to 2.7% (Oklahoma in 2004) (median: 0.7%).
By Race/Ethnicity. Among 28 ATSs, current cigarette use by non-Hispanic white adults ranged from 14.7% (Montana in 2006) to 25.1% (West Virginia in 2005) (median: 19.4%) (Table 8). Among 19 ATSs, current cigarette use by non-Hispanic black adults ranged from 5.2% (Florida in 2003) to 28.4% (Pennsylvania in 2005) (median: 18.6%). Among 27 ATSs, current cigarette use by non-Hispanic adults of other or multiple races ranged from 9.8% (Florida in 2005) to 46.5% (Montana in 2005) (median: 24.8%). Among 23 ATSs, cigarette use by Hispanic adults ranged from 11.3% (Florida in 2005) to 39.8% (Pennsylvania in 2005) (median: 19.5%).
Among 13 ATSs, the median prevalence of current cigar use was highest among non-Hispanic adults of other or multiple races (9.2%) and lowest among Hispanics (5.9%) (Table 9). The prevalence of current cigar use among non-Hispanic adults of other or multiple races ranged from 6.1% (Kansas in 2006) to 15.2% (Oklahoma in 2004); for Hispanics, current cigar use ranged from 2.0% (Kansas in 2006) to 18.7% (Ohio in 2004). Current cigar use among non-Hispanic white adults ranged from 3.9% (South Carolina in 2007) to 8.6% (Oklahoma in 2004) (median: 6.5%), and current cigar use among non-Hispanic black adults ranged from 1.1% (Kansas in 2006) to 10.9% (Ohio in 2006) (median: 6.1%).
Among 21 ATSs, current smokeless tobacco use by non-Hispanic white adults ranged from 1.0% (Florida in 2007) to 14.4% (Oklahoma in 2004) (median: 3.8%) (Table 10). Among 14 ATSs, current smokeless tobacco use by non-Hispanic black adults ranged from 0.1% (New Jersey in 2006) to 8.9% (Oklahoma in 2004) (median: 1.1%). Among 20 ATSs, current smokeless tobacco use by non-Hispanic adults of other or multiple races ranged from 0.1% (New Jersey in 2006) to 18.9% (West Virginia in 2005) (median: 5.2%); the median was higher than for any other racial or ethnic group. Among 17 ATSs, current smokeless tobacco use by Hispanic adults ranged from 0.3% (New Jersey in 2006) to 18.2% (Wyoming in 2007) (median: 2.1%).
Among nine ATSs, the median prevalence of current pipe use was highest among non-Hispanic adults of other or multiple races, ranging from 0.0% (Pennsylvania in 2005) to 6.9% (Ohio in 2006) (median: 1.9%), and lowest among Hispanics, ranging from 0.0% (Ohio in 2004, Ohio in 2006, Pennsylvania in 2005, and South Carolina in 2007) to 3.1% (Michigan in 2005) (median: 0.3%), and among non-Hispanic blacks, ranging from 0.0% (Ohio in 2006 and Pennsylvania in 2005) to 3.3% (Oklahoma in 2004) (median: 0.3%) (Table 11). Current pipe use by non-Hispanic white adults ranged from 0.4% (South Carolina in 2007) to 5.0% (Oklahoma in 2004) (median: 1.2%).
By Sex. The median prevalence of current use of each tobacco product was higher among men than women. Among 33 ATSs, current cigarette use by men ranged from 13.9% (Hawaii in 2006) to 28.0% (West Virginia in 2005) (median: 20.9%), and current cigarette use by women ranged from 12.7% (Hawaii in 2006) to 23.5% (West Virginia in 2007) (median: 17.4%) (Table 12). Among 16 ATSs, current cigar use by men ranged from 7.2% (South Carolina in 2007) to 14.8% (Ohio in 2006) (median: 11.6%), and current cigar use by women ranged from 0.3% (Iowa in 2006) to 5.3% (Oklahoma in 2004) (median: 1.4%) (Table 13). Among 24 ATSs, current smokeless tobacco use by men ranged from 1.7% (Florida in 2007) to 23.3% (Oklahoma in 2004) (median: 6.9%), and current smokeless tobacco use by women ranged from 0.0% (Iowa in 2006, Michigan in 2005, and New Jersey in 2006) to 5.6% (Oklahoma in 2004) (median: 0.3%) (Table 14). Among 12 ATSs, current pipe use by men ranged from 1.0% (South Carolina in 2007) to 5.5% (Oklahoma in 2004) (median: 2.1%), and current pipe use by women ranged from 0.0% (Iowa in 2004, Iowa in 2006, Pennsylvania in 2005, and South Carolina in 2007) to 3.7% (Oklahoma in 2004) (median: 0.1%) (Table 15).
By Education Level. With the exception of cigar use, the median prevalence of current use of each tobacco product was consistently lower among adults with higher education levels. Among 33 ATSs, median current cigarette use was highest among adults who had some high school education or less (27.6%) and lowest among adults who graduated from college (9.0%) or had some college education (20.9%) (Table 16). The range in prevalence for current cigarette use among adults who had some high school education or less was 19.0% (New Jersey in 2006) to 47.3% (Oklahoma in 2004); the range for adults who graduated from college was 6.8% (Wyoming in 2006) to 12.6% (Florida in 2004 and New Mexico in 2006).
Among 16 ATSs, current cigar use by adults who had some college education but did not graduate from college ranged from 2.2% (South Carolina in 2007) to 13.8% (Oklahoma in 2004) (median: 5.9%) (Table 17). Current cigar use by adults who reported graduating high school only or completing a GED equivalent ranged from 3.5% (Idaho in 2005) to 8.6% (Oklahoma in 2004) (median: 5.3%); current cigar use by adults who graduated from college ranged from 2.1% (Iowa in 2006) to 7.8% (Illinois in 2003) (median: 5.3%).
Among 24 ATSs, the median prevalence of current smokeless tobacco use was highest among adults who had graduated from high school only or completed a GED equivalent (4.4%), ranging from 0.9% (Florida in 2007) to 11.5% (Oklahoma in 2004) (Table 18). The lowest median prevalence for current smokeless tobacco use was among adults who graduated from college (2.0%), ranging from 0.5% (Florida in 2007 and New Jersey in 2006) to 14.4% (Oklahoma in 2004).
Among 12 ATSs, median prevalence of current pipe use was highest among adults who had some high school education or less (1.7%). Current pipe use by adults who had some high school education or less ranged from 0.0% (Iowa in 2004) to 9.3% (Idaho in 2005) (Table 19). Median prevalence of current pipe use was lowest among adults who graduated from college (0.8%). Current pipe use by adults who graduated from college ranged from 0.3% (Iowa in 2004 and Pennsylvania in 2005) to 3.8% (Oklahoma in 2004) (median: 0.8%).
Lifetime Use of Tobacco Products Other than Cigarettes
Adult respondents were asked whether they had ever tried, smoked, or used certain tobacco products (i.e., lifetime use), including cigars, smokeless tobacco, pipes, bidis, and kreteks: "Have you ever smoked a cigar, even one or two puffs?" "Have you ever used or tried any smokeless tobacco products such as chewing tobacco or snuff?" "Have you ever smoked tobacco in a pipe, even one or two puffs?" "A bidi is a flavored cigarette from India. Have you ever smoked a bidi, even one or two puffs?" "Have you ever smoked kreteks, or clove cigarettes, even one or two puffs?" Prevalence of lifetime tobacco use was calculated for adults aged ≥18 years and for young adults aged 18--29 years.
Adults. Among 16 ATSs, the percentage of adults who had ever smoked cigars ranged from 25.7% (Oklahoma in 2004) to 47.3% (Iowa in 2006) (median: 44.2%) (Table 20). In 25 ATSs, the percentage of adults who had ever tried or used smokeless tobacco (chewing tobacco or snuff) ranged from 10.6% (New Jersey in 2006) to 31.9% (Montana in 2005) (median: 19.1%). Among 12 ATSs, the percentage of adults who had ever smoked tobacco through a pipe ranged from 13.2% (Oklahoma in 2004) to 22.2% (Iowa in 2004) (median: 19.9%). Among three ATSs, the percentage of adults who had ever smoked bidis was 2.6% in Kansas in 2006, 4.3% in South Carolina in 2007, and 7.7% in Oklahoma in 2004. In the same three surveys, the percentage of adults who had ever smoked kreteks or clove cigarettes was 7.1% in South Carolina in 2007, 7.9% in Oklahoma in 2004, and 9.9% in Kansas in 2006.
Data were available from three ATSs on lifetime use of each of the five tobacco products. Cigars were the most prevalent form of tobacco use among adults (Kansas in 2006, 45.9%; Oklahoma in 2004, 25.7%; and South Carolina in 2007, 42.4%) (Table 20). Smokeless tobacco use was the second most prevalent (Kansas in 2006, 24.6%; Oklahoma in 2004, 21.7%; and South Carolina in 2007, 17.7%). Pipes were the third most prevalent (Kansas in 2006, 19.8%; Oklahoma in 2004, 13.2%; and South Carolina in 2007, 17.4%). Bidis were the least prevalent form of tobacco use among adults (Kansas in 2006, 2.6%; South Carolina in 2007, 4.3%; and Oklahoma in 2004, 7.7%).
Young Adults. Among 16 ATSs, the percentage of young adults aged 18--29 years who had ever smoked cigars ranged from 26.0% (Oklahoma in 2004) to 51.1% (Ohio in 2006) (median: 44.6%) (Table 21). Among 25 ATSs, the percentage of young adults who had ever tried or used smokeless tobacco ranged from 13.2% (Florida in 2006) to 42.4% (Montana in 2005) (median: 21.9%). Among 12 ATSs, the percentage of young adults who had ever smoked tobacco through a pipe ranged from 4.9% (Oklahoma in 2004) to 13.9% (Iowa in 2004) (median: 9.7%). Among three ATSs, the percentage of young adults who had ever smoked bidis was 5.2% in Oklahoma in 2004, 5.6% in Kansas in 2006, and 9.5% in South Carolina in 2007. In the same three surveys, the percentage of adults who had ever smoked kreteks or clove cigarettes was 5.8% for Oklahoma in 2004, 11.8% for South Carolina in 2007, and 18.9% for Kansas in 2006.
Data were available from three ATSs on lifetime use of each of the five tobacco products. Cigars were the most prevalent form among young adults (Kansas in 2006, 47.0%; Oklahoma in 2004, 26.0%; and South Carolina in 2007, 42.2%) (Table 21). Smokeless tobacco use was the second most prevalent (Kansas in 2006, 26.9%; Oklahoma in 2004, 16.6%; and South Carolina in 2007, 17.8%). Kreteks or clove cigarettes were the third most prevalent (Kansas in 2006, 18.9%; Oklahoma in 2004, 5.8%; and South Carolina, 11.8%). With the exception of Kansas in 2006 (9.2%), pipes were the least prevalent form of lifetime tobacco use among young adults (Oklahoma in 2004, 4.9% and South Carolina in 2007, 6.2%).
Polytobacco Use
Polytobacco use was defined as current use of multiple tobacco products among adults who currently used any tobacco product (cigarettes, cigars, pipe tobacco, or smokeless tobacco). Adult respondents were asked whether they had smoked 100 cigarettes in their lifetimes and if they currently smoked or used 1) cigarettes, 2) cigars, 3) a pipe, or 4) smokeless tobacco every day, some days, or not at all. Prevalence of current polytobacco use was calculated for adults aged ≥18 years and for young adults aged 18--29 years. Among respondents who reported currently using at least one tobacco product, respondents were classified as using one, two, three, or all four tobacco products.
Adults. Among 10 ATSs, among adults using at least one tobacco product, the percentage of adults using only one tobacco product ranged from 78.5% (Oklahoma in 2004) to 87.8% (South Carolina in 2007) (median 82.5%) (Table 22). The percentage of adults using two tobacco products ranged from 10.6% (South Carolina in 2007) to 18.6% (Oklahoma in 2004) (median 14.5%). The percentage of adults using three tobacco products ranged from 1.6% (South Carolina in 2007) to 4.6% (Ohio in 2006) (median 2.9%). The percentage of adults using all four tobacco products ranged from 0.0% (Iowa in 2004, Oklahoma in 2004, and South Carolina in 2007) to 0.6% (Georgia in 2004) (median 0.3%).
Young Adults. Among 10 ATSs, among young adults aged 18--29 years using at least one tobacco product, the percentage using only one tobacco product ranged from 69.7% (Pennsylvania in 2005) to 85.2% (South Carolina in 2007) (median 76.1%) (Table 23). The percentage of young adults using two tobacco products ranged from 13.3% (South Carolina in 2007) to 25.1% (Oklahoma in 2004) (median 17.5%). The percentage of young adults using three tobacco products ranged from 0.0% (Iowa in 2006) to 8.7% (Michigan in 2005) (median 3.3%). The percentage of young adults using all four tobacco products ranged from 0.0% (Iowa in 2004, Iowa in 2006, Idaho in 2005, Oklahoma in 2004, and South Carolina in 2007) to 0.9% (Georgia in 2004 and Michigan in 2005) (median 0.1%).
Dual Use of Smokeless Tobacco and Cigarettes
Dual use of smokeless tobacco and cigarettes among current cigarette smokers was defined as respondents who had smoked 100 cigarettes in their lifetimes and currently smoked every day or some days and who also reported current use of chewing tobacco or snuff every day or on some days. Among 24 ATSs, overall dual use among current cigarette smokers ranged from 2.7% (Florida in 2007) to 17.5% (Oklahoma in 2004) (median: 5.2%) (Table 24).
By Age Group. Among 24 ATSs, the highest median prevalence of current cigarette smokers who reported dual use of cigarettes and smokeless tobacco was among adults aged 30--39 years (8.0%), followed by adults aged 18--29 years (7.3%). Among adults aged 30--39 years, the percentage of current smokers who also reported using smokeless tobacco ranged from 4.1% (New Jersey in 2006) to 19.2% (West Virginia in 2007); among adults aged 18--29 years, the percentage ranged from 1.3% (West Virginia in 2007) to 19.3% (Oklahoma in 2004) (Table 24). Adults aged ≥60 years had the lowest median percentage of current smokers who reported dual use of cigarettes and smokeless tobacco (1.8%); the percentage of current smokers aged ≥60 years who reported dual use of cigarettes and smokeless tobacco ranged from 0.0% (Iowa in 2006 and Idaho in 2005) to 18.4% (Oklahoma in 2004).
Number of Cigarettes Smoked per Day
Current cigarette smokers who smoked every day (daily smokers) were asked, on average, how many cigarettes they smoked per day. Current cigarette smokers who smoked on some days (some-day smokers) and who reported having smoked in the preceding 30 days were asked, on average, how many cigarettes they smoked per day on the days they smoked in the preceding 30 days.
Daily Smokers. Among 32 ATSs, the mean number of cigarettes smoked per day by daily smokers ranged from 14.2 cigarettes (New Mexico in 2006) to 20.6 cigarettes (West Virginia in 2005) (median: 18.0 cigarettes) (Figure 2). The percentage who reported smoking <1--10 cigarettes per day ranged from 23.5% (West Virginia in 2005) to 49.8% (Montana in 2006) (median: 32.2%) (Table 25). The percentage who reported smoking 11--19 cigarettes per day ranged from 8.9% (Florida in 2003) to 20.5% (Montana in 2004) (median: 14.5%). The percentage of daily smokers who reported smoking 20 cigarettes (one pack) per day ranged from 19.6% (Montana in 2006) to 42.5% (Florida in 2003) (median: 35.0%). The percentage of daily smokers who reported smoking ≥21 cigarettes per day ranged from 7.3% (New Mexico) to 26.2% (West Virginia in 2005) (median: 17.7%).
Some-Day Smokers. Among 28 ATSs, the mean number of cigarettes smoked per day by some-day smokers on the days they smoked ranged from 3.7 cigarettes (New Mexico in 2006) to 7.2 cigarettes (West Virginia in 2007) (median: 5.4 cigarettes) (Figure 3). The percentage of some-day smokers who reported smoking <1--10 cigarettes per day on the days they smoked ranged from 87.0% (West Virginia in 2007) to 100.0% (Montana in 2004) (median: 92.4%) (Table 26). The percentage who reported smoking ≥21 cigarettes per day on the days they smoked ranged from 0.0% (Iowa in 2004, Illinois in 2003, Illinois in 2007, Montana in 2004, Montana in 2006, New Mexico in 2003, New Mexico in 2006, and West Virginia in 2005) to 3.3% (Florida in 2004) (median: 1.0%).
Most some-day smokers reported smoking fewer than four cigarettes on the days they smoked (Table 27). The percentage who reported smoking two or fewer cigarettes on the days they smoked ranged from 13.4% (South Carolina in 2007) to 47.9% (Wyoming in 2007) (median: 30.2%). The percentage who reported smoking three to four cigarettes per day on the days they smoked ranged from 16.1% (West Virginia in 2007) to 36.2% (Florida in 2007) (median: 28.8%).
Number of Days Cigarettes Smoked in the Preceding 30 Days
Current some-day smokers were asked how many days in the preceding 30 days they had smoked cigarettes. Among 28 ATSs, the percentage of some-day smokers who reported smoking on 0 days in the preceding 30 days ranged from 0.0% (Alaska in 2003, Iowa in 2004, Idaho in 2005, Illinois in 2003, New Mexico in 2003, Wyoming in 2006) to 6.7% (Michigan in 2005) (median: 2.2%) (Table 28). The percentage who reported smoking on 1--5 days in the preceding 30 days ranged from 6.6% (Florida in 2005) to 33.3% (Idaho in 2005) (median: 22.3%). Among these 28 ATSs, the highest median percentage of some-day smokers reported smoking on 10--15 days in the preceding 30 days (median: 32.4%). The percentage who reported smoking on 10--15 days in preceding 30 days ranged from 22.5% (Florida in 2007) to 40.9% (Iowa in 2004). The percentage who reported smoking on 16--20 days in the preceding 30 days ranged from 8.5% (Pennsylvania in 2005) to 36.5% (Florida in 2005) (median: 20.2%). The percentage who reported smoking on 30 days in the preceding 30 days ranged from 0.8% (Montana in 2004) to 20.9% (Wyoming in 2006) (median: 8.3%).
Time Until First Cigarette in the Morning
Current daily smokers and current some-day smokers were asked how soon after waking in the morning they smoked their first cigarette.
Daily Smokers. Among 30 ATSs, the percentage of current daily smokers who reported smoking their first cigarette within 5 minutes of waking in the morning ranged from 19.2% (Iowa in 2006) to 42.7% (West Virginia in 2005) (median: 27.9%) (Table 29). The percentage who reported smoking their first cigarette 6--30 minutes after waking ranged from 28.4% (New Mexico in 2006) to 41.9% (Idaho in 2005) (median: 35.2%). The percentage who reported smoking their first cigarette 31--60 minutes after waking ranged from 6.9% (West Virginia in 2007) to 23.2% (Oklahoma in 2004) (median: 15.4%). The percentage who reported smoking their first cigarette >60 minutes after waking ranged from 11.0% (Oklahoma in 2004) to 33.4% (New Mexico in 2006) (median: 21.9%).
Some-Day Smokers. Among 26 ATSs, the majority of some-day cigarette smokers reported smoking their first cigarette >60 minutes after waking in the morning, ranging from 45.1% (West Virginia in 2005) to 92.4% (Iowa in 2004) (median: 77.7%) (Table 30). The percentage who reported smoking their first cigarette within 5 minutes of waking in the morning ranged from 0.4% (Hawaii 2006) to 11.0% (Wyoming in 2007) (median: 3.8%). The percentage who reported smoking their first cigarette 6--30 minutes after waking ranged from 1.4% (Iowa in 2004) to 19.2% (West Virginia in 2005) (median: 9.1%). The percentage who reported smoking their first cigarette 31--60 minutes after waking ranged from 3.3% (Florida in 2005) to 29.0% (West Virginia in 2005) (median: 8.5%).
Average Age When First Tried a Cigarette and Began Smoking Regularly
Among six ATSs, young adults aged 18--29 years were asked how old they were the first time they smoked a cigarette, even one or two puffs. In three ATSs, respondents were asked how old they were when they first started smoking cigarettes regularly. The weighted mean age of initiation was calculated for first cigarette and first smoking cigarettes regularly. Means were stratified by whether respondents had smoked 100 cigarettes in their lifetimes.
Among young adults who had smoked 100 cigarettes in their lifetimes, the average age when the first cigarette was smoked ranged from 13.3 years (Idaho in 2005) to 14.5 years (Georgia in 2004 and Ohio in 2004) (median: 14.1 years) (Table 31). Among respondents who had not smoked 100 cigarettes in their lifetimes, the average age when the first cigarette was smoked ranged from 14.8 years (Idaho in 2005) to 16.4 years (Georgia in 2004) (median: 15.5 years). Among three ATSs, among respondents who had smoked 100 cigarettes in their lifetimes, the average age of first smoking cigarettes regularly was 15.7 years (Florida in 2007), 16.0 years (West Virginia in 2005), and 16.4 years (Ohio in 2004) (median: 16.0 years).
Brand of Cigarettes Usually Smoked
Among four ATSs, current cigarette smokers were asked which brand of cigarettes they smoked most often: Benson & Hedges, Camel, Carlton, generic, Kent, Kool, Lucky Strike, Marlboro, Merit, More, Newport, Pall Mall, Salem, Virginia Slims, Winston, or some other brand. The New Jersey 2006 survey also included a question that asked respondents to provide the universal product code (UPC) from their cigarette pack. The UPC was matched to the Cigarette Universal Product Code Database: 2007 Version (9) to identify the brand of cigarette smoked by the respondent. The percentage of respondents who smoked Benson & Hedges, Carlton, Kent, Lucky Strike, Merit, and More brands generally was <1.0%; therefore, these brands (among other cigarette brands) were included in the category of other brands of cigarettes.
Among four ATSs, the four brands of cigarettes smoked most often by current cigarette smokers were Marlboro, ranging from 37.2% (Michigan in 2005) to 50.1% (Montana in 2004) (median: 44.8%); Newport, ranging from 0.2% (Montana in 2004) to 20.5% (New Jersey in 2006) (median: 7.4%); Camel, ranging from 3.4% (New Jersey in 2006) to 14.9% (Montana in 2005) (median: 7.2%); and generic brands, ranging from 0.2% (New Jersey in 2006) to 5.5% (Montana in 2004) (median: 3.1%) (Table 32). Use of other brands ranged from 23.0% (New Jersey in 2006) to 31.2% (Michigan in 2005) (median: 25.6%).
By Sex. Among four ATSs, the largest differences between men and women in brand use were observed for Camel, Marlboro, Salem, Virginia Slims, generic brands, and other brands (Figure 4). Among men, use of other brands of cigarettes ranged from 18.0% (Montana in 2005) to 21.2% (Montana in 2004) (median: 21.5%) and among women, ranged from 24.5% (New Jersey in 2006) to 37.5% (Michigan in 2005) (median: 32.2%). Among men, Marlboro use ranged from 44.9% (Michigan in 2005) to 52.7% (Montana in 2004) (median: 47.9%) and among women, ranged from 28.6% (Michigan in 2005) to 47.6% (Montana in 2004) (median: 40.9%). Among men, Salem use ranged from 0.0% (Montana in 2004 and Montana in 2005) to 2.0% (New Jersey in 2006) (median: 0.4%) and among women, ranged from 1.0% (Montana in 2005) to 3.2% (Michigan in 2005) (median: 2.4%). Among men, Virginia Slims use ranged from 0.0% (Montana in 2005) to 2.4% (Montana in 2004) (median: 0.3%) and among women, ranged from 1.0% (Montana in 2004) to 5.8% (New Jersey in 2006) (median: 3.3%). Among men, Camel brand use ranged from 4.0% (New Jersey in 2006) to 18.4% (Montana in 2005) (median: 8.3%) and among women, ranged from 2.8% (Michigan in 2005 and New Jersey in 2006) to 10.4% (Montana in 2005) (median: 6.1%). Among men, use of generic brand cigarettes ranged from 0.1% (New Jersey in 2006) to 7.6% (Montana in 2004) (median: 4.0%) and among women, ranged from 0.3% (New Jersey in 2006) to 3.5% (Montana in 2004) (median: 1.9%).
By Age Group. Among four ATSs, among named cigarette brands, Marlboro was the most frequently used brand among all age groups (Figure 5). Approximately 50 percent of smokers aged 18--29 years and 30--39 years smoked Marlboro brand cigarettes. Among adults aged 18--29 years, Marlboro use ranged from 44.0% (New Jersey) to 57.0% (Montana in 2004) (median: 50.7%), use of other brands of cigarettes ranged from 9.1% (Montana in 2005) to 18.6% (Montana in 2004) (median: 13.6%), and Newport use ranged from 0.5% (Montana in 2004) to 32.1% (New Jersey in 2006) (median: 13.5%). Among adults aged 30--39 years, Marlboro use ranged from 44.2% (New Jersey in 2006) to 66.5% (Montana in 2004) (median: 54.3%), use of other brands ranged from 9.8% (Montana in 2004) to 26.0% (Michigan in 2005) (median: 20.8%), and Newport use ranged from 0.0% (Montana in 2004) to 24.2% (New Jersey) (median: 11.1%). Marlboro use was most commonly reported among adults aged 40--49 years and adults aged 50--59 years. Marlboro use by adults aged 40--49 years ranged from 36.5% (Michigan in 2005) to 49.2% (Montana in 2005) (median: 44.8%) and Marlboro use by adults aged 50--59 years ranged from 19.6% (Michigan in 2005) to 53.4% (Montana in 2004) (median: 35.8%). Among adults aged ≥60 years, other brand use was most commonly reported and ranged from 31.8% (New Jersey in 2006) to 65.0% (Montana in 2004) (median: 54.5%).
Menthol Cigarette Use
Current cigarette smokers were asked whether they usually smoked menthol cigarettes. Prevalence of menthol cigarette use among current cigarette smokers was stratified by race/ethnicity. Among current cigarette smokers in seven ATSs, the overall prevalence of menthol cigarette use ranged from 16.6% (Kansas in 2006) to 41.1% (South Carolina in 2007) (median: 30.7%) (Table 33).
By Race/Ethnicity. Because of small sample sizes, data on menthol cigarette use were not available for every race/ethnicity and from every ATS. Among seven ATSs, among current cigarette smokers who identified themselves as non-Hispanic white, menthol cigarette use ranged from 14.3% (Oklahoma in 2004) to 34.1% (New Jersey in 2006) (median: 24.3%) (Table 33). Among five ATSs, among current cigarette smokers who identified themselves as non-Hispanic black, prevalence ranged from 78.8% (New Jersey in 2006) to 86.0% (South Carolina in 2007) (median: 81.7%). Among three ATSs, among current cigarette smokers who identified themselves as non-Hispanic other race/multiracial, prevalence of menthol cigarette use was 23.2% in Georgia in 2004, 33.0% in Kansas in 2006, and 35.5% in Michigan in 2005. The percentage of Hispanic smokers who smoked menthol cigarettes was 23.7% in Georgia in 2004 and 10.9% in Kansas in 2006.
Discount Cigarette Use
Current cigarette smokers were asked whether they usually smoked discount cigarettes. Among four ATSs, the proportion of current smokers who smoked discount cigarettes ranged from 17.3% (New Jersey in 2006) to 47.5% (Oklahoma in 2004) (median: 29.1%) (Table 34).
Use of Light Cigarettes
Current cigarette smokers were asked whether they usually smoked light, ultra light, or regular cigarettes. Among six ATSs, among current cigarette smokers, regular cigarette use ranged from 39.8% (Kansas in 2006) to 48.3% (Ohio in 2006) (median: 45.9%); light cigarette use ranged from 39.1% (Michigan in 2005) to 46.4% (New Jersey in 2006) (median: 40.1%) (Table 34); and ultra light cigarette use ranged from 10.6% (New Jersey in 2006) to 17.0% (Kansas in 2006) (median: 13.8%).
Smoking Cessation
Prevalence of Employer-Offered Smoking Cessation Programs
Adults who were employed for wages or self-employed were asked whether their employer had offered any programs to help them stop smoking or any other types of help to employees who wanted to quit smoking in the preceding 12 months. Among 12 ATSs, the percentage of adults (smokers and nonsmokers combined) who reported that their employer offered any cessation programs ranged from 19.7% (New Mexico in 2003) to 28.6% (South Carolina in 2007) (median: 23.4%) (Table 35). The percentage of current smokers who reported employer-offered smoking cessation programs ranged from 13.5% (Idaho in 2005) to 22.5% (Iowa in 2006) (median: 18.4%). The percentage of nonsmokers who reported employer-offered smoking cessation programs ranged from 19.9% (New Mexico in 2003) to 30.9% (South Carolina in 2007) (median: 24.5%).
Companies with >50 Employees. Among five ATSs, the percentage of adults who worked for companies with >50 employees and reported that their employer offered any programs to stop smoking or any other types of help to employees who wanted to quit ranged from 26.3% (Iowa in 2004) to 33.5% (Ohio in 2006) (median: 30.4%) (Table 35). Among current smokers, the percentage ranged from 21.4% (Ohio in 2004) to 27.6% (Iowa in 2006) (median: 23.9%). Among nonsmokers the percentage ranged from 27.1% (Iowa in 2004) to 35.8% (Ohio in 2006) (median: 31.1%).
Companies with ≤50 Employees. Among five ATSs, the percentage of adults who worked for companies with ≤50 employees reported that their employer offered any programs to stop smoking or any other types of help to employees who wanted to quit ranged from 3.9% (Iowa in 2004) to 7.9% (Ohio in 2004) (median: 6.9%) (Table 35). Among current smokers, the percentage ranged from 0.7% (Iowa in 2004) to 13.0% (Ohio in 2004) (median: 7.7%). Among nonsmokers, the percentage ranged from 3.9% (Iowa in 2004) to 8.8% (Georgia in 2004) (median: 6.1%).
Smoking Assessments and Assistance with Smoking Cessation from Health-Care Professionals
Current smokers who reported seeing a health-care professional in the preceding 12 months were asked whether a doctor, a nurse, or another health-care professional had advised them not to smoke. Both nonsmokers and current smokers who reported they had not been advised to stop smoking were asked whether a doctor, a nurse, or another health-care professional had asked whether they smoke. Current smokers who reported that they were advised to quit smoking were asked whether the health-care professional 1) prescribed a patch, inhaler, or pills; 2) suggested a specific date to stop smoking; 3) suggested a smoking cessation class, program, telephone quitline (a telephone-based tobacco cessation service), or counseling; or 4) provided booklets, videos, or other materials to help them quit smoking on their own.
Asked About or Advised to Quit Smoking. Data were available from 18 ATSs on whether health-care professionals asked adults about smoking or advised current smokers to quit. The percentage ranged from 61.8% (Illinois in 2003) to 77.0% (Alaska in 2003) (median: 70.5%) (Table 36).
Advised to Quit Smoking. Data were available from 17 ATSs on whether current smokers who had seen a health-care professional in the preceding 12 months were advised to quit smoking. The percentage ranged from 53.0% (Iowa in 2004) to 76.0% (Florida in 2005) (median: 67.6%) (Table 36).
Recommended a Medication for Smoking Cessation. Data were available from 18 ATSs on whether current smokers who had seen a health-care professional in the preceding 12 months were advised to quit smoking and were recommended a medication for smoking cessation. The percentage ranged from 19.1% (Oklahoma in 2004) to 41.7% (Wyoming in 2007) (median: 30.8%) (Table 36).
Recommended a Specific Date to Stop Smoking. Data were available from 18 ATSs on whether current smokers who had seen a health-care professional in the preceding 12 months were advised to quit smoking and were recommended a specific date to quit smoking. The percentage ranged from 11.6% (Oklahoma in 2004) to 31.5% (Wyoming in 2006) (median: 24.1%) (Table 36).
Received Suggestion for a Smoking Cessation Class, a Program, a Telephone Quitline, or Counseling. Data were available from 17 ATSs on whether current smokers were advised to quit smoking by a health-care professional by suggesting a smoking cessation class, quitline, or counseling for smoking cessation. The percentage ranged from 10.3% (Illinois in 2003) to 38.3% (Wyoming in 2006) (median: 17.5%) (Table 36).
Received Suggestion for Self-Help Material for Smoking Cessation. Data were available from 18 ATSs on whether current smokers were assisted by a health-care professional in quitting smoking by suggesting self-help material, such as booklets, videos, or other materials for smoking cessation. The percentage ranged from 14.0% (Oklahoma in 2004) to 30.1% (Wyoming in 2006) (median: 22.7%) (Table 36).
Smoking Cessation Attempts and Awareness of Assistance to Quit Smoking
Current cigarette smokers were asked about their intention to quit smoking and their awareness of assistance available to help them quit smoking. Current cigarette smokers were asked whether they expected to ever quit smoking. Current cigarette smokers also were asked whether they were seriously considering quitting within the next 6 months. Respondents who reported they were seriously considering stopping smoking within 6 months were then asked whether they were planning to stop smoking within the next 30 days. Current cigarette smokers were asked whether they were aware of assistance that might be available to help them quit smoking (including telephone quitlines, local health clinic services, and other state programs). Finally, current smokers were asked whether in the preceding 12 months they stopped smoking for ≥1 day because they were trying to quit smoking.
Expectation to Quit. Data were available from 10 ATSs on current smokers' expectations to ever quit smoking. The percentage ranged from 59.2% (Illinois in 2007) to 84.7% (South Carolina in 2007) (median: 79.3%) (Table 37).
Quitting Within the Next 6 Months. Data were available from 31 ATSs on the percentage of smokers who were seriously considering stopping smoking within the next 6 months. The percentage ranged from 49.8% (Iowa in 2006) to 66.7% (Alaska in 2003) (median: 58.4%) (Table 37).
Quitting Within the Next 30 Days. Data were available from 33 ATSs on the percentage of smokers who were planning to stop smoking within the next 30 days. The percentage ranged from 19.4% (Iowa in 2006) to 48.3% (Michigan in 2005) (median: 26.6%) (Table 37).
Awareness of Assistance to Quit. Data were available from 11 ATSs on smokers' awareness of assistance available to help them quit smoking. The percentage ranged from 51.7% (Oklahoma in 2004) to 89.6% (Hawaii in 2006) (median: 79.3%) (Table 37).
Smoking Cessation Attempts in the Preceding 12 Months. Data were available from 31 ATSs on attempts to quit smoking made in the preceding 12 months. The percentage ranged from 41.5% (Iowa in 2006) to 54.6% (Ohio in 2004) (median: 46.8%) (Table 37).
Use of Medications for Smoking Cessation
Current smokers who made an attempt to quit smoking within the preceding year and former smokers who quit within the preceding year were asked whether they used the nicotine patch, nicotine gum, or any other medication to help them quit the last time they tried to quit smoking or when they quit smoking. Current and former smokers who reported they used any of these products to help them quit smoking were then asked whether they used 1) bupropion, Wellbutrin, or Zyban; 2) nicotine gum; 3) a nicotine patch; 4) nasal spray; 5) nicotine lozenges; 6) an inhaler; or 7) some other medication to help them quit smoking. In 29 ATSs, the percentage of current and former smokers who reported using medications to help them quit smoking ranged from 19.5% (New Mexico in 2006) to 40.9% (Montana in 2005) (median: 27.7%) (Table 38).
Bupropion, Wellbutrin, or Zyban. Data were available from 10 ATSs on the use of bupropion, Wellbutrin, or Zyban for smoking cessation. The percentage of current and former smokers who reported using these drugs ranged from 20.3% (Wyoming in 2007) to 39.0% (Illinois in 2003) (median: 26.0%) (Table 38).
Nicotine Gum. Data were available from 10 ATSs on the use of nicotine gum for smoking cessation. The percentage of current and former smokers who reported using nicotine gum ranged from 8.9% (South Carolina in 2007) to 45.9% (Wyoming in 2006) (median: 27.9%) (Table 38).
Nicotine Patch. Data were available from 10 ATSs on the use of a nicotine patch for smoking cessation. The percentage of current and former smokers who reported using a nicotine patch ranged from 43.4% (South Carolina in 2007) to 68.3% (Wyoming in 2006) (median: 56.7%) (Table 38).
Nasal Spray. Data were available from 10 ATSs on the use of a nicotine nasal spray for smoking cessation. The percentage of current and former smokers who reported using a nicotine nasal spray ranged from 0.0% (Illinois in 2007) to 9.2% (Wyoming in 2004) (median: 1.5%) (Table 38).
Nicotine Lozenges. Data were available from nine ATSs on the use of nicotine lozenges for smoking cessation. The percentage of current and former smokers who reported using nicotine lozenges ranged from 2.1% (Illinois in 2003) to 19.0% (Wyoming in 2007) (median: 10.5%) (Table 38).
Inhaler. Data were available from nine ATSs on the use of a nicotine inhaler for smoking cessation. The percentage of current and former smokers who reported using a nicotine inhaler ranged from 1.5% (West Virginia in 2007) to 9.3% (Idaho in 2005) (median: 7.9%) (Table 38).
Other Medications. Data were available from 10 ATSs on the use of other medications for smoking cessation. The percentage of current and former smokers who reported using other medications ranged from 4.1% (Idaho in 2005) to 25.7% (South Carolina in 2007) (median: 13.5%) (Table 38).
Use of Other Smoking Cessation Methods
Current smokers who made an attempt to quit smoking within the preceding year and former smokers who quit within the preceding year were asked whether they used any other assistance such as classes or counseling to help them quit in the preceding year the last time they tried to quit. Among 26 ATSs, the percentage of current and former smokers who used any other assistance ranged from 1.9% (Montana in 2004) to 7.5% (Wyoming in 2007) (median: 3.9%) (Table 39).
Secondhand Smoke and Level of Support for Policies that Limit Smoking and Tobacco Use
Respondents were asked whether they thought that smoking should be allowed in all areas, in some areas, or not at all in 1) workplaces, 2) restaurants, 3) shopping malls, 4) public buildings, 5) bars and cocktail lounges, and 6) indoor sporting events and concerts. Respondents in nine ATSs were asked whether they would support a law making restaurants smoke-free in their community. Respondents in 15 ATSs were asked whether a total ban on smoking in restaurants would cause them to eat out more, cause them to eat out less, or make no difference in how frequently they ate out. Respondents in five ATSs were asked whether in the preceding year, they chose not to go to a particular restaurant because they knew smoking was permitted; respondents in the same five ATSs also were asked whether in the preceding year, they chose not to go to a particular restaurant because they knew smoking was not permitted. Responses were stratified by smoking status (smoker and nonsmoker). State smoke-free laws at the time of survey also were examined and were obtained from the State Tobacco Activities Tracking and Evaluation (STATE) System (available at http://www.cdc.gov/tobacco/statesystem). Only statewide (not local) smoke-free ordinances were examined.
Respondents also were asked whether they strongly agreed, agreed, disagreed, or strongly disagreed with the statement that tobacco use by adults should not be allowed on school grounds or at any school event. Data were available from 12 ATSs on level of support for creating tobacco-free policies in schools
Level of Support for Smoke-Free Policies in Workplaces
Among 29 ATSs, the percentage of adults who reported that smoking in workplaces should be allowed in all areas ranged from 1.0% (Iowa in 2004) to 4.9% (West Virginia in 2005) (median: 2.2%) (Table 40). The percentage of adults who reported that smoking in workplaces should be allowed in some areas ranged from 13.0% (Hawaii in 2006) to 33.5% (West Virginia in 2005) (median: 20.5%). The percentage of adults who reported that smoking in workplaces should not be allowed at all ranged from 61.6% (West Virginia in 2005) to 85.0% (Hawaii in 2006) (median: 77.6%).
Smokers. Among 29 ATSs, the percentage of smokers who reported that smoking in workplaces should be allowed in all areas ranged from 2.8% (Iowa in 2004 and Oklahoma in 2004) to 9.6% (Ohio in 2004) (median: 5.0%) (Table 40). The percentage of smokers who reported that smoking in workplaces should not be allowed at all ranged from 32.0% (West Virginia in 2005) to 64.7% (New Mexico in 2006) (median: 50.0%).
Nonsmokers. Among 29 ATSs, the percentage of nonsmokers who reported that smoking in workplaces should be allowed in all areas ranged from 0.5% (Iowa in 2004 and Iowa in 2006) to 4.1% (West Virginia in 2005) (median: 1.5%) (Table 40). The percentage of nonsmokers who reported that smoking in workplaces should not be allowed at all ranged from 71.6% (West Virginia in 2005) to 89.1% (Hawaii in 2006) (median: 83.2%).
Level of Support for Smoke-Free Policies in Restaurants
Among 29 ATSs, the percentage of adults who reported that smoking in restaurants should be allowed in all areas ranged from 0.6% (Kansas in 2006) to 3.5% (New Jersey in 2006) (median: 1.2%) (Table 41). The percentage of adults who reported that smoking in restaurants should be allowed in some areas ranged from 16.4% (Hawaii in 2006) to 44.7% (Illinois in 2003) (median: 33.6%). The percentage of adults who reported that smoking in restaurants should not be allowed at all ranged from 54.0% (Pennsylvania in 2005) to 82.4% (Hawaii in 2006) (median: 65.5%).
Among nine ATSs, the percentage of adults who reported that they would support a smoke-free law for restaurants ranged from 66.5% (Ohio in 2004) to 76.1% (Kansas in 2006) (median: 72.8%) (Table 42). Five states had smoke-free laws in place at the time of survey that either banned smoking or restricted smoking to designated areas in the indoor dining area of restaurants. Among the five states with a smoke-free policy in place for restaurants at the time of survey, the percentage of adults who supported a smoke-free law for restaurants ranged from 68.3% (Ohio in 2006) to 76.1% (Kansas in 2006) (median: 72.8%). Similarly, among the four states without a smoke-free policy in place for restaurants at the time of survey, the percentage of adults who supported a smoke-free law for restaurants ranged from 66.5% (Ohio in 2004) to 76.0% (Georgia in 2004) (median: 71.6%).
Among 15 ATSs, the percentage of adults who reported that they would eat out more if smoking in restaurants were totally banned ranged from 8.1% (Iowa in 2004) to 25.0% (New Mexico in 2006) (median: 14.0%) (Table 42). The percentage of adults who reported that a total ban on smoking in restaurants would make no difference in how often they ate out ranged from 69.4% (New Mexico in 2006) to 87.1% (Iowa in 2004) (median: 79.3%). The percentage of adults who reported that they would eat out less if smoking in restaurants were totally banned ranged from 3.3% (Idaho in 2005) to 10.4% (Ohio in 2004) (median: 7.1%).
Among five ATSs, the percentage of adults who reported that in the preceding year they chose not to go to a particular restaurant because they knew smoking was permitted ranged from 13.2% (Iowa in 2004) to 20.0% (Idaho in 2005) (median: 17.7%) (Table 43). The percentage of adults who reported that they chose not to go to a particular restaurant in the preceding year because they knew smoking was not permitted ranged from 5.7% (Iowa in 2004) to 8.5% (Idaho in 2005) (median: 7.2%).
Smokers. Among 29 ATSs, the percentage of current smokers who reported that smoking in restaurants should be allowed in all areas ranged from 1.2% (South Carolina in 2007) to 9.3% (New Jersey in 2006) (median: 2.7%) (Table 41). The percentage of smokers who reported that smoking in restaurants should not be allowed at all ranged from 19.0% (Illinois in 2003) to 62.6% (Hawaii in 2006) (median: 34.0%).
Among nine ATSs, the percentage of smokers who reported that they would support a smoke-free law for restaurants ranged from 31.9% (Ohio in 2004) to 49.6% (Georgia in 2004) (median: 41.4%) (Table 42). Among the five states with a smoke-free policy in place for restaurants at the time of survey, the percentage of smokers who reported they would support a smoke-free law for restaurants ranged from 35.1% (Ohio in 2006) to 43.9% (Kansas in 2006) (median: 41.4%). Similarly, among the four states without a smoke-free policy in place for restaurants at time of survey, the percentage of smokers who reported they would support a smoke-free law for restaurants ranged from 31.9% (Ohio in 2004) to 49.6% (Georgia in 2004) (median: 42.4%).
Among 15 ATSs, the percentage of smokers who reported that they would eat out more if smoking in restaurants were totally banned ranged from 1.1% (Ohio in 2006) to 6.5% (New Mexico in 2006) (median: 2.3%) (Table 42). The percentage of smokers who reported that a total ban on smoking in restaurants would make no difference in how often they ate out ranged from 62.2% (Ohio in 2004) to 82.1% (Idaho in 2005) (median: 70.2%). The percentage of smokers who reported they would eat out less if smoking in restaurants were totally banned ranged from 13.6% (New Mexico in 2006) to 35.5% (Ohio in 2004) (median: 27.8%).
Among five ATSs, the percentage of smokers who reported that in the preceding year, they chose not to go to a particular restaurant because they knew smoking was not permitted ranged from 17.4% (South Carolina in 2007) to 23.2% (Iowa in 2006) (median: 18.9%) (Table 43).
Nonsmokers. Among 29 ATSs, the percentage of nonsmokers who reported that smoking in restaurants should be allowed in all areas ranged from 0.4% (Alaska in 2003, Iowa in 2004, Idaho in 2005, and Montana in 2005) to 2.7% (New Jersey in 2006) (median: 0.8%) (Table 41). The percentage of nonsmokers who reported that smoking in restaurants should not be allowed at all ranged from 62.5% (Illinois in 2003) to 85.4% (Hawaii in 2006) (median: 72.3%).
Among nine ATSs, the percentage of nonsmokers who reported that they would support a smoke-free law for restaurants ranged from 74.2% (Wyoming in 2004) to 83.3% (South Carolina in 2007) (median: 79.8%) (Table 42). Among the five states with a smoke-free law in place in restaurants at the time of survey, the percentage of nonsmokers who reported they would support a smoke-free law for restaurants ranged from 77.5% (Illinois in 2003) to 82.6% (Kansas in 2006) (median: 79.8%). Similarly, among the four states without a smoke-free policy for restaurants at the time of survey, the percentage of nonsmokers who reported they would support a smoke-free law for restaurants ranged from 74.2% (Wyoming in 2004) to 83.3% (South Carolina in 2007) (median: 79.0%).
Among 15 ATSs, the percentage of nonsmokers who reported that they would eat out more if smoking in restaurants were totally banned ranged from 9.8% (Iowa in 2004) to 29.6% (New Mexico in 2006) (median: 17.0%) (Table 42). The percentage of nonsmokers who reported that a total ban on smoking in restaurants would make no difference in how often they ate out ranged from 66.8% (New Mexico in 2006) to 88.6% (Iowa in 2004) (median: 81.0%).The percentage of nonsmokers who reported they would eat out less if smoking in restaurants were totally banned ranged from 0.9% (Idaho in 2005) to 4.1% (Georgia in 2004) (median: 2.2%).
Among five ATSs, the percentage of nonsmokers who reported that in the preceding year, they chose not to go to a particular restaurant because they knew smoking was permitted ranged from 15.6% (Iowa in 2004) to 22.8% (Idaho in 2005) (median: 20.8%) (Table 43). The percentage of nonsmokers who reported that in the preceding year, they chose not to go to a particular restaurant because they knew smoking was not permitted ranged from 2.5% (Iowa in 2004) to 6.3% (Idaho in 2005) (median: 4.8%).
Level of Support for Smoke-Free Policies in Shopping Malls
Among 21 ATSs, the percentage of adults who reported that smoking in indoor shopping malls should be allowed in all areas ranged from 0.5% (Idaho in 2005) to 3.2% (New Jersey in 2006) (median: 1.0%) (Table 44). The percentage of adults who reported that smoking in indoor shopping malls should be allowed in some areas ranged from 16.0% (New Jersey in 2006) to 34.1% (Ohio in 2004) (median: 23.5%). The percentage of adults who reported that smoking in indoor shopping malls should not be allowed at all ranged from 63.8% (Ohio in 2004) to 82.5% (Idaho in 2005) (median: 75.4%).
Among the 21 ATSs, seven states had a smoke-free policy in place for indoor shopping malls at the time of survey. The median percentage of adults who reported that smoking should not be allowed at all in indoor shopping malls was lower in the states without smoke-free policies for indoor shopping malls, ranging from 63.8% (Ohio in 2004) to 82.2% (Florida in 2007) (median: 73.5%), than the median percentage of adults in states with a smoke-free policy in place for indoor shopping malls, ranging from 72.1% (Oklahoma in 2004) to 82.5% (Idaho in 2005) (median: 78.8%) (Table 44).
Smokers. Among 21 ATSs, the percentage of smokers who reported that smoking in indoor shopping malls should be allowed in all areas ranged from 0.4% (Montana in 2004) to 5.7% (New Jersey in 2006) (median: 2.0%) (Table 44). The percentage of smokers who reported that smoking in indoor shopping malls should not be allowed at all ranged from 47.0% (Ohio in 2004) to 74.0% (Idaho in 2005) (median: 63.0%).
The percentage of smokers who reported that smoking should not be allowed at all in indoor shopping malls was lower in the states without smoke-free policies for indoor shopping malls, ranging from 47.0% (Ohio in 2004) to 73.4% (Florida in 2007) (median: 61.7%), than the median percentage of smokers in states with smoke-free policies in place for indoor shopping malls, ranging from 57.0% (Oklahoma in 2004) to 74.0% (Idaho in 2005) (median: 68.1%) (Table 44).
Nonsmokers. Among 21 ATSs, the percentage of nonsmokers who reported that smoking in indoor shopping malls should be allowed in all areas ranged from 0.2% (Idaho in 2005) to 2.8% (New Jersey in 2006) (median: 0.7%) (Table 44). The percentage of nonsmokers who reported that smoking in indoor shopping malls should not be allowed at all ranged from 68.4% (Ohio in 2004) to 84.1% (Idaho in 2005) (median: 78.7%).
The percentage of nonsmokers who reported that smoking should not be allowed at all in indoor shopping malls was lower in the states without smoke-free policies for indoor shopping malls, ranging from 68.4% (Ohio in 2004) to 84.0% (Florida in 2007) (median: 76.1%), than the percentage of nonsmokers in states with smoke-free policies in place for indoor shopping malls, ranging from 76.1% (Oklahoma in 2004) to 84.1% (Idaho in 2005) (median: 80.9%) (Table 44).
Level of Support for Smoke-Free Policies in Public Buildings
Among 12 ATSs, the percentage of adults who reported that smoking in public buildings should be allowed in all areas ranged from 0.4% (Idaho in 2005 and South Carolina in 2007) to 2.0% (Ohio in 2004) (median: 0.8%) (Table 45). The percentage of adults who reported that smoking in public buildings should be allowed in some areas ranged from 21.6% (Idaho in 2005) to 35.9% (Ohio in 2004) (median: 26.6%). The percentage of adults who reported that smoking in public buildings should not be allowed at all ranged from 62.0% (Ohio in 2004) to 78.0% (Idaho in 2005) (median: 72.6%).
Smokers. Among 12 ATSs, the percentage of smokers who reported that smoking in public buildings should be allowed in all areas ranged from 0.4% (Iowa in 2004 and South Carolina in 2007) to 3.8% (Ohio in 2004) (median: 1.4%) (Table 45). The percentage of smokers who reported that smoking at public buildings should not be allowed at all ranged from 39.7% (Ohio in 2004) to 63.9% (New Mexico in 2006) (median: 52.0%).
Nonsmokers. Among 12 ATSs, the percentage of nonsmokers who reported that smoking in public buildings should be allowed in all areas ranged from 0.2% (Idaho in 2005) to 1.5% (Ohio in 2004) (median: 0.5%) (Table 45). The percentage of nonsmokers who reported that smoking in public buildings should not be allowed at all ranged from 68.1% (Ohio in 2004) to 81.7% (Montana in 2006) (median: 77.0%).
Level of Support for Smoke-Free Policies in Bars and Cocktail Lounges
Among 17 ATSs, the percentage of adults who reported that smoking in bars and cocktail lounges should be allowed in all areas ranged from 15.0% (Kansas in 2006) to 24.7% (Ohio in 2006) (median: 18.5%) (Table 46). The percentage of adults who reported that smoking in bars and cocktail lounges should be allowed in some areas ranged from 39.2% (New Jersey in 2006) to 53.0% (Iowa in 2004) (median: 48.3%). The percentage of adults who reported that smoking in bars and cocktail lounges should not be allowed at all ranged from 26.6% (Iowa in 2004) to 44.2% (New Jersey in 2006) (median: 33.1%).
Among these 17 ATSs, two states had smoke-free laws for bars and cocktail lounges at the time of survey. Among the 15 ATSs without a smoke-free policy for bars and cocktail lounges, the percentage of adults who reported smoking should not be allowed at all in bars and cocktail lounges ranged from 26.6% (Iowa in 2004) to 37.9% (Wyoming in 2007) (median: 33.1%) (Table 46). In New Jersey and Ohio, which banned smoking in bars and cocktail lounges in 2006, the percentage of adults who reported smoking should not be allowed at all in bars and cocktail lounges was 44.2% in New Jersey in 2006 and 29.2% in Ohio in 2006.
Smokers. Among 17 ATSs, the percentage of smokers who reported that smoking in bars and cocktail lounges should be allowed in all areas ranged from 38.8% (Wyoming in 2006) to 52.0% (Wyoming in 2004) (median: 45.6%) (Table 46). The percentage of smokers who reported that smoking in bars and cocktail lounges should not be allowed at all ranged from 4.4% (Wyoming in 2007) to 11.0% (Georgia in 2004) (median: 6.7%).
Among the 15 ATSs representing states without a smoke-free policy in place for bars and cocktail lounges, the percentage of smokers who reported smoking should not be allowed at all in bars and cocktail lounges ranged from 4.4% (Wyoming in 2007) to 11.0% (Georgia in 2004) (median: 6.7%) (Table 46). In New Jersey and Ohio, which both banned smoking in bars and cocktail lounges in 2006, the percentage of smokers who reported smoking should not be allowed at all in bars and cocktail lounges was 8.2% in New Jersey in 2006 and 4.7% in Ohio in 2006.
Nonsmokers. Among 17 ATSs, the percentage of nonsmokers who reported that smoking in bars and cocktail lounges should be allowed in all areas ranged from 9.5% (Kansas in 2006) to 16.9% (Ohio in 2006) (median: 12.8%) (Table 46). The percentage of nonsmokers who reported that smoking in bars and cocktail lounges should not be allowed at all ranged from 32.2% (Iowa in 2004) to 49.9% (New Jersey in 2006) (median: 39.0%).
Among the 15 ATSs representing states without a smoke-free policy in place for bars and cocktail lounges, the percentage of nonsmokers who reported smoking should not be allowed at all in bars and cocktail lounges ranged from 32.2% (Iowa in 2004) to 46.5% (Wyoming in 2007) (median: 39.0%) (Table 46). In New Jersey and Ohio, which banned smoking in bars and cocktail lounges in 2006, the percentage of nonsmokers who reported smoking should not be allowed at all in bars and cocktail lounges was 49.9% for New Jersey in 2006 and 36.6% for Ohio in 2006.
Level of Support for Smoke-Free Policies at Indoor Sporting Events and Concerts
Among eight ATSs, the percentage of adults who reported that smoking at indoor sporting events and concerts should be allowed in all areas ranged from 1.0% (Idaho in 2005) to 2.8% (Arkansas in 2006) (median: 1.7%) (Table 47). The percentage of adults who reported that smoking at indoor sporting events and concerts should be allowed in some areas ranged from 16.3% (Montana in 2006) to 25.2% (New Mexico in 2003) (median: 22.2%). The percentage of adults who reported that smoking at indoor sporting events and concerts should not be allowed at all ranged from 72.1% (New Mexico in 2003) to 82.5% (Montana in 2006) (median: 75.9%).
In these eight ATSs, six states had smoke-free laws in place for indoor sporting events and concerts at the time of survey. In the two ATSs representing states without smoke-free policies for indoor sporting events and concerts at the time of survey, the percentage of adults who reported smoking should not be allowed at all at indoor sporting events and concerts was 73.6% for Georgia in 2004 and 72.1% for New Mexico in 2003 (Table 47). In the six states that had smoke-free policies in place for indoor sporting events, the percentage of adults who reported smoking should not be allowed at all at indoor sporting events and concerts ranged from 75.2% (Arkansas in 2006) to 82.5% (Montana in 2006) (median: 76.5%).
Smokers. Among eight ATSs, the percentage of smokers who reported that smoking at indoor sporting events and concerts should be allowed in all areas ranged from 3.2% (Idaho in 2005) to 6.7% (New Mexico in 2003) (median: 4.7%) (Table 47). The percentage of smokers who reported that smoking at indoor sporting events and concerts should not be allowed at all ranged from 51.1% (Iowa in 2004) to 59.4% (Montana in 2006) (median: 56.5%).
In the two states without smoke-free policies for indoor sporting events and concerts at the time of survey, the percentage of smokers who reported smoking should not be allowed at all at indoor sporting events and concerts was 55.1% for Georgia in 2004 and 56.0% for New Mexico in 2003 (Table 47). In the six states that had smoke-free policies in place for indoor sporting events, the percentage of smokers who reported smoking should not be allowed at all at indoor sporting events and concerts ranged from 51.1% (Iowa in 2004) to 59.4% (Montana in 2006) (median: 57.5%).
Nonsmokers. Among eight ATSs, the percentage of nonsmokers who reported that smoking at indoor sporting events and concerts should be allowed in all areas ranged from 0.5% (Iowa in 2006 and Montana in 2006) to 1.8% (New Mexico in 2003) (median: 1.1%) (Table 47). The percentage of nonsmokers who reported that smoking at indoor sporting events and concerts should not be allowed at all ranged from 76.0% (New Mexico in 2003) to 87.1% (Montana in 2006) (median: 80.5%). The median percentage of nonsmokers (80.6%) who reported smoking should not be allowed at all at indoor sporting events and concerts was higher than the median percentage of smokers (56.5%) who reported smoking should not be allowed at all.
In the two states without smoke-free policies for indoor sporting events and concerts at the time of survey, the percentage of nonsmokers who reported smoking should not be allowed at all at indoor sporting events and concerts was 77.7% for Georgia in 2004 and 76.0% for New Mexico in 2003 (Table 47). In the six states that had smoke-free policies in place for indoor sporting events, the percentage of nonsmokers who reported smoking should not be allowed at all at indoor sporting events and concerts ranged from 80.2% (Iowa in 2006) to 87.1% (Montana in 2006) (median: 80.8%).
Level of Support for Tobacco-Free Policies in Schools
The percentage of adults who reported they strongly agreed with the statement that tobacco use by adults should not be allowed on school grounds ranged from 49.7% (Iowa in 2004) to 77.2% (Montana in 2005) (median: 65.7%) (Table 48). The percentage of adults who agreed ranged from 15.8% (Montana in 2005) to 42.9% (Iowa in 2004) (median: 24.9%). The percentage of adults who disagreed that tobacco use by adults should not be permitted on school grounds ranged from 4.0% (Montana in 2005) to 9.0% (Ohio in 2006) (median: 6.0%). The percentage of adults who strongly disagreed ranged from 0.9% (Iowa in 2004) to 3.0% (Montana in 2005) (median: 1.7%).
Smokers. Among 12 ATSs, the percentage of smokers who strongly agreed with the statement that tobacco use by adults should not be allowed on school grounds ranged from 40.3% (Iowa in 2004) to 60.7% (Montana in 2004) (median: 50.8%) (Table 48). The percentage of smokers who agreed ranged from 25.9% (Montana in 2004) to 45.7% (Kansas in 2006) (median: 30.6%). The percentage of smokers who disagreed that tobacco use by adults should not be permitted on school grounds ranged from 8.4% (New Mexico in 2003) to 18.6% (Ohio in 2006) (median: 12.5%). The percentage of smokers who strongly disagreed ranged from 1.4% (Kansas in 2006) to 5.3% (Michigan in 2005) (median: 3.6%).
Nonsmokers. Among 12 ATSs, the percentage of nonsmokers who strongly agreed with the statement that tobacco use by adults should not be permitted on school grounds ranged from 52.2% (Iowa in 2004) to 81.9% (Montana in 2005) (median: 70.3%) (Table 48). The percentage of nonsmokers who agreed ranged from 12.9% (Montana in 2005) to 42.4% (Iowa in 2004) (median: 23.4%). The percentage of nonsmokers who disagreed that tobacco use by adults should not be permitted on school grounds ranged from 2.6% (Montana in 2005) to 6.2% (Ohio in 2006) (median: 4.4%). The percentage of nonsmokers who strongly disagreed ranged from 0.5% (Oklahoma in 2004) to 2.6% (Montana in 2005) (median: 1.6%).
Secondhand Smoke Exposure in Workplaces, Homes, and Cars and Smoke-Free Policies in Workplaces and Homes
Perceptions of the Health Effects of Secondhand Smoke
Respondents were asked whether they thought that breathing smoke from other persons' cigarettes was very harmful to a person's health, somewhat harmful to a person's health, not very harmful to a person's health, or not harmful at all to a person's health. Responses were stratified by smoking status (smoker and nonsmoker).
Among 32 ATSs, the percentage of respondents who thought that breathing other persons' smoke was very harmful to a person's health ranged from 53.1% (Florida in 2003) to 71.2% (Oklahoma in 2004) (median: 62.0%) (Table 49). The percentage who thought that breathing other persons' smoke was somewhat harmful ranged from 22.4% (Oklahoma in 2004) to 39.5% (Illinois in 2005) (median: 31.6%). The percentage who thought that breathing other persons' smoke was not very harmful ranged from 3.2% (Oklahoma in 2004) to 8.6% (Florida in 2003) (median: 4.6%). The percentage who thought that breathing other persons' smoke was not harmful at all ranged from 1.2% (Wyoming in 2006) to 3.5% (Florida in 2003) (median: 2.3%).
Smokers. Among 32 ATSs, the percentage of smokers who thought that breathing other persons' smoke was very harmful to a person's health ranged from 25.1% (Florida in 2003) to 47.4% (Alaska in 2003) (median: 38.0%) (Table 49). The percentage of smokers who thought that breathing other persons' smoke was somewhat harmful ranged from 36.5% (Hawaii in 2006) to 60.2% (Iowa in 2006) (median: 45.3%). The percentage of smokers who thought that breathing other persons' smoke was not very harmful ranged from 6.3% (Florida in 2006) to 18.5% (Florida in 2003) (median: 10.5%). The percentage of smokers who thought that breathing other persons' smoke was not harmful at all ranged from 2.0% (Wyoming in 2006) to 9.5% (New Mexico in 2006) (median 5.6%).
Nonsmokers. Among 32 ATSs, the percentage of nonsmokers who reported that breathing other persons' smoke was very harmful to a person's health ranged from 58.5% (Illinois in 2003) to 78.2% (Oklahoma in 2004) (median: 67.8%) (Table 49). The percentage of nonsmokers who reported that breathing other persons' smoke was somewhat harmful ranged from 18.6% (Oklahoma in 2004) to 36.2% (Illinois in 2005) (median: 27.9%). The percentage of nonsmokers who reported that breathing other persons' smoke was not very harmful ranged from 1.6% (Oklahoma in 2004) to 5.5% (Florida in 2003) (median: 3.3%). The percentage of nonsmokers who reported that breathing other persons' smoke was not harmful at all ranged from 0.7% (Montana in 2004) to 2.6% (Hawaii in 2006) (median: 1.5%).
Secondhand Smoke Exposure and Smoke-Free Policies in Workplaces
Respondents who were employed part time or full time or were self-employed and who worked indoors most of the time were asked whether smoking was allowed in all areas, some areas, or not at all in work areas, as well as all indoor public or common areas at work. Respondents were then asked whether anyone had smoked in their work area in the preceding 7 days. To assess perceived compliance with smoke-free policies in workplaces, the percentage of persons who reported that smoking was not allowed in their work area but still reported that someone had smoked in their work area in the preceding 7 days was assessed. Finally, respondents who were employed part time or full time or were self-employed and who worked indoors most of the time were asked whether they preferred a stronger workplace smoking policy, a weaker workplace smoking policy, or no change to their workplace smoking policy. Estimates were calculated for employed respondents without a smoke-free policy in their workplace and for employed respondents without a smoke-free policy in the public indoor and common areas of their work.
Work Areas. Among 29 ATSs, the percentage of employed respondents who reported smoking was not allowed in any work areas ranged from 74.3% (South Carolina in 2007) to 89.6% (Montana in 2006) (median: 79.0%) (Table 50). The percentage who reported smoking was allowed in some work areas ranged from 5.6% (Montana in 2006) to 18.6% (West Virginia in 2007) (median: 13.1%). The percentage who reported smoking was allowed in all work areas ranged from 0.5% (Hawaii in 2006) to 3.2% (West Virginia in 2005) (median: 1.6%). The percentage of employed adults who reported having no official smoking policy at their workplace ranged from 2.2% (Florida in 2003) to 9.1% (Montana in 2004) (median: 5.9%).
Public Indoor or Common Areas. Among 27 ATSs, the percentage of employed adults who reported that smoking was not allowed in any public indoor or common area at their workplace ranged from 74.7% (Ohio in 2004) to 87.8% (Montana in 2006) (median: 81.2%) (Table 50). The percentage who reported smoking was allowed in some public indoor or common areas ranged from 4.9% (Montana in 2006) to 15.7% (Illinois in 2003) (median: 11.1%). The percentage of employed adults who reported smoking was allowed in all public indoor or common areas ranged from 0.5% (Montana in 2005) to 4.7% (Oklahoma in 2004) (median: 1.6%). The percentage of employed adults who reported that their workplace had no official smoking policy for public indoor or common areas ranged from 3.7% (Florida in 2003) to 7.9% (New Mexico in 2003) (median: 6.3%).
Perceived Compliance with Smoke-Free Policies in Workplaces
Among 31 ATSs, the percentage of employed adults who reported that someone had smoked in their work area in the preceding 7 days ranged from 5.3% (Montana in 2006) to 17.8% (Ohio in 2004) (median: 12.5%) (Table 51). Among 29 ATSs, the percentage of adults employed in a workplace where smoking was not allowed in any work areas and who reported that someone had smoked in their work area in the preceding 7 days ranged from 1.3% (Montana in 2006) to 6.1% (West Virginia in 2007) (median: 3.8%).
Smoke-Free Policy Preferences in Workplaces
Work Areas. Among four ATSs, the percentage of adults employed in workplaces without smoke-free indoor work areas and who preferred no change ranged from 62.1% (Iowa in 2004) to 80.6% (Iowa in 2006) (median: 69.0%) (Table 52). The percentage of adults who were employed in workplaces without smoke-free policies for their work areas and who preferred a stronger workplace smoking policy ranged from 19.1% (Iowa in 2006) to 37.0% (Iowa in 2004) (median: 28.6%).
Public Indoor or Common Areas. Among four ATSs, the percentage of adults employed in workplaces without smoke-free public indoor work areas and who preferred no change ranged from 63.5% (Iowa in 2004) to 79.2% (Iowa in 2006) (median: 68.4%) (Table 52). The percentage of adults who were employed in workplaces without smoke-free policies for public indoor or common areas and who preferred a stronger workplace smoking policy ranged from 20.1% (Iowa in 2006) to 36.0% (Iowa in 2004) (median: 29.2%).
Secondhand Smoke Exposure and Smoke-Free Policies in Homes
Respondents were asked to report the number of days on which anyone had smoked cigarettes, cigars, or pipes inside their home in the preceding 7 days. Respondents also were asked which of the following best described the rules about smoking inside their home: smoking is not allowed anywhere, smoking is allowed in some places or at some times, or smoking is allowed anywhere. To assess perceived compliance with smoke-free policies in U.S. homes, the percentage of persons who reported that smoking was not allowed anywhere inside their home but also reported that someone had smoked in their home in the preceding 7 days was determined. Responses were stratified by smoking status (smoker and nonsmoker).
Among 30 ATSs, the percentage of adults who reported that smoking was not allowed anywhere inside their home ranged from 64.1% (West Virginia in 2005) to 87.7% (Florida in 2007) (median: 79.2%) (Table 53). The percentage of smokers who reported that smoking was not allowed anywhere inside their home ranged from 29.5% (West Virginia in 2005) to 61.8% (Florida in 2007) (median: 44.1%). The percentage of nonsmokers who reported that smoking was not allowed anywhere inside their home ranged from 76.0% (West Virginia in 2005) to 92.9% (Idaho in 2005) (median: 87.6%).
Perceived Compliance with Smoke-Free Policies in Homes
Among 29 ATSs, the percentage of adults who reported that someone had smoked inside their home on ≥1 of the preceding 7 days ranged from 9.8% (Florida in 2007) to 27.7% (West Virginia in 2005) (median: 15.6) (Table 54). The percentage of smokers who reported someone smoking inside their home on one or more of the preceding 7 days ranged 37.2% (Florida in 2007) to 69.6% (Ohio in 2004) (median: 52.5%). The percentage of nonsmokers who reported someone smoking inside their home on one or more of the preceding 7 days ranged 4.4% (Florida in 2007) to 14.3% (West Virginia in 2005) (median: 7.0%).
Among 26 ATSs, the percentage of adults who reported that smoking was not permitted anywhere inside their home but also reported that someone had smoked inside their home in the preceding 7 days ranged from 0.9% (Iowa in 2004) to 5.7% (West Virginia in 2007) (median 2.8%) (Table 54). The percentage of smokers who reported that smoking was not permitted anywhere inside their home but also reported that someone had smoked inside their home in the preceding 7 days ranged from 3.1% (Montana in 2006) to 28.4% (Oklahoma in 2004) (median: 9.5%). The percentage of nonsmokers who reported that smoking was not permitted anywhere inside their home but also reported that someone had smoked inside their home in the preceding 7 days ranged from 0.7% (Arkansas in 2006 and Iowa in 2004) to 4.3% (Hawaii in 2006) (median: 1.9%).
Prevalence of Smoke-Free Workplaces and Homes
Respondents were asked about the rules for smoking in their homes and workplaces. Among 25 ATSs, the percentage of adults who were employed at smoke-free indoor workplaces, worked indoors most of the time, and did not permit smoking at home ranged from 51.2% (Ohio in 2004) to 75.2% (Montana in 2006) (median: 61.7%) (Table 55).
Secondhand Smoke Exposure in Cars and Homes
Respondents were asked whether in the preceding 7 days they had been in a car with someone who had been smoking. Respondents also were asked whether in the preceding 7 days anyone had smoked cigarettes, cigars, or pipes anywhere inside their home. Secondhand smoke in a car was defined as someone smoking in a car on ≥1 of the preceding 7 days. Secondhand smoke in the home or car was defined as someone smoking in the home or car on ≥1 of the preceding 7 days. Responses were stratified by smoking status (smoker and nonsmoker).
Cars. Among 33 ATSs, the percentage of adults reporting secondhand smoke in cars ranged from 15.3% (Hawaii in 2006) to 29.9% (West Virginia in 2005) (median: 23.1%) (Table 56). The percentage of smokers reporting exposure to secondhand smoke in cars ranged from 51.6% (Hawaii in 2006) to 75.1% (Ohio in 2006) (median: 67.6%). The percentage of nonsmokers reporting exposure to secondhand smoke in cars ranged from 9.0% (Montana in 2006) to 18.4% (Illinois in 2003) (median: 13.3%).
Homes or Cars. Among 17 ATSs, the percentage of adults reporting secondhand smoke in either homes or cars ranged from 21.8% (Hawaii in 2006) to 38.9% (West Virginia in 2005) (median: 27.4%) (Table 57). The percentage of smokers who reported exposure to secondhand smoke in homes or cars ranged from 70.0% (Florida in 2007) to 89.7% (Oklahoma in 2004) (median: 78.5%). The percentage of nonsmokers reporting secondhand smoke in homes or cars was lower than the percentage of smokers reporting such exposure and ranged from 11.1% (Montana in 2006) to 22.6% (Illinois in 2003) (median: 16.6%).
Level of Support for Increasing Excise Tax on Cigarettes
Respondents were asked how much additional tax on a pack of cigarettes they were willing to support if some or all the money raised was used to fund tobacco control programs: >$2 per pack, $2 per pack, $1 per pack, $0.50--$0.99 per pack, <$0.50 per pack, or no tax increase at all. State estimates for excise tax on cigarette packs at the time of survey were obtained from the STATE System.
In four states, the percentage of adults who reported supporting an increase of >$2 per pack ranged from 20.1% (Iowa in 2004) to 29.9% (Montana in 2006) (median: 27.9%) (Table 58). The percentage of adults who reported supporting $2 per pack ranged from 11.7% (Iowa in 2004) to 16.9% (Georgia in 2004) (median: 16.6%). The percentage of adults who reported supporting $1 per pack ranged from 13.5% (Georgia in 2004) to 16.8% (Iowa in 2004) (median: 14.8%). The percentage of adults who reported supporting no tax increase ranged from 29.0% (Montana in 2006 and Idaho in 2005) to 30.8% (Georgia in 2004) (median: 29.6%).
In four states, state excise tax on cigarettes at the time of survey ranged from $0.07 per pack (South Carolina in 2007) to $1.70 per pack (Montana in 2006) (median: $0.37 per pack). The state with the highest excise tax on cigarettes at the time of survey (Montana in 2006) showed the most support for increasing the excise tax by >$2 dollars per pack (29.9%), whereas states with a lower excise tax on cigarettes at the time of survey (Georgia in 2004, Iowa in 2004, Idaho in 2005, and South Carolina in 2007) showed lower support for increasing excise tax by >$2 dollars per pack (median: 27.2%) (Table 58). This pattern was observed among former smokers as well as never smokers. Current smokers in the state with the highest excise tax on cigarettes at the time of survey (Montana in 2006) reported the least support for an excise tax increase of more than 2 dollars per pack (2.7%), compared with smokers in states with lower excise tax on cigarettes.
Current Smokers. The majority of current smokers reported supporting no tax increase, ranging from 53.5% (South Carolina in 2007) to 56.8% (Iowa in 2004) (median: 55.3%). The percentage of current smokers who reported supporting an increase of >$2 per pack ranged from 2.7% (Montana in 2006) to 6.8% (Georgia in 2004) (median: 4.3%) (Table 58).
Former Smokers. The minority of former smokers reported supporting a tax increase of >$2 per pack, ranging from 17.6% (Iowa in 2004) to 30.9% (South Carolina in 2007) (median: 25.9%). The percentage of former smokers who reported supporting no tax increase ranged from 25.5% (South Carolina in 2007) to 31.8% (Georgia in 2004) (median: 29.7%) (Table 58).
Never Smokers. The minority of never smokers reported supporting no tax increase, ranging from 19.9% (Montana in 2006) to 22.7% (South Carolina in 2007) (median: 21.5%). The percentage of never smokers who reported supporting a tax increase of >$2 per pack ranged from 27.1% (Iowa in 2004) to 39.5% (Montana in 2006) (median: 35.8%) (Table 58).
Discussion
ATS collects data on attitudes and behaviors related to tobacco use, smoking cessation, secondhand smoke, and tobacco-related policy issues using standardized, scientifically validated data collection and analysis practices with a population-based, randomly selected sample. ATS was designed to collect data on key outcome indicators (8), and measurement of these indicators is used to evaluate state progress toward the four NTCP goals: prevent initiation, promote cessation, eliminate exposure to secondhand smoke, and identify and eliminate tobacco-related disparities. Measurement of these indicators also fulfills the need for periodic collection of population-based data on key indicators of tobacco use for adults, an activity crucial for implementing the WHO MPOWER package for tobacco control (7).
Smoking Initiation, Prevalence, and Cessation
State ATS data can be used to measure smoking prevalence among young adults and the average age at which young adults first began smoking. ATS data indicate that the smoking prevalence among adults aged 18--29 years is higher than the prevalence among all adults aged ≥18 years. Smoking patterns among adults might be better understood if trends in age of smoking initiation and trends in smoking prevalence and patterns among young adults were monitored through analysis of annual, cross-sectional data (10). For example, knowing the brand preference of young, established smokers can provide insight into what influences young smokers to start and continue smoking, and cigarette brand preference has been linked to exposure to tobacco advertising (11).
ATS data can be used to measure tobacco use prevalence and patterns of smoking among adults. ATS data indicate that almost one fifth (17.2%) of tobacco users are using multiple products concurrently (i.e., polytobacco use), a behavior that might increase nicotine addiction and adverse health effects (12). Similarly, 5.2% of adult smokers also were using smokeless tobacco (i.e., dual use). ATS data also indicate that almost one half of smokers (40.1%) smoke light cigarettes; however, light cigarettes do not reduce the risk for disease compared with regular cigarettes, and the lower tar and nicotine intake estimates provided on light cigarette packages are misleading (13).
Persons who stop smoking reduce substantially their risk of dying prematurely and the risk for cardiovascular diseases, lung and other types of cancer, and other tobacco-related diseases (14). ATS data are useful for measuring a state's progress in promoting smoking cessation. In addition, ATS data can be used to monitor progress in one of the six MPOWER strategies, offering to help persons to stop using tobacco (7).
According to Public Health Service (PHS) guidelines on treating tobacco use and dependence, clinicians should screen every patient for tobacco use during every visit, strongly recommend the use of effective treatments such as medication and counseling to patients who use tobacco, and provide assistance to patients who are ready to quit using tobacco (15). ATS can be particularly useful for obtaining population-based data to help determine how well health-care providers and health-care systems are following these guidelines. Although the majority of health-care professionals asked their patients whether they smoke (70.5%) and advised their patients who were smokers to quit (67.6%), these ATS data indicate that not all clinicians follow PHS guidelines. Furthermore, although the most recent clinical practice guideline issued by the Public Health Service suggests that self-help materials might not be effective treatments for smoking cessation (15), 22.7% of health-care professionals recommended self-help material to smokers for quitting. States can also use ATSs to obtain baseline data, measure change over time, and determine whether particular interventions in their states, such as outreach and training for clinicians and provider reminder systems, are increasing adherence to the PHS guidelines.
States have used ATS data for both program planning and evaluation related to tobacco cessation quitlines. In Ohio, the ATS data showed high rates of tobacco use among the uninsured. This led the Ohio Tobacco Prevention Foundation to provide reduced cost nicotine replacement therapy for persons without health insurance who called the Ohio telephone tobacco cessation quitline (J Stine, Ohio Department of Health, personal communication, October 2008). In Montana, the 2008 ATS data will be used to help evaluate the effectiveness of their tobacco cessation quitline (L Biazzo, MPH, Montana Department of Health and Human Services, personal communication, October 2008).
Exposure to Secondhand Smoke
State ATS data also can be used to measure the level of support for smoke-free policies and exposure to secondhand smoke. In addition, ATS data can be used to monitor progress in one of the six MPOWER strategies, protecting people from tobacco smoke (7). Secondhand smoke exposure can cause heart disease and lung cancer in nonsmoking adults. Nonsmokers who are exposed to secondhand smoke have a 25%--30% increase in risk for heart disease and 20%--30% increase in risk for lung cancer (16). Across all surveys, approximately 62% of respondents considered secondhand smoke to be very harmful to a person's health, and almost 80% of respondents reported not allowing smoking anywhere inside their homes. With the exception of bars and cocktail lounges, the majority of adults believe smoking should not be allowed at all in public places (77.6% believe smoking should not be allowed in workplaces, 65.5% in restaurants, 75.4% in shopping malls, 72.6% in public buildings, and 75.9% in sporting events and concerts). However, only one third (33.1%) of adults believe smoking should not be allowed at all in bars or cocktail lounges. Measurement of these indicators are important to assess increased knowledge of, improved attitudes toward, and increased support for the creation and active enforcement of tobacco-free policies, as well as reduced exposure to secondhand smoke. The Task Force on Community Preventive Services has indicated that smoking bans and restrictions are effective in both decreasing exposure to secondhand smoke and increasing smoking cessation (17).
States such as Montana, New Jersey, Illinois, and Ohio have used ATS data to assess knowledge of and attitudes toward secondhand smoke and smoke-free policies. Montana used state-level ATS data to assess support for smoke-free policies before the Montana Clean Indoor Air Act was passed in 2005 and plans to use ATS data to evaluate the effects of full implementation of the act. The New Jersey Department of Health and Senior Services used state-level ATS data to assess attitudes toward secondhand smoke before implementing a statewide smoke-free law in 2006. Illinois became a smoke-free state in 2008 (i.e., a state that prohibits smoking in 100% of all indoor areas of workplaces and public places) and modified the 2009 ATS questions to measure attitudes toward the newly smoke-free state. Before passage of a Smoke-Free Workplace Act in 2006, Ohio used ATS data to provide advocates with pre-ballot opinions on whether smoking should be allowed in restaurants, bars, and other worksites (J Stine, Ohio Department of Health, personal communication, October 2008). In 2004, Ohio used ATS data to identify regions within the state with high smoking prevalence. This information was used to develop media campaigns to educate parents and other adults within these regions about the dangers of secondhand smoke for children in vehicles (J Stine, Ohio Department of Health, personal communication, October 2008).
Disparities
ATS data can be used to measure state progress in identifying and eliminating demographic disparities related to tobacco use. The data in this report indicate that approximately 25% of adults who identified themselves as multiracial or other race (i.e., not white, black, or Hispanic) were current smokers, which is a greater percentage of current smokers than in any other racial/ethnic category. In addition, although 30.7% of all respondents usually smoked menthol cigarettes, approximately 82% of non-Hispanic black current smokers usually smoked menthol cigarettes. This estimate is consistent with nationwide data indicating that 80% of black smokers smoke menthol cigarettes (18); in addition, menthol cigarette advertisements are targeted toward black smokers (19). Disparities also occurred by education level; adults with some high school education or less smoked more than adults with higher levels of education.
States might need to add specific questions or modify the sample design to optimize the data collected and to determine smoking prevalence patterns in certain populations. These data in return can be used to develop successful programs to improve public health. For example, in 2005, ATS data from Montana indicated a high prevalence of smoking among pregnant women. The Montana Department of Health and Human Services used these data to educate policymakers and the public about the problem. Before 2003, no statewide tobacco-related surveys in Illinois gathered information about the sexual orientation of respondents. Analyses of Illinois data collected since then have shown that heterosexuals have a lower smoking prevalence (18.9%) than homosexuals (28.8%) and bisexuals (34.2%) (Chaloupka FJ, Ciecierski CC, Tauras JA, Siebel C, unpublished data, 2008). This information is important for the strategic planning process to ensure that tobacco control programs identify and reach these populations.
ATS also has been used to assess the effectiveness of state tobacco control programs or interventions geared toward populations with higher levels of tobacco use. States such as Florida, Arkansas, Idaho, Georgia, and Alaska have included input from community members to develop a strategic plan to address tobacco-related disparities among various populations. For example, Florida plans to increase collection of data related to specific populations, obtain funding to sustain programs for reduction and elimination of tobacco-related disparities, and implement culturally specific interventions that target tobacco use, exposure to secondhand smoke, and tobacco policies for specific populations. Additional steps should be taken to ensure that effective tobacco control programs and policies are reaching populations experiencing tobacco-related disparities. In 2005 and 2006, CDC developed the American Indian, Alaska Native, and Hispanic/Latino ATSs to measure tobacco use among these populations at the state-level.
Improvements in Tobacco Control Programs
Finally, ATS data can be used to improve state tobacco control programs. Ohio has used ATS data from 2006 to support policy development regarding raising the state excise tax on "other tobacco products." An amendment has been proposed to increase the tobacco product excise tax rate and to credit some of the additional revenue to the Tobacco Use Prevention Fund. This issue is under consideration in the 2009--2010 Ohio General Assembly regular session (J Stine, Ohio Department of Health, personal communication, October 2008).
The 2002 and 2004 ATSs were one of the data sources Oklahoma used to evaluate a demonstration tobacco control program in Tulsa County before, during, and immediately after implementation of the program. Six measures that directly related to the project objectives were used: smoking prevalence, including among daily, some-day, and former smokers; home smoking policies; worksite smoking policies; current smokers who quit smoking ≥1 day within the preceding year; adults who quit smoking within the preceding year; and use of cessation resources. The percentages for these measures before and after the program implementation were used to tailor programs in other counties.
Limitations
The findings in this report are subject to at least three limitations. First, because ATS is a telephone survey of residential households, persons without landline telephones (i.e., those with no landline telephone or with a cellular telephone only) are not represented in the sample. Research suggests that approximately 15.8% of U.S. households do not have landline telephones (20). Because studies indicate that smoking prevalence might be higher in households without landline telephones, the smoking prevalence in this report might be an underestimate for the entire adult population (20). Second, telephone surveys can be associated with significant error resulting from nonresponse; low response rates imply greater potential for nonresponse bias. Nevertheless, some researchers have discovered that no consistent relationship exists between response rates and nonresponse bias (21--23). Finally, ATS data are based on self-reports and are subject to recall bias. However, studies suggest that smoking prevalence estimates obtained from self-reports and those calculated from cotinine levels (an indicator of nicotine intake) are comparable (24,25).
Conclusion
CDC recommends that states establish, maintain, and fund comprehensive tobacco control programs, at least at CDC-recommended levels, to reduce tobacco-related deaths and diseases (3). Comprehensive tobacco control programs require the implementation and maintenance of surveillance and evaluation systems that monitor progress on key outcome indicators (8). ATSs provide states with population-based data on knowledge, attitudes, and behaviors related to tobacco use that are helpful for evaluating comprehensive tobacco control programs. When the survey is conducted periodically, data from an ATS can be used to measure the effectiveness and accountability of the state tobacco control programs over time. In addition, an ATS can be used to track the impact of tobacco product regulation if conducted before and after a change in regulation. CDC regularly evaluates the recommended state ATS questions with a goal of more closely aligning the questions with short-term, intermediate, and long-term outcome indicators to measure progress toward NTCP goals. ATS data can be used to make program-related decisions at the state level and can be tailored to meet state-specific needs.
Acknowledgments
This report is based, in part, on contributions by state coordinators of the Adult Tobacco Survey, Julia Gable, Kiersten Adams, Monique Young, Erica Causey, and Alissa O'Halloran.
References
- Danaei G, Ding EL, Mozaffarian D, et al. The preventable causes of death in the United States: comparative risk assessment of dietary, lifestyle, and metabolic risk factors. PLoS Med 2009;6:e1000058. Epub April 28, 2009.
- CDC. Smoking-attributable mortality, years of potential life lost, and productivity losses---United States, 2000--2004. MMWR 2008;57:1226--8.
- CDC. Best practices for comprehensive tobacco control programs---2007. Atlanta, GA: US Department of Health and Human Services, CDC; 2007. Available at http://www.cdc.gov/tobacco/stateandcommunity/best_practices/pdfs/2007/bestpractices_complete.pdf. Accessed November 18, 2009.
- CDC. Decline in cigarette consumption following implementation of a comprehensive tobacco prevention and education program---Oregon, 1996--1998. MMWR 1999;48:140--3.
- Farrelly MC, Pechacek TF, Thomas KY, Nelson D. The impact of tobacco control programs on adult smoking. Am J Public Health 2008;98:304--9.
- US Department of Health and Human Services. Healthy people 2010: understanding and improving health. 2nd ed. Washington, DC: US Department of Health and Human Services; 2000. Available at http://www.healthypeople.gov. Accessed November 18, 2009.
- World Health Organization. WHO report on the tobacco epidemic, 2008. The MPOWER package. Switzerland; 2008. Available at http://www.who.int/tobacco/mpower/en. Accessed November 18, 2009.
- Starr G, Rogers T, Schooley M, Porter S, Wiesen E, Jamison N. Key outcome indicators for evaluating comprehensive tobacco control programs. Atlanta, GA: CDC; 2005. Available at http://www.cdc.gov/TOBACCO/tobacco_control_programs/surveillance_evaluation/key_outcome/index.htm. Accessed November 18, 2009.
- Mann NH, Loomis BR. Cigarette universal product code database: 2007 version. Research Triangle Park, NC: RTI International; 2007.
- CDC. Current trends differences in the age of smoking initiation between blacks and whites---United States. MMWR 1991;40:754--7.
- CDC. Cigarette brand preference among middle and high school students who are established smokers---United States, 2004 and 2006. MMWR 2009;58:112--5.
- Bombard JM, Pederson LL, Nelson DE, Malarcher AM. Are smokers only using cigarettes? Exploring polytobacco use among an adult population. Addicti Behav 2007;32:2411--9.
- National Cancer Institute. Risks associated with smoking cigarettes with low machine-measured yields of tar and nicotine. Smoking and Tobacco Control Mongraph No. 13. National Cancer Institute; 2001. National Institutes of Health publication no. 02-5047.
- US Department of Health and Human Services. Health benefits of smoking cessation: a report of the Surgeon General. Atlanta, GA; US Department of Health and Human Services, Public Health Service, CDC; 1990. DHHS publication no. (CDC) 90-8416.
- Fiore MC, Roberto JC, Baker TB, et al. Treating tobacco use and dependence. Clinical practice guideline 2008 update. Rockville, MD: US Department of Health and Human Services, Public Health Service; 2008.
- US Department of Health and Human Services. The health consequences of involuntary exposure to tobacco smoke: a report of the Surgeon General. Atlanta, GA: US Department of Health and Human Services, CDC; 2006.
- Zaza S, Briss PA, Harris KW. The guide to community preventive services: what works to promote health? New York, NY: Oxford University Press; 2005.
- Substance Abuse and Mental Health Services Administration Office of Applied Studies. The NSDUH Report: Cigarette Use among Blacks: 2005 and 2006. Rockville, MD. 2007.
- Gardiner P. The African Americanization of menthol cigarette use in the United States. Nicotine & Tobacco Research 2004:6(Supplement 1):S55-65.
- Blumberg SJ, Luke JV. Wireless substitution: early release of estimates from the National Health Interview Survey, July--December 2008. Hyattsville, MD: CDC, National Center for Health Statistics; 2009. Available at http://www.cdc.gov/nchs/data/nhis/earlyrelease/wireless200905.htm. Accessed March 4, 2010.
- Groves RM. Nonresponse rates and nonresponse bias in household surveys. Public Opin Q 2006;70:646--75.
- Keeter S, Miller C, Kohut A, Groves RM, Presser S. Consequences of reducing nonresponse in a national telephone survey. Public Opin Q 2000;64:125--48.
- Keeter S, Kennedy C, Dimock M, Best J, Craighill P. Gauging the impact of growing nonresponse on estimates from a national RDD telephone survey. Public Opin Q 2006;70:759--79.
- Caraballo RS, Giovino GA, Pechacek TF, et al. Factors associated with discrepancies between self-reports on cigarette smoking and measured serum cotinine levels among persons aged 17 years or older: Third National Health and Nutrition Examination Survey, 1988--1994. Am J Epidemiol 2001;153:807--14.
- West R, Zatonski W, Przewozniak K, Jarvis MJ. Can we trust national smoking prevalence figures? Discrepancies between biochemically assessed and self-reported smoking rates in three countries. Cancer Epidemiol Biomarkers Prev 2007;16:820--2.
|
TABLE 32. (Continued) Brand of cigarettes usually smoked by current smokers* aged ≥18 years, by state --- Adult Tobacco Survey, United States, 2003--2007 |
|||||||||||
|---|---|---|---|---|---|---|---|---|---|---|---|
|
State |
Year |
Pall Mall |
Salem |
Virginia Slims |
Winston |
Other brands§ |
|||||
|
% |
(95% CI†) |
% |
(95% CI) |
% |
(95% CI) |
% |
(95% CI) |
% |
(95% CI) |
||
|
Michigan |
2005 |
2.1 |
(1.3--3.6) |
1.9 |
(1.1--3.2) |
1.6 |
(1.0--2.6) |
2.1 |
(1.2--3.8) |
31.2 |
(27.2--35.6) |
|
Montana |
2004 |
2.1 |
(0.9--4.6) |
1.0 |
(0.3--3.6) |
1.7 |
(0.4--6.9) |
2.5 |
(1.1--5.6) |
27.3 |
(21.4--34.1) |
|
Montana |
2005 |
3.6 |
(1.5--8.4) |
0.4 |
(0.1--2.8) |
1.5 |
(0.6--3.7) |
1.8 |
(0.7--4.3) |
23.8 |
(18.7--29.8) |
|
New Jersey |
2006 |
1.8 |
(1.1--3.1) |
2.4 |
(1.6--3.4) |
2.7 |
(1.8--4.0) |
2.1 |
(1.3--3.4) |
23.0 |
(20.0--26.3) |
|
Median |
2.1 |
1.5 |
1.7 |
2.1 |
25.6 |
||||||
|
* Current cigarette smokers were respondents who had smoked at least 100 cigarettes in their lifetime and, at the time of the interview, reported smoking cigarettes every day or some days. † Confidence interval. § Although data were collected on Benson and Hedges, Carlton, Kent, Lucky Strike, Merit, and More brands, they are included in the other brands category (in addition to other brands reported) because <1% of each state sample reported smoking these brands. 4 |
|||||||||||
|
TABLE 35. (Continued) Prevalence of employer-offered smoking cessation programs* among employed adults aged ≥18 years, by smoking status and state --- Adult Tobacco Survey, United States, 2003--2007 |
|||||||||||||
|---|---|---|---|---|---|---|---|---|---|---|---|---|---|
|
≤50 employees in company |
|||||||||||||
|
State |
Year |
Overall |
Current smokers |
Nonsmokers |
|||||||||
|
% |
(95% CI¶) |
% |
(95% CI) |
% |
(95% CI) |
||||||||
|
Arkansas |
2006 |
--- |
--- |
--- |
--- |
--- |
--- |
||||||
|
Georgia |
2004 |
7.3 |
(5.1--10.3) |
3.4 |
(1.6--7.1) |
8.8 |
(6.0--12.7) |
||||||
|
Idaho |
2005 |
--- |
--- |
--- |
--- |
--- |
--- |
||||||
|
Illinois |
2003 |
--- |
--- |
--- |
--- |
--- |
--- |
||||||
|
2005 |
--- |
--- |
--- |
--- |
--- |
--- |
|||||||
|
Iowa |
2004 |
3.9 |
(1.6--9.2) |
0.7 |
(0.1--5.0) |
3.9 |
(1.4--10.7) |
||||||
|
2006 |
6.5 |
(3.4--12.0) |
7.7 |
(1.9--26.0) |
6.1 |
(3.0--11.9) |
|||||||
|
Michigan |
2005 |
--- |
--- |
--- |
--- |
--- |
--- |
||||||
|
New Mexico |
2003 |
--- |
--- |
--- |
--- |
--- |
--- |
||||||
|
Ohio |
2004 |
7.9 |
(4.6--13.2) |
13.0 |
(4.7--31.0) |
6.1 |
(3.7--10.0) |
||||||
|
2006 |
6.9 |
(4.6--10.0) |
9.7 |
(4.6--19.3) |
5.8 |
(3.8--8.8) |
|||||||
|
South Carolina |
2007 |
--- |
--- |
--- |
--- |
--- |
--- |
||||||
|
Median |
6.9 |
7.7 |
6.1 |
||||||||||
|
* Determined by a "yes" response to the following question: "Within the past 12 months, has your employer offered any stop smoking program or any other help to employees who want to quit smoking?" † Current cigarette smokers were respondents who had smoked at least 100 cigarettes in their lifetime and, at the time of the interview, reported smoking cigarettes every day or some days. § Nonsmokers include never smokers (smokers who had not smoked at least 100 cigarettes in their lifetime) and former smokers (smokers who had smoked at least 100 cigarettes in their lifetime but, at the time of the interview, reported no longer smoking at all). ¶ Confidence interval. ** Data unavailable. |
|||||||||||||
|
TABLE 38. (Continued) Use of medications for smoking cessation among current smokers* and former smokers† aged ≥18 years who attempted to quit smoking in the preceding year,§ by state --- Adult Tobacco Survey, United States, 2003--2007 |
|||||||||
|---|---|---|---|---|---|---|---|---|---|
|
State |
Year |
Nasal spray |
Nicotine lozenge |
Inhaler |
Other medications |
||||
|
% |
(95% CI¶) |
% |
(95% CI) |
% |
(95% CI) |
% |
(95% CI) |
||
|
Alaska |
2003 |
---** |
--- |
--- |
--- |
--- |
--- |
--- |
--- |
|
Florida |
2003 |
--- |
--- |
--- |
--- |
--- |
--- |
--- |
--- |
|
2004 |
--- |
--- |
--- |
--- |
--- |
--- |
--- |
--- |
|
|
2005 |
--- |
--- |
--- |
--- |
--- |
--- |
--- |
--- |
|
|
2006 |
--- |
--- |
--- |
--- |
--- |
--- |
--- |
--- |
|
|
2007 |
--- |
--- |
--- |
--- |
--- |
--- |
--- |
--- |
|
|
Georgia |
2004 |
NA†† |
NA |
NA |
NA |
NA |
NA |
NA |
NA |
|
Hawaii |
2006 |
--- |
--- |
--- |
--- |
--- |
--- |
--- |
--- |
|
Idaho |
2005 |
1.7 |
(0.2--11.3) |
10.9 |
(5.0--22.1) |
9.3 |
(3.9--20.7) |
4.1 |
(1.3--12.3) |
|
Illinois |
2003 |
1.2 |
(0.2--5.4) |
2.1 |
(0.8--5.7) |
5.5 |
(2.8--10.6) |
12.9 |
(7.8--20.5) |
|
2005 |
2.8 |
(1.2--6.4) |
7.2 |
(4.3--11.7) |
--- |
--- |
8.4 |
(3.7--17.6) |
|
|
2007 |
0.0 |
10.5 |
(5.4--19.5) |
2.9 |
(1.0--8.1) |
18.2 |
(12.0--26.7) |
||
|
Iowa |
2004 |
--- |
--- |
--- |
--- |
--- |
--- |
--- |
--- |
|
Kansas |
2006 |
--- |
--- |
--- |
--- |
--- |
--- |
--- |
--- |
|
Michigan |
2005 |
NA |
NA |
NA |
NA |
NA |
NA |
NA |
NA |
|
Montana |
2004 |
--- |
--- |
--- |
--- |
--- |
--- |
--- |
--- |
|
2005 |
--- |
--- |
--- |
--- |
--- |
--- |
--- |
--- |
|
|
New Jersey |
2006 |
5.9 |
(2.0--15.9) |
--- |
--- |
8.4 |
(4.3--15.7) |
15.0 |
(9.0--24.1) |
|
New Mexico |
2006 |
--- |
--- |
--- |
--- |
--- |
--- |
--- |
--- |
|
Ohio |
2004 |
--- |
--- |
--- |
--- |
--- |
--- |
--- |
--- |
|
2006 |
--- |
--- |
--- |
--- |
--- |
--- |
--- |
--- |
|
|
Oklahoma |
2004 |
NA |
NA |
NA |
NA |
NA |
NA |
NA |
NA |
|
Pennsylvania |
2005 |
--- |
--- |
--- |
--- |
--- |
--- |
--- |
--- |
|
South Carolina |
2007 |
0.4 |
(0.1--2.9) |
9.0 |
(4.6--17.0) |
3.5 |
(1.5--7.9) |
25.7 |
(17.3--36.4) |
|
West Virginia |
2005 |
--- |
--- |
--- |
--- |
--- |
--- |
--- |
--- |
|
2007 |
1.2 |
(0.3--4.6) |
6.1 |
(2.4--14.6) |
1.5 |
(0.5--4.7) |
13.2 |
(7.4--22.3) |
|
|
Wyoming |
2004 |
9.2 |
(3.0--25.3) |
10.8 |
(5.3--20.8) |
7.9 |
(3.1--18.8) |
13.7 |
(6.9--25.2) |
|
2006 |
0.6 |
(0.1--4.3) |
10.7 |
(5.1--21.1) |
8.6 |
(3.5--19.7) |
10.8 |
(4.7--23.1) |
|
|
2007 |
2.4 |
(0.7--7.4) |
19.0 |
(11.8--29.0) |
8.1 |
(3.6--17.5) |
22.0 |
(14.0--32.8) |
|
|
Median |
1.5 |
10.5 |
7.9 |
13.5 |
|||||
|
* Current cigarette smokers were respondents who had smoked at least 100 cigarettes in their lifetime and, at the time of the interview, reported smoking cigarettes every day or some days. † Former smokers were respondents who had smoked at least 100 cigarettes in their lifetime but, at the time of the interview, reported no longer smoking at all. § Among current smokers who made a quit attempt in the preceding year and former smokers who quit in the preceding year. ¶ Confidence interval. ** Data unavailable. †† Not analyzed (number of respondents <50). |
|||||||||
|
TABLE 40. (Continued) Level of support among adults aged ≥18 years for smoke-free policies in workplaces,* by smoking status and state --- Adult Tobacco Survey, United States, 2003--2007 |
|||||||||||||
|---|---|---|---|---|---|---|---|---|---|---|---|---|---|
|
Not allowed at all |
|||||||||||||
|
State |
Year |
Overall |
Current smokers† |
Nonsmokers§ |
|||||||||
|
% |
(95% CI¶) |
% |
(95% CI) |
% |
(95% CI) |
||||||||
|
Alaska |
2003 |
81.7 |
(79.5--83.8) |
60.4 |
(54.4--66.1) |
88.3 |
(86.1--90.1) |
||||||
|
Florida |
2003 |
78.4 |
(75.0--81.5) |
59.1 |
(49.5--68.0) |
84.4 |
(81.0--87.2) |
||||||
|
2004 |
78.5 |
(76.3--80.5) |
56.2 |
(50.1--62.1) |
83.6 |
(81.4--85.6) |
|||||||
|
2005 |
81.9 |
(79.9--83.8) |
58.4 |
(51.9--64.7) |
86.8 |
(84.9--88.5) |
|||||||
|
Georgia |
2004 |
77.9 |
(76.6--79.1) |
50.8 |
(47.2--54.4) |
84.1 |
(82.8--85.3) |
||||||
|
Hawaii |
2006 |
85.0 |
(82.7--87.1) |
58.0 |
(49.2--66.2) |
89.1 |
(86.9--90.9) |
||||||
|
Idaho |
2005 |
81.3 |
(79.2--83.2) |
55.6 |
(48.7--62.2) |
86.0 |
(84.0--87.7) |
||||||
|
Illinois |
2003 |
72.5 |
(70.9--74.1) |
44.6 |
(40.3--48.9) |
79.3 |
(77.6--80.8) |
||||||
|
2005 |
74.2 |
(72.7--75.6) |
46.2 |
(42.3--50.2) |
80.9 |
(79.5--82.3) |
|||||||
|
2007 |
77.0 |
(75.5--78.5) |
49.7 |
(45.2--54.3) |
82.6 |
(81.1--84.0) |
|||||||
|
Iowa |
2004 |
76.7 |
(73.8--79.3) |
49.1 |
(41.4--56.8) |
83.6 |
(80.8--86.0) |
||||||
|
2006 |
80.7 |
(78.0--83.1) |
54.4 |
(46.1--62.4) |
86.3 |
(83.9--88.5) |
|||||||
|
Michigan |
2005 |
75.6 |
(73.8--77.3) |
48.2 |
(43.4--53.1) |
81.8 |
(79.9--83.5) |
||||||
|
Montana |
2004 |
77.4 |
(74.9--79.7) |
52.1 |
(44.8--59.3) |
82.6 |
(80.1--84.9) |
||||||
|
2005 |
77.6 |
(74.8--80.1) |
49.1 |
(41.4--56.8) |
83.8 |
(81.1--86.1) |
|||||||
|
2006 |
81.8 |
(79.4--83.9) |
58.7 |
(50.7--66.2) |
86.4 |
(84.2--88.4) |
|||||||
|
New Jersey |
2006 |
81.8 |
(80.7--82.9) |
59.4 |
(55.5--63.2) |
85.2 |
(84.1--86.3) |
||||||
|
New Mexico |
2003 |
78.1 |
(76.1--80.1) |
57.9 |
(52.4--63.1) |
82.9 |
(80.7--84.9) |
||||||
|
2006 |
79.5 |
(77.3--81.6) |
64.7 |
(58.7--70.3) |
83.2 |
(80.8--85.3) |
|||||||
|
Ohio |
2004 |
68.9 |
(67.1--70.7) |
41.7 |
(37.3--46.1) |
76.4 |
(74.6--78.2) |
||||||
|
2006 |
70.9 |
(69.3--72.4) |
41.3 |
(37.6--45.1) |
79.3 |
(77.8--80.8) |
|||||||
|
Oklahoma |
2004 |
77.8 |
(73.0--81.9) |
47.2 |
(36.5--58.3) |
86.7 |
(82.2--90.2) |
||||||
|
Pennsylvania |
2005 |
71.0 |
(68.9--72.9) |
42.8 |
(37.9--47.8) |
78.4 |
(76.4--80.3) |
||||||
|
South Carolina |
2007 |
78.6 |
(76.8--80.2) |
50.0 |
(44.9--55.1) |
85.7 |
(84.2--87.1) |
||||||
|
West Virginia |
2005 |
61.6 |
(58.9--64.3) |
32.0 |
(26.8--37.8) |
71.6 |
(68.8--74.2) |
||||||
|
West Virginia |
2007 |
64.2 |
(61.4--66.8) |
37.6 |
(32.3--43.3) |
72.6 |
(69.6--75.4) |
||||||
|
Wyoming |
2004 |
69.6 |
(67.2--72.0) |
41.3 |
(35.1--48.6) |
76.6 |
(74.0--78.9) |
||||||
|
2006 |
75.3 |
(72.8--77.7) |
54.2 |
(47.3--61.0) |
80.9 |
(78.3--83.3) |
|||||||
|
2007 |
76.2 |
(73.8--78.5) |
50.0 |
(43.8--56.2) |
82.6 |
(79.9--84.9) |
|||||||
|
Median |
77.6 |
50.0 |
83.2 |
||||||||||
|
* Determined by response to the following question: "In indoor work areas, do you think smoking should be allowed in all areas, some areas, or not at all?" † Current cigarette smokers were respondents who had smoked at least 100 cigarettes in their lifetime and, at the time of the interview, reported smoking cigarettes every day or some days. § Nonsmokers include never smokers (smokers who had not smoked at least 100 cigarettes in their lifetime) and former smokers (smokers who had smoked at least 100 cigarettes in their lifetime but, at the time of the interview, reported no longer smoking at all). ¶ Confidence interval. |
|||||||||||||
|
TABLE 41. (Continued) Level of support among adults aged ≥18 years for smoke-free policies in indoor dining areas of restaurants,* by smoking status and state --- Adult Tobacco Survey, United States, 2003--2007 |
|||||||||||||
|---|---|---|---|---|---|---|---|---|---|---|---|---|---|
|
Not allowed at all |
|||||||||||||
|
State |
Year |
Overall |
Current smokers† |
Nonsmokers§ |
|||||||||
|
% |
(95% CI¶) |
% |
(95% CI) |
% |
(95% CI) |
||||||||
|
Alaska |
2003 |
70.9 |
(68.3--73.4) |
47.2 |
(41.4--53.1) |
78.0 |
(75.3--8-0.6) |
||||||
|
Arkansas |
2006 |
64.1 |
(62.8--65.3) |
35.7 |
(33.0--38.5) |
72.3 |
(71.1--73.5) |
||||||
|
Florida |
2003 |
62.1 |
(57.9--66.1) |
32.6 |
(24.1--42.4) |
71.4 |
(67.3--75.3) |
||||||
|
2004 |
70.6 |
(68.2--73.0) |
36.2 |
(30.8--42.0) |
78.5 |
(76.0--80.8) |
|||||||
|
2005 |
74.7 |
(72.4--76.9) |
43.4 |
(37.3--49.8) |
81.3 |
(79.0--83.3) |
|||||||
|
2007 |
78.1 |
(76.4--79.6) |
58.8 |
(53.5--63.8) |
81.8 |
(80.1--83.4) |
|||||||
|
Georgia |
2004 |
68.6 |
(67.2--70.0) |
37.1 |
(33.6--40.8) |
75.8 |
(74.3--77.2) |
||||||
|
Hawaii |
2006 |
82.4 |
(79.9--84.6) |
62.6 |
(54.0--70.6) |
85.4 |
(82.9--87.5) |
||||||
|
Idaho |
2005 |
73.1 |
(70.9--75.3) |
42.1 |
(35.7--48.7) |
78.9 |
(76.6--80.9) |
||||||
|
Illinois |
2003 |
54.0 |
(52.2--55.8) |
19.0 |
(15.9--22.5) |
62.5 |
(60.6--64.4) |
||||||
|
2005 |
56.8 |
(55.2--58.4) |
22.2 |
(19.1--25.6) |
65.0 |
(63.3--66.6) |
|||||||
|
2007 |
63.4 |
(61.7--65.0) |
27.9 |
(24.0--32.2) |
70.5 |
(68.8--72.2) |
|||||||
|
Iowa |
2004 |
60.3 |
(57.1--63.4) |
24.5 |
(18.7--31.5) |
69.5 |
(66.3--72.6) |
||||||
|
2006 |
65.2 |
(62.2--68.1) |
28.0 |
(21.3--35.9) |
73.1 |
(70.0--76.0) |
|||||||
|
Kansas |
2006 |
63.8 |
(61.7--65.9) |
26.0 |
(21.6--30.9) |
71.8 |
(69.7--73.9) |
||||||
|
Michigan |
2005 |
68.0 |
(66.1--69.8) |
34.0 |
(29.4--38.9) |
75.7 |
(73.8--77.6) |
||||||
|
Montana |
2004 |
65.8 |
(62.9--68.5) |
35.5 |
(28.7--43.0) |
72.1 |
(69.2--74.9) |
||||||
|
2005 |
74.1 |
(71.2--76.8) |
48.5 |
(40.9--56.2) |
79.8 |
(76.8--82.4) |
|||||||
|
New Jersey |
2006 |
70.4 |
(69.1--71.6) |
30.3 |
(26.9--34.0) |
76.8 |
(75.5--78.0) |
||||||
|
New Mexico |
2003 |
65.5 |
(63.2--67.7) |
38.5 |
(33.2--44.1) |
71.9 |
(69.5--74.2) |
||||||
|
2006 |
71.7 |
(69.3--73.9) |
49.5 |
(43.3--55.7) |
77.2 |
(74.7--79.5) |
|||||||
|
Ohio |
2004 |
54.5 |
(52.6--56.4) |
21.8 |
(18.1--26.1) |
63.4 |
(61.3--65.4) |
||||||
|
2006 |
59.9 |
(58.3--61.5) |
24.0 |
(20.9--27.4) |
70.2 |
(68.5--71.9) |
|||||||
|
Oklahoma |
2004 |
58.0 |
(54.6--61.4) |
21.8 |
(16.5--28.2) |
68.2 |
(64.5--71.7) |
||||||
|
Pennsylvania |
2005 |
54.0 |
(51.8--56.1) |
20.9 |
(17.2--25.1) |
62.9 |
(60.6--65.2) |
||||||
|
South Carolina |
2007 |
68.2 |
(66.3--70.1) |
32.7 |
(28.2--37.5) |
76.8 |
(74.9--78.5) |
||||||
|
Wyoming |
2004 |
56.8 |
(54.2--59.3) |
24.1 |
(19.0--29.9) |
64.8 |
(62.1--67.4) |
||||||
|
2006 |
63.4 |
(60.6--66.1) |
34.1 |
(27.9--40.9) |
71.2 |
(68.2--73.9) |
|||||||
|
2007 |
69.0 |
(66.5--71.4) |
37.6 |
(31.9--43.8) |
76.7 |
(74.1--79.2) |
|||||||
|
Median |
65.5 |
34.0 |
72.3 |
||||||||||
|
* Determined by response to the following question: "In the indoor dining area of restaurants, do you think that smoking should be allowed in all areas, some areas, or not allowed at all?" † Current cigarette smokers were respondents who had smoked at least 100 cigarettes in their lifetime and, at the time of the interview, reported smoking cigarettes every day or some days. § Nonsmokers include never smokers (smokers who had not smoked at least 100 cigarettes in their lifetime) and former smokers (smokers who had smoked at least 100 cigarettes in their lifetime but, at the time of the interview, reported no longer smoking at all). ¶ Confidence interval. |
|||||||||||||
|
TABLE 42. Level of support among adults aged ≥18 years for policies that totally ban smoking in restaurants,* by smoking status and state --- Adult Tobacco Survey, United States, 2003--2007 |
||||||||||||||
|---|---|---|---|---|---|---|---|---|---|---|---|---|---|---|
|
State |
Year |
State smoke-free law in place at time of survey† |
Would support a smoke-free law for restaurants |
Would eat out more if smoking in restaurants were banned |
||||||||||
|
Overall |
Current smokers§ |
Nonsmokers¶ |
Overall |
Current smokers |
Nonsmokers |
|||||||||
|
% |
(95% CI**) |
% |
(95% CI) |
% |
(95% CI) |
% |
(95% CI) |
% |
(95% CI) |
% |
(95% CI) |
|||
|
Georgia |
2004 |
None |
76.0 |
(74.7--77.3) |
49.6 |
(46.0--53.2) |
82.0 |
(80.7--83.3) |
20.1 |
(18.9--21.3) |
4.1 |
(2.8--6.0) |
23.8 |
(22.4--25.2) |
|
Idaho |
2005 |
Banned |
--- |
--- |
--- |
--- |
--- |
--- |
13.3 |
(11.7--15.1) |
1.3 |
(0.5--3.4) |
15.5 |
(13.7--17.6) |
|
Iowa |
2004 |
Restricted to designated areas |
---†† |
--- |
--- |
--- |
--- |
--- |
8.1 |
(6.4--10.1) |
1.3 |
(0.2--8.5) |
9.8 |
(7.8--12.2) |
|
2006 |
Restricted to designated areas |
--- |
--- |
--- |
--- |
--- |
--- |
10.7 |
(9.0--12.8) |
2.9 |
(0.9--9.2) |
12.3 |
(10.3--14.6) |
|
|
Illinois |
2003 |
Restricted to designated areas |
69.4 |
(67.7--71.0) |
36.2 |
(32.1--40.5) |
77.5 |
(75.8--79.1) |
12.1 |
(11.0--13.3) |
2.0 |
(1.1--3.6) |
14.6 |
(13.2--16.0) |
|
2005 |
Restricted to designated areas |
72.8 |
(71.4--74.2) |
43.3 |
(39.3--47.5) |
79.8 |
(78.4--81.2) |
12.6 |
(11.6--13.7) |
1.7 |
(1.0--3.0) |
15.3 |
(14.1--16.5) |
|
|
2007 |
Restricted to designated areas |
74.8 |
(73.2--76.3) |
41.4 |
(37.0--46.0) |
81.5 |
(80.0--83.0) |
15.1 |
(13.9--16.4) |
2.8 |
(1.5--5.2) |
17.6 |
(16.2--19.0) |
|
|
Kansas |
2006 |
Restricted to designated areas |
76.1 |
(74.2--77.9) |
43.9 |
(38.4--49.6) |
82.6 |
(80.8--84.4) |
12.9 |
(11.6--14.4) |
1.9 |
(1.0--3.9) |
15.3 |
(13.7--17.0) |
|
Michigan |
2005 |
Restricted to designated areas |
--- |
--- |
--- |
--- |
--- |
--- |
13.7 |
(12.4--15.0) |
2.6 |
(1.3--5.4) |
16.2 |
(14.7--17.7) |
|
New Mexico |
2003 |
None |
--- |
--- |
--- |
--- |
--- |
--- |
21.0 |
(18.6--23.6) |
4.7 |
(2.5--8.6) |
24.5 |
(21.7--27.6) |
|
2006 |
None |
--- |
--- |
--- |
--- |
--- |
--- |
25.0 |
(22.9--27.3) |
6.5 |
(3.9--10.7) |
29.6 |
(27.1--32.2) |
|
|
Ohio |
2004 |
None |
66.5 |
(64.7--68.3) |
31.9 |
(27.9--36.2) |
76.0 |
(74.1--77.8) |
18.3 |
(17.0--19.8) |
2.3 |
(1.3--4.2) |
22.8 |
(21.1--24.6) |
|
2006 |
Banned§§ |
68.3 |
(66.7--69.8) |
35.1 |
(31.5--38.9) |
77.9 |
(76.3--79.4) |
16.1 |
(14.9--17.4) |
1.1 |
(0.5--2.4) |
20.5 |
(19.0--22.0) |
|
|
South Carolina |
2007 |
None |
75.9 |
(74.1--77.7) |
45.3 |
(40.2--50.5) |
83.3 |
(81.7--84.8) |
14.0 |
(12.7--15.5) |
2.0 |
(1.1--3.6) |
17.0 |
(15.4--18.7) |
|
Wyoming |
2004 |
None |
67.2 |
(64.8--69.6) |
39.5 |
(33.6--45.8) |
74.2 |
(71.6--76.6) |
16.2 |
(14.4--18.1) |
3.0 |
(1.2--7.3) |
19.5 |
(17.3--21.7) |
|
Median |
72.8 |
41.4 |
79.8 |
14.0 |
2.3 |
17.0 |
||||||||
|
* Determined by response to the following questions: "Some cities and towns are considering laws that would make restaurants smoke free, that is eliminating all tobacco smoke from restaurants. Would you support such a law in your community?" and "If there were a total ban on smoking in restaurants, would you eat out more, less or would it make no difference?" † Information on state smoke-free laws in place at time of survey was obtained from the State Tobacco Activities Tracking and Evaluation (STATE) System (available at http://www.cdc.gov/tobacco/statesystem). § Current cigarette smokers were respondents who had smoked at least 100 cigarettes in their lifetime and, at the time of the interview, reported smoking cigarettes every day or some days. ¶ Nonsmokers include never smokers (smokers who had not smoked at least 100 cigarettes in their lifetime) and former smokers (smokers who had smoked at least 100 cigarettes in their lifetime but, at the time of the interview, reported no longer smoking at all). ** Confidence interval. †† Data unavailable. §§ Implemented in fourth quarter of 2006. |
||||||||||||||
|
TABLE 42. (Continued) Level of support among adults aged ≥18 years for policies that totally ban smoking in restaurants,* by smoking status and state --- Adult Tobacco Survey, United States, 2003--2007 |
||||||||||||||
|---|---|---|---|---|---|---|---|---|---|---|---|---|---|---|
|
State |
Year |
State smoke-free law in place at time of survey† |
Would make no difference if smoking in restaurants were banned |
Would eat out less if smoking in restaurants were banned |
||||||||||
|
Overall |
Current smokers§ |
Nonsmokers¶ |
Overall |
Current smokers |
Nonsmokers |
|||||||||
|
% |
(95% CI**) |
% |
(95% CI) |
% |
(95% CI) |
% |
(95% CI) |
% |
(95% CI) |
% |
(95% CI) |
|||
|
Georgia |
2004 |
None |
71.2 |
(69.8--72.5) |
66.8 |
(63.2--70.2) |
72.1 |
(70.6--73.6) |
8.7 |
(7.8--9.7) |
29.1 |
(25.8--32.6) |
4.1 |
(3.4--4.9) |
|
Idaho |
2005 |
Banned |
83.4 |
(81.5--85.1) |
82.1 |
(76.7--86.4) |
83.6 |
(81.5--85.5) |
3.3 |
(2.6--4.3) |
16.6 |
(12.4--21.9) |
0.9 |
(0.6--1.4) |
|
Iowa |
2004 |
Restricted to designated areas |
87.1 |
(84.7--89.2) |
81.0 |
(74.0--86.5) |
88.6 |
(86.1--90.8) |
4.8 |
(3.5--6.5) |
17.7 |
(12.5--24.4) |
1.6 |
(0.8--3.0) |
|
2006 |
Restricted to designated areas |
85.0 |
(82.7--87.0) |
78.9 |
(71.9--84.5) |
86.5 |
(84.1--88.6) |
4.3 |
(3.3--5.6) |
18.2 |
(13.3--24.5) |
1.2 |
(0.7--2.1) |
|
|
Illinois |
2003 |
Restricted to designated areas |
80.6 |
(79.1--81.9) |
70.2 |
(66.2--74.0) |
83.1 |
(81.6--84.5) |
7.3 |
(6.4--8.3) |
27.8 |
(24.1--31.7) |
2.4 |
(1.9--3.0) |
|
2005 |
Restricted to designated areas |
80.1 |
(78.8--81.3) |
69.6 |
(65.9--73.0) |
82.5 |
(81.2--83.8) |
7.3 |
(6.4--8.2) |
28.7 |
(25.3--32.3) |
2.2 |
(1.7--2.8) |
|
|
2007 |
Restricted to designated areas |
77.6 |
(76.2--79.0) |
65.5 |
(61.0--69.7) |
80.3 |
(78.8--81.7) |
7.3 |
(6.4--8.3) |
31.7 |
(27.6--36.1) |
2.2 |
(1.7--2.8) |
|
|
Kansas |
2006 |
Restricted to designated areas |
82.0 |
(80.3--83.6) |
75.4 |
(70.5--79.8) |
83.4 |
(81.6--85.0) |
5.1 |
(4.2--6.2) |
22.6 |
(18.4--27.5) |
1.3 |
(0.9--2.0) |
|
Michigan |
2005 |
Restricted to designated areas |
79.3 |
(77.7--80.8) |
68.0 |
(63.3--72.4) |
81.9 |
(80.2--83.4) |
7.1 |
(6.1--8.2) |
29.3 |
(25.1--33.9) |
2.0 |
(1.4--2.8) |
|
New Mexico |
2003 |
None |
72.3 |
(69.5--74.9) |
72.5 |
(66.4--77.9) |
72.2 |
(69.1--75.2) |
6.7 |
(5.4--8.3) |
22.8 |
(17.9--28.5) |
3.2 |
(2.2--4.8) |
|
2006 |
None |
69.4 |
(67.0--71.7) |
79.9 |
(74.5--84.4) |
66.8 |
(64.2--69.4) |
5.5 |
(4.4--6.8) |
13.6 |
(10.0--18.1) |
3.6 |
(2.6--4.9) |
|
|
Ohio |
2004 |
None |
71.3 |
(69.6--73.0) |
62.2 |
(57.9--66.3) |
73.8 |
(71.9--75.6) |
10.4 |
(9.2--11.6) |
35.5 |
(31.5--39.7) |
3.4 |
(2.7--4.4) |
|
2006 |
Banned§§ |
73.9 |
(72.4--75.3) |
64.1 |
(60.6--67.5) |
76.8 |
(75.1--78.3) |
10.0 |
(9.0--11.0) |
34.8 |
(31.4--38.3) |
2.8 |
(2.2--3.5) |
|
|
South Carolina |
2007 |
None |
80.7 |
(79.1--82.3) |
79.2 |
(74.8--83.1) |
81.0 |
(79.2--82.6) |
5.2 |
(4.4--6.3) |
18.8 |
(15.1--23.2) |
2.0 |
(1.5--2.7) |
|
Wyoming |
2004 |
None |
75.8 |
(73.6--78.0) |
66.6 |
(60.4--72.3) |
78.1 |
(75.7--80.3) |
8.0 |
(6.7--9.6) |
30.4 |
(24.9--36.4) |
2.4 |
(1.7--3.4) |
|
Median |
79.3 |
70.2 |
81.0 |
7.1 |
27.8 |
2.2 |
||||||||
|
* Determined by response to the following questions: "Some cities and towns are considering laws that would make restaurants smoke free, that is eliminating all tobacco smoke from restaurants. Would you support such a law in your community?" and "If there were a total ban on smoking in restaurants, would you eat out more, less or would it make no difference?" † Information on state smoke-free laws in place at time of survey was obtained from the State Tobacco Activities Tracking and Evaluation System (available at http://www.cdc.gov/tobacco/statesystem). § Current cigarette smokers were respondents who had smoked at least 100 cigarettes in their lifetime and, at the time of the interview, reported smoking cigarettes every day or some days. ¶ Nonsmokers include never smokers (smokers who had not smoked at least 100 cigarettes in their lifetime) and former smokers (smokers who had smoked at least 100 cigarettes in their lifetime but, at the time of the interview, reported no longer smoking at all). ** Confidence interval. †† Data unavailable. §§ Implemented in fourth quarter of 2006. |
||||||||||||||
|
TABLE 44. Level of support among adults aged ≥18 years for smoke-free policies in indoor shopping malls,* by smoking status and state --- Adult Tobacco Survey, United States, 2003--2007 |
||||||||||||||
|---|---|---|---|---|---|---|---|---|---|---|---|---|---|---|
|
State |
Year |
State smoke-free law in place at time of survey† |
Allowed in all areas |
Allowed in some areas |
||||||||||
|
Overall |
Current smokers§ |
Nonsmokers¶ |
Overall |
Current smokers |
Nonsmokers |
|||||||||
|
% |
(95% CI**) |
% |
(95% CI) |
% |
(95% CI) |
% |
(95% CI) |
% |
(95% CI) |
% |
(95% CI) |
|||
|
Alaska |
2003 |
Banned |
0.6 |
(0.3--1.0) |
1.1 |
(0.5--2.6) |
0.4 |
(0.2--0.8) |
20.7 |
(18.5--23.0) |
27.4 |
(22.8--32.5) |
18.7 |
(16.3--21.2) |
|
Florida |
2003 |
None |
1.3 |
(0.6--2.6) |
3.0 |
(1.0--8.8) |
0.6 |
(0.3--1.4) |
29.3 |
(25.6--33.3) |
39.7 |
(30.3--49.8) |
26.1 |
(22.4--30.3) |
|
2004 |
None |
1.2 |
(0.8--2.0) |
2.8 |
(1.3--5.6) |
0.8 |
(0.4--1.6) |
25.8 |
(23.6--28.1) |
39.6 |
(34.0--45.5) |
22.6 |
(20.3--25.1) |
|
|
2005 |
None |
0.7 |
(0.4--1.2) |
1.1 |
(0.4--2.9) |
0.6 |
(0.3--1.1) |
19.8 |
(18.0--21.8) |
36.7 |
(30.9--42.9) |
16.3 |
(14.5--18.2) |
|
|
2007 |
None |
1.6 |
(1.3--2.1) |
2.0 |
(1.1--3.6) |
1.6 |
(1.2--2.1) |
16.1 |
(14.8--17.5) |
24.6 |
(20.9--28.8) |
14.4 |
(13.1--15.9) |
|
|
Georgia |
2004 |
None |
1.1 |
(0.8--1.5) |
2.1 |
(1.3--3.4) |
0.9 |
(0.6--1.3) |
23.5 |
(22.2--24.8) |
36.9 |
(33.6--40.3) |
20.4 |
(19.1--21.8) |
|
Idaho |
2005 |
Banned |
0.5 |
(0.2--1.1) |
2.3 |
(0.9--6.0) |
0.2 |
(0.1--0.5) |
16.9 |
(15.3--18.7) |
23.7 |
(18.9--29.3) |
15.7 |
(14.0--17.6) |
|
Illinois |
2003 |
None |
1.6 |
(1.2--2.2) |
3.7 |
(2.2--6.3) |
1.1 |
(0.8--1.6) |
32.5 |
(30.9--34.2) |
49.1 |
(44.8--53.4) |
28.5 |
(26.8--30.3) |
|
2005 |
None |
1.2 |
(0.7--1.9) |
3.0 |
(1.2--7.4) |
0.8 |
(0.5--1.1) |
28.9 |
(27.5--30.3) |
41.5 |
(37.7--45.4) |
25.9 |
(24.5--27.4) |
|
|
Iowa |
2004 |
Restricted to designated areas |
0.7 |
(0.3--1.7) |
1.9 |
(0.5--7.0) |
0.4 |
(0.2--1.0) |
26.7 |
(24.0--29.6) |
39.4 |
(32.2--47.2) |
23.3 |
(20.5--26.4) |
|
2006 |
Restricted to designated areas |
0.7 |
(0.3--1.4) |
1.4 |
(0.4--4.5) |
0.5 |
(0.2--1.3) |
21.4 |
(19.1--23.9) |
32.7 |
(25.9--40.4) |
18.9 |
(16.6--21.5) |
|
|
Kansas |
2006 |
None |
0.8 |
(0.6--1.2) |
1.6 |
(0.8--3.3) |
0.7 |
(0.4--1.0) |
21.6 |
(20.0--23.4) |
34.7 |
(29.5--40.3) |
18.9 |
(17.2--20.6) |
|
Montana |
2004 |
None |
0.8 |
(0.5--1.2) |
0.4 |
(0.1--2.1) |
0.7 |
(0.4--1.2) |
25.2 |
(22.8--27.8) |
33.3 |
(27.0--40.3) |
23.6 |
(21.0--26.3) |
|
2005 |
Banned |
0.7 |
(0.4--1.5) |
1.1 |
(0.3--3.2) |
0.7 |
(0.3--1.6) |
18.8 |
(16.5--21.3) |
29.9 |
(23.5--37.2) |
16.4 |
(14.1--19.0) |
|
|
New Jersey |
2006 |
Banned |
3.2 |
(2.7--3.8) |
5.7 |
(4.0--8.1) |
2.8 |
(2.3--3.4) |
16.0 |
(15.1--17.0) |
26.2 |
(22.9--29.7) |
14.5 |
(13.5--15.5) |
|
New Mexico |
2003 |
None |
0.9 |
(0.6--1.4) |
1.0 |
(0.4--2.3) |
0.9 |
(0.5--1.5) |
27.1 |
(25.1--29.3) |
36.0 |
(31.1--41.2) |
25.0 |
(22.8--27.4) |
|
2006 |
None |
1.0 |
(0.6--1.8) |
2.5 |
(1.0--6.2) |
0.7 |
(0.4--1.2) |
21.5 |
(19.6--23.6) |
25.4 |
(20.7--30.6) |
20.6 |
(18.5--23.0) |
|
|
Ohio |
2004 |
None |
2.1 |
(1.5--2.9) |
3.2 |
(1.9--5.2) |
1.8 |
(1.2--2.7) |
34.1 |
(32.3--35.9) |
49.9 |
(45.5--54.3) |
29.8 |
(27.9--31.8) |
|
Oklahoma |
2004 |
Banned |
1.2 |
(0.7--2.1) |
1.5 |
(0.5--4.5) |
1.1 |
(0.6--2.1) |
26.6 |
(23.7--29.8) |
41.5 |
(34.1--49.2) |
22.7 |
(19.6--26.1) |
|
Pennsylvania |
2005 |
None |
1.8 |
(1.3--2.6) |
4.2 |
(2.5--6.9) |
1.2 |
(0.7--1.9) |
30.2 |
(28.3--32.2) |
43.9 |
(39.1--48.9) |
26.5 |
(24.4--28.6) |
|
South Carolina |
2007 |
None |
0.6 |
(0.4--0.9) |
0.5 |
(0.3--1.0) |
0.6 |
(0.4--0.8) |
22.0 |
(20.4--23.7) |
35.2 |
(30.3--40.3) |
18.7 |
(17.2--20.4) |
|
Median |
1.0 |
2.0 |
0.7 |
23.5 |
36.0 |
20.6 |
||||||||
|
* Determined by response to the following question: "In indoor shopping malls, do you think that smoking should be allowed in all areas, some areas, or not allowed at all?" † Information on state smoke-free laws in place at time of survey was obtained from the State Tobacco Activities Tracking and Evaluation (STATE) System (available at http://www.cdc.gov/tobacco/statesystem). § Current cigarette smokers were respondents who had smoked at least 100 cigarettes in their lifetime and, at the time of the interview, reported smoking cigarettes every day or some days. ¶ Nonsmokers include never smokers (smokers who had not smoked at least 100 cigarettes in their lifetime) and former smokers (smokers who had smoked at least 100 cigarettes in their lifetime but, at the time of the interview, reported no longer smoking at all). ** Confidence interval. |
||||||||||||||
|
TABLE 44. (Continued) Level of support among adults aged ≥18 years for smoke-free policies in indoor shopping malls,* by smoking status and state --- Adult Tobacco Survey, United States, 2003--2007 |
||||||||||||||
|---|---|---|---|---|---|---|---|---|---|---|---|---|---|---|
|
State |
Year |
State smoke-free law in place at time of survey† |
Not allowed at all |
|||||||||||
|
Overall |
Current smokers§ |
Nonsmokers¶ |
||||||||||||
|
% |
(95% CI**) |
% |
(95% CI) |
% |
(95% CI) |
|||||||||
|
Alaska |
2003 |
Banned |
78.8 |
(76.5--80.9) |
71.5 |
(66.3--76.1) |
80.9 |
(78.3--83.3) |
||||||
|
Florida |
2003 |
None |
69.4 |
(65.4--73.2) |
57.3 |
(47.2--66.9) |
73.2 |
(69.1--77.0) |
||||||
|
2004 |
None |
73.0 |
(70.6--75.2) |
57.7 |
(51.7--63.4) |
76.5 |
(74.0--78.9) |
|||||||
|
2005 |
None |
79.5 |
(77.5--81.3) |
62.3 |
(56.0--68.1) |
83.1 |
(81.2--84.9) |
|||||||
|
2007 |
None |
82.2 |
(80.8--83.6) |
73.4 |
(69.1--77.3) |
84.0 |
(82.5--85.4) |
|||||||
|
Georgia |
2004 |
None |
75.4 |
(74.1--76.7) |
61.0 |
(57.5--64.3) |
78.7 |
(77.3--80.0) |
||||||
|
Idaho |
2005 |
Banned |
82.5 |
(80.7--84.2) |
74.0 |
(68.1--79.1) |
84.1 |
(82.2--85.8) |
||||||
|
Illinois |
2003 |
None |
65.8 |
(64.1--67.5) |
47.2 |
(42.9--51.5) |
70.4 |
(68.6--72.1) |
||||||
|
2005 |
None |
69.9 |
(68.4--71.3) |
55.5 |
(51.5--59.5) |
73.3 |
(71.8--74.8) |
|||||||
|
Iowa |
2004 |
Restricted to designated areas |
72.6 |
(69.6--75.3) |
58.6 |
(50.9--66.0) |
76.2 |
(73.2--79.0) |
||||||
|
2006 |
Restricted to designated areas |
77.9 |
(75.3--80.2) |
65.9 |
(58.2--72.8) |
80.5 |
(77.9--82.9) |
|||||||
|
Kansas |
2006 |
None |
77.5 |
(75.8--79.2) |
63.6 |
(58.0--68.9) |
80.5 |
(78.7--82.1) |
||||||
|
Montana |
2004 |
None |
74.0 |
(71.4--76.4) |
66.3 |
(59.4--72.6) |
75.7 |
(72.9--78.3) |
||||||
|
2005 |
Banned |
80.5 |
(77.9--82.8) |
69.0 |
(61.8--75.5) |
83.0 |
(80.3--85.3) |
|||||||
|
New Jersey |
2006 |
Banned |
80.8 |
(79.7--81.8) |
68.1 |
(64.3--71.7) |
82.7 |
(81.6--83.8) |
||||||
|
New Mexico |
2003 |
None |
72.0 |
(69.8--74.0) |
63.0 |
(57.8--68.0) |
74.1 |
(71.7--76.3) |
||||||
|
2006 |
None |
77.4 |
(75.3--79.4) |
72.2 |
(66.6--77.1) |
78.7 |
(76.4--80.9) |
|||||||
|
Ohio |
2004 |
None |
63.8 |
(62.0--65.6) |
47.0 |
(42.6--51.4) |
68.4 |
(66.4--70.4) |
||||||
|
Oklahoma |
2004 |
Banned |
72.1 |
(69.0--75.1) |
57.0 |
(49.3--64.5) |
76.1 |
(72.7--79.3) |
||||||
|
Pennsylvania |
2005 |
None |
68.0 |
(65.9--69.9) |
51.9 |
(46.9--56.8) |
72.4 |
(70.2--74.4) |
||||||
|
South Carolina |
2007 |
None |
77.4 |
(75.7--79.0) |
64.3 |
(59.1--69.1) |
80.7 |
(79.0--82.3) |
||||||
|
Median |
75.4 |
63.0 |
78.7 |
|||||||||||
|
* Determined by response to the following question: "In indoor shopping malls, do you think that smoking should be allowed in all areas, some areas, or not allowed at all?" † Information on state smoke-free laws in place at time of survey was obtained from the State Tobacco Activities Tracking and Evaluation (STATE) System (available at http://www.cdc.gov/tobacco/statesystem). § Current cigarette smokers were respondents who had smoked at least 100 cigarettes in their lifetime and, at the time of the interview, reported smoking cigarettes every day or some days. ¶ Nonsmokers include never smokers (smokers who had not smoked at least 100 cigarettes in their lifetime) and former smokers (smokers who had smoked at least 100 cigarettes in their lifetime but, at the time of the interview, reported no longer smoking at all). ** Confidence interval. |
||||||||||||||
|
TABLE 45. (Continued) Level of support among adults aged ≥18 years for smoke-free policies in public buildings,* by smoking status and state --- Adult Tobacco Survey, United States, 2003--2007 |
|||||||||||||
|---|---|---|---|---|---|---|---|---|---|---|---|---|---|
|
Not allowed at all |
|||||||||||||
|
State |
Year |
Overall |
Current smokers† |
Nonsmokers§ |
|||||||||
|
% |
(95% CI¶) |
% |
(95% CI) |
% |
(95% CI) |
||||||||
|
Georgia |
2004 |
75.5 |
(74.2--76.8) |
60.9 |
(57.5--64.3) |
78.8 |
(77.4--80.1) |
||||||
|
Idaho |
2005 |
78.0 |
(76.0--79.9) |
58.9 |
(52.1--65.3) |
81.4 |
(79.4--83.3) |
||||||
|
Iowa |
2004 |
66.7 |
(63.6--69.7) |
43.2 |
(35.7--51.0) |
72.5 |
(69.3--75.5) |
||||||
|
2006 |
71.2 |
(68.1--74.1) |
44.7 |
(36.7--53.0) |
76.7 |
(73.6--79.6) |
|||||||
|
Michigan |
2005 |
73.1 |
(71.3--74.8) |
51.2 |
(46.4--56.0) |
78.1 |
(76.2--79.8) |
||||||
|
Montana |
2004 |
72.1 |
(69.4--74.6) |
52.5 |
(45.2--59.7) |
76.4 |
(73.7--78.9) |
||||||
|
2006 |
77.3 |
(74.9--79.6) |
55.7 |
(47.7--63.5) |
81.7 |
(79.3--83.8) |
|||||||
|
New Mexico |
2003 |
73.6 |
(71.5--75.7) |
61.1 |
(55.7--66.2) |
76.8 |
(74.5--78.9) |
||||||
|
2006 |
76.1 |
(74.0--78.2) |
63.9 |
(57.8--69.6) |
79.2 |
(77.0--81.3) |
|||||||
|
Ohio |
2004 |
62.0 |
(60.2--63.9) |
39.7 |
(35.4--44.2) |
68.1 |
(66.1--70.1) |
||||||
|
2006 |
65.1 |
(63.6--66.7) |
41.2 |
(37.5--45.0) |
72.0 |
(70.3--73.6) |
|||||||
|
South Carolina |
2007 |
72.0 |
(70.1--73.8) |
51.4 |
(46.2--56.6) |
77.2 |
(75.4--78.9) |
||||||
|
Median |
72.6 |
52.0 |
77.0 |
||||||||||
|
* Determined by response to the following question: "In public buildings, do you think that smoking should be allowed in all areas, some areas, or not allowed at all?" † Current cigarette smokers were respondents who had smoked at least 100 cigarettes in their lifetime and, at the time of the interview, reported smoking cigarettes every day or some days. § Nonsmokers include never smokers (smokers who had not smoked at least 100 cigarettes in their lifetime) and former smokers (smokers who had smoked at least 100 cigarettes in their lifetime but, at the time of the interview, reported no longer smoking at all). ¶ Confidence interval. |
|||||||||||||
|
TABLE 46. (Continued) Level of support among adults aged ≥18 years for smoke-free policies in bars and cocktail lounges,* by smoking status and state --- Adult Tobacco Survey, United States, 2003--2007 |
||||||||||||||
|---|---|---|---|---|---|---|---|---|---|---|---|---|---|---|
|
State |
Year |
State smoke-free law in place at time of survey† |
Not allowed at all |
|||||||||||
|
Overall |
Current smokers§ |
Nonsmokers¶ |
||||||||||||
|
% |
(95% CI**) |
% |
(95% CI) |
% |
(95% CI) |
|||||||||
|
Arkansas |
2006 |
None |
34.8 |
(33.7--36.0) |
9.2 |
(7.6--11.1) |
42.5 |
(41.1--43.9) |
||||||
|
Georgia |
2004 |
None |
36.5 |
(35.1--38.0) |
11.0 |
(8.9--13.4) |
42.5 |
(40.9--44.2) |
||||||
|
Idaho |
2005 |
None |
34.0 |
(31.8--36.3) |
9.4 |
(6.4--13.5) |
38.7 |
(36.2--41.2) |
||||||
|
Iowa |
2004 |
None |
26.6 |
(23.8--29.5) |
5.1 |
(2.7--9.4) |
32.2 |
(28.9--35.6) |
||||||
|
2006 |
None |
32.5 |
(29.7--35.4) |
6.7 |
(3.9--11.2) |
38.1 |
(34.9--41.4) |
|||||||
|
Illinois |
2003 |
None |
27.8 |
(26.3--29.5) |
6.2 |
(4.4--8.8) |
33.3 |
(31.5--35.2) |
||||||
|
2005 |
None |
29.7 |
(28.3--31.2) |
6.6 |
(4.8--9.0) |
35.4 |
(33.8--37.0) |
|||||||
|
2007 |
None |
35.0 |
(33.4--36.6) |
7.3 |
(5.0--10.4) |
40.6 |
(38.9--42.4) |
|||||||
|
Kansas |
2006 |
None |
36.9 |
(35.0--38.9) |
8.4 |
(5.7--12.1) |
43.2 |
(40.9--45.4) |
||||||
|
Michigan |
2005 |
None |
33.5 |
(31.7--35.3) |
8.4 |
(6.0--11.5) |
39.3 |
(37.3--41.4) |
||||||
|
New Jersey |
2006 |
Banned |
44.2 |
(42.9--45.6) |
8.2 |
(6.6--10.2) |
49.9 |
(48.4--51.4) |
||||||
|
New Mexico |
2003 |
None |
28.4 |
(26.2--30.7) |
6.7 |
(4.5--9.8) |
33.7 |
(31.1--36.3) |
||||||
|
2006 |
None |
33.1 |
(30.8--35.4) |
9.2 |
(6.4--13.1) |
39.0 |
(36.4--41.7) |
|||||||
|
Ohio |
2006 |
Banned†† |
29.2 |
(27.8--30.7) |
4.7 |
(3.1--6.9) |
36.6 |
(34.8--38.4) |
||||||
|
Wyoming |
2004 |
None |
28.6 |
(26.3--31.0) |
4.9 |
(2.4--9.8) |
34.9 |
(32.2--37.6) |
||||||
|
2006 |
None |
32.6 |
(30.1--35.3) |
4.7 |
(2.7--8.0) |
40.4 |
(37.4--43.4) |
|||||||
|
2007 |
None |
37.9 |
(35.5--40.3) |
4.4 |
(2.8--6.9) |
46.5 |
(43.7--49.3) |
|||||||
|
Median |
33.1 |
6.7 |
39.0 |
|||||||||||
|
* Determined by response to the following question: "In bars and cocktail lounges, do you think smoking should be allowed in all areas, some areas, or not at all?" † Information on state smoke-free laws in place at time of survey was obtained from the State Tobacco Activities Tracking and Evaluation (STATE) System (available at http://www.cdc.gov/tobacco/statesystem). § Current cigarette smokers were respondents who had smoked at least 100 cigarettes in their lifetime and, at the time of the interview, reported smoking cigarettes every day or some days. ¶ Nonsmokers include never smokers (smokers who had not smoked at least 100 cigarettes in their lifetime) and former smokers (smokers who had smoked at least 100 cigarettes in their lifetime but, at the time of the interview, reported no longer smoking at all). ** Confidence interval. †† Implemented in fourth quarter of 2006. |
||||||||||||||
|
TABLE 47. (Continued) Level of support among adults aged ≥18 years for smoke-free policies in indoor sporting events and concerts,* by smoking status and state --- Adult Tobacco Survey, United States, 2003--2007 |
||||||||||||||
|---|---|---|---|---|---|---|---|---|---|---|---|---|---|---|
|
State |
Year |
State smoke-free law in place at time of survey† |
Not allowed at all |
|||||||||||
|
Overall |
Current smokers§ |
Nonsmokers¶ |
||||||||||||
|
% |
(95% CI**) |
% |
(95% CI) |
% |
(95% CI) |
|||||||||
|
Arkansas |
2006 |
Banned |
75.2 |
(74.0--76.3) |
56.9 |
(53.9--59.8) |
80.5 |
(79.3--81.6) |
||||||
|
Georgia |
2004 |
None |
73.6 |
(72.2--74.9) |
55.1 |
(51.5--58.6) |
77.7 |
(76.3--79.1) |
||||||
|
Idaho |
2005 |
Banned |
77.5 |
(75.4--79.5) |
58.0 |
(51.3--64.3) |
81.0 |
(78.9--83.0) |
||||||
|
Iowa |
2004 |
Restricted to designated areas |
76.4 |
(73.5--79.1) |
51.1 |
(43.3--58.8) |
82.7 |
(79.9--85.3) |
||||||
|
2006 |
Restricted to designated areas |
75.3 |
(72.2--78.1) |
52.8 |
(44.5--61.0) |
80.2 |
(77.1--83.0) |
|||||||
|
Montana |
2004 |
Restricted to designated areas |
76.5 |
(73.8--79.0) |
59.1 |
(51.5--66.2) |
80.4 |
(77.7--82.9) |
||||||
|
2006 |
Banned |
82.5 |
(80.1--84.7) |
59.4 |
(51.1--67.2) |
87.1 |
(84.9--88.9) |
|||||||
|
New Mexico |
2003 |
None |
72.1 |
(69.9--74.3) |
56.0 |
(50.6--61.4) |
76.0 |
(73.5--78.3) |
||||||
|
Median |
75.9 |
56.5 |
80.5 |
|||||||||||
|
* Determined by response to the following question: "In indoor sporting events and concerts, do you think that smoking should be allowed in all areas, some areas, or not allowed at all?" † Information on state smoke-free laws in place at time of survey was obtained from the State Tobacco Activities Tracking and Evaluation (STATE) System (available at http://www.cdc.gov/tobacco/statesystem). § Current cigarette smokers were respondents who had smoked at least 100 cigarettes in their lifetime and, at the time of the interview, reported smoking cigarettes every day or some days. ¶ Nonsmokers include never smokers (smokers who had not smoked at least 100 cigarettes in their lifetime) and former smokers (smokers who had smoked at least 100 cigarettes in their lifetime but, at the time of the interview, reported no longer smoking at all). ** Confidence interval. |
||||||||||||||
|
TABLE 48. (Continued) Level of support among adults aged ≥18 years for tobacco-free policies in schools,* by smoking status and state --- Adult Tobacco Survey, United States, 2003--2007 |
|||||||||||||
|---|---|---|---|---|---|---|---|---|---|---|---|---|---|
|
Disagree |
Strongly disagree |
||||||||||||
|
State |
Year |
Overall |
Current smokers† |
Nonsmokers§ |
Overall |
Current smokers |
Nonsmokers |
||||||
|
% |
(95% CI¶) |
% |
(95% CI) |
% |
(95% CI) |
% |
(95% CI) |
% |
(95% CI) |
% |
(95% CI) |
||
|
Arkansas |
2006 |
6.7 |
(6.0--7.5) |
13.3 |
(11.1--16.0) |
4.8 |
(4.2--5.4) |
2.1 |
(1.8--2.6) |
3.9 |
(2.9--5.2) |
1.6 |
(1.3--2.0) |
|
Idaho |
2005 |
4.6 |
(3.6--5.8) |
10.3 |
(6.3--16.5) |
3.5 |
(2.7--4.6) |
1.6 |
(1.1--2.3) |
3.6 |
(1.9--6.5) |
1.2 |
(0.7--1.9) |
|
Iowa |
2004 |
6.6 |
(5.1--8.5) |
13.4 |
(8.6--20.3) |
4.9 |
(3.6--6.6) |
0.9 |
(0.4--1.6) |
1.9 |
(0.7--4.7) |
0.6 |
(0.3--1.5) |
|
Kansas |
2006 |
6.0 |
(5.0--7.0) |
11.8 |
(8.9--15.6) |
4.7 |
(3.9--5.8) |
1.5 |
(1.0--2.4) |
1.4 |
(0.8--2.5) |
1.6 |
(0.9--2.7) |
|
Michigan |
2005 |
6.7 |
(5.8--7.8) |
13.1 |
(10.2--16.7) |
5.3 |
(4.4--6.3) |
2.8 |
(2.2--3.6) |
5.3 |
(3.2--8.9) |
2.2 |
(1.7--2.9) |
|
Montana |
2004 |
5.5 |
(4.1--7.4) |
11.7 |
(7.1--18.9) |
4.1 |
(2.8--5.9) |
1.7 |
(1.1--2.4) |
1.7 |
(0.7--4.0) |
1.7 |
(1.1--2.5) |
|
2005 |
4.0 |
(3.0--5.3) |
10.5 |
(6.5--16.4) |
2.6 |
(1.8--3.6) |
3.0 |
(1.9--4.5) |
4.8 |
(2.5--8.9) |
2.6 |
(1.5--4.4) |
|
|
New Mexico |
2003 |
4.3 |
(3.5--5.2) |
8.4 |
(6.1--11.3) |
3.3 |
(2.5--4.3) |
1.1 |
(0.7--1.7) |
2.1 |
(1.0--4.5) |
0.9 |
(0.5--1.5) |
|
2006 |
4.4 |
(3.4--5.7) |
9.5 |
(6.3--14.1) |
3.1 |
(2.2--4.5) |
2.4 |
(1.7--3.3) |
4.2 |
(2.3--7.5) |
1.9 |
(1.3--2.8) |
|
|
Ohio |
2006 |
9.0 |
(8.1--10.0) |
18.6 |
(15.9--21.5) |
6.2 |
(5.3--7.2) |
2.3 |
(1.8--2.8) |
4.1 |
(2.9--5.7) |
1.7 |
(1.3--2.3) |
|
Oklahoma |
2004 |
6.0 |
(4.6--7.9) |
15.2 |
(10.3--21.8) |
3.5 |
(2.4--4.9) |
1.1 |
(0.6--2.2) |
3.3 |
(1.3--8.4) |
0.5 |
(0.3--1.0) |
|
South Carolina |
2007 |
7.2 |
(6.2--8.3) |
14.5 |
(11.4--18.2) |
5.4 |
(4.5--6.5) |
1.7 |
(1.2--2.5) |
3.5 |
(1.6--7.3) |
1.2 |
(0.8--1.8) |
|
Median |
6.0 |
12.5 |
4.4 |
1.7 |
3.6 |
1.6 |
|||||||
|
* Determined by response to the following question: "How strongly do you agree or disagree with the following statement? Tobacco use by adults should not be allowed on school grounds or at any school event." † Current cigarette smokers were respondents who had smoked at least 100 cigarettes in their lifetime and, at the time of the interview, reported smoking cigarettes every day or some days. § Nonsmokers include never smokers (smokers who had not smoked at least 100 cigarettes in their lifetime) and former smokers (smokers who had smoked at least 100 cigarettes in their lifetime but, at the time of the interview, reported no longer smoking at all). ¶ Confidence interval. |
|||||||||||||
|
TABLE 49. (Continued) Perceptions of the health effects of secondhand smoke among adults aged ≥18 years,* by smoking status and state --- Adult Tobacco Survey, United States, 2003--2007 |
|||||||||||||
|---|---|---|---|---|---|---|---|---|---|---|---|---|---|
|
Not very harmful |
Not harmful at all |
||||||||||||
|
State |
Year |
Overall |
Current smokers† |
Nonsmokers§ |
Overall |
Current smokers |
Nonsmokers |
||||||
|
% |
(95% CI¶) |
% |
(95% CI) |
% |
(95% CI) |
% |
(95% CI) |
% |
(95% CI) |
% |
(95% CI) |
||
|
Alaska |
2003 |
3.9 |
(3.0--5.2) |
9.6 |
(6.5--13.9) |
2.3 |
(1.5--3.3) |
2.1 |
(1.5--3.1) |
4.3 |
(2.5--7.4) |
1.5 |
(0.9--2.5) |
|
Arkansas |
2006 |
5.0 |
(4.5--5.5) |
10.3 |
(8.9--11.9) |
3.5 |
(3.0--4.0) |
2.9 |
(2.4--3.5) |
8.7 |
(6.6--11.2) |
1.3 |
(1.0--1.5) |
|
2003 |
8.6 |
(6.4--11.3) |
18.5 |
(12.0--27.5) |
5.5 |
(3.9--7.9) |
3.5 |
(2.3--5.3) |
7.2 |
(3.9--13.1) |
2.3 |
(1.3--4.2) |
|
|
Florida |
2004 |
4.6 |
(3.7--5.7) |
10.6 |
(7.8--14.3) |
3.2 |
(2.4--4.3) |
2.9 |
(2.2--3.9) |
8.0 |
(5.2--12.1) |
1.8 |
(1.2--2.6) |
|
2005 |
5.8 |
(4.7--7.1) |
14.8 |
(10.4--20.6) |
4.0 |
(3.1--5.1) |
2.2 |
(1.7--2.9) |
4.1 |
(2.7--6.4) |
1.8 |
(1.3--2.5) |
|
|
2006 |
3.8 |
(3.1--4.7) |
6.3 |
(4.4--9.0) |
3.3 |
(2.6--4.3) |
2.5 |
(1.8--3.4) |
4.7 |
(3.2--6.7) |
2.0 |
(1.3--3.1) |
|
|
2007 |
4.1 |
(3.4--4.9) |
10.4 |
(7.7--14.0) |
2.9 |
(2.3--3.6) |
3.0 |
(2.3--3.8) |
6.3 |
(4.5--8.6) |
2.3 |
(1.7--3.2) |
|
|
Georgia |
2004 |
4.1 |
(3.6--4.7) |
9.5 |
(7.8--11.5) |
2.9 |
(2.4--3.5) |
1.7 |
(1.4--2.0) |
4.2 |
(3.1--5.5) |
1.1 |
(0.8--1.4) |
|
Hawaii |
2006 |
3.5 |
(2.6--4.7) |
11.7 |
(7.1--18.5) |
2.3 |
(1.6--3.3) |
2.9 |
(1.9--4.4) |
5.4 |
(2.9--9.8) |
2.6 |
(1.6--4.2) |
|
Illinois |
2003 |
5.4 |
(4.7--6.2) |
12.1 |
(9.6--15.2) |
3.8 |
(3.2--4.5) |
2.9 |
(2.4--3.6) |
6.8 |
(4.9--9.3) |
2.0 |
(1.5--2.7) |
|
2005 |
5.1 |
(4.5--5.9) |
11.2 |
(9.0--13.8) |
3.7 |
(3.1--4.4) |
2.1 |
(1.7--2.6) |
5.0 |
(3.8--6.7) |
1.4 |
(1.1--1.9) |
|
|
2007 |
5.8 |
(5.1--6.7) |
14.1 |
(11.3--17.5) |
4.2 |
(3.5--4.9) |
2.4 |
(1.9--3.0) |
5.7 |
(4.1--7.8) |
1.7 |
(1.2--2.4) |
|
|
Iowa |
2004 |
4.6 |
(3.4--6.2) |
11.9 |
(7.5--18.2) |
2.8 |
(1.9--4.2) |
2.1 |
(1.2--3.6) |
5.9 |
(3.0--11.2) |
1.1 |
(0.4--3.0) |
|
2006 |
3.3 |
(2.4--4.4) |
9.6 |
(6.2--14.5) |
2.0 |
(1.3--2.9) |
1.9 |
(1.3--2.7) |
4.5 |
(2.5--8.1) |
1.3 |
(0.8--2.2) |
|
|
Kansas |
2006 |
4.2 |
(3.5--5.0) |
7.6 |
(5.7--10.0) |
3.5 |
(2.8--4.3) |
2.0 |
(1.4--2.8) |
4.2 |
(2.8--6.3) |
1.5 |
(0.9--2.5) |
|
Michigan |
2005 |
4.6 |
(3.8--5.6) |
10.3 |
(7.9--13.4) |
3.3 |
(2.5--4.4) |
2.4 |
(1.8--3.1) |
6.0 |
(4.0--8.9) |
1.6 |
(1.1--2.3) |
|
Montana |
2004 |
5.5 |
(4.3--7.1) |
12.7 |
(8.4--18.7) |
4.0 |
(2.9--5.5) |
1.6 |
(1.0--2.5) |
6.0 |
(3.4--10.7) |
0.7 |
(0.3--1.4) |
|
2005 |
4.1 |
(3.1--5.5) |
10.5 |
(6.5--16.6) |
2.7 |
(1.9--3.8) |
1.9 |
(1.2--3.0) |
4.3 |
(2.3--7.8) |
1.4 |
(0.8--2.6) |
|
|
2006 |
5.1 |
(4.0--6.5) |
10.9 |
(7.6--15.5) |
4.0 |
(2.9--5.5) |
2.4 |
(1.5--3.8) |
6.4 |
(2.6--14.9) |
1.6 |
(1.0--2.4) |
|
|
New Jersey |
2006 |
3.9 |
(3.4--4.4) |
9.3 |
(7.5--11.6) |
3.2 |
(2.7--3.8) |
1.8 |
(1.5--2.2) |
6.5 |
(4.9--8.6) |
1.0 |
(0.8--1.3) |
|
New Mexico |
2003 |
4.4 |
(3.6--5.4) |
9.1 |
(6.6--12.6) |
3.3 |
(2.5--4.4) |
2.1 |
(1.6--2.8) |
5.2 |
(3.4--7.8) |
1.5 |
(1.0--2.1) |
|
2006 |
4.8 |
(3.8--6.0) |
9.4 |
(6.2--14.0) |
3.6 |
(2.7--4.7) |
2.4 |
(1.7--3.4) |
9.5 |
(6.2--14.3) |
0.8 |
(0.5--1.3) |
|
|
Ohio |
2004 |
4.9 |
(4.2--5.9) |
9.7 |
(7.4--12.6) |
3.6 |
(2.9--4.5) |
3.2 |
(2.5--4.0) |
8.8 |
(6.2--12.2) |
1.7 |
(1.2--2.3) |
|
2006 |
4.1 |
(3.5--4.8) |
8.5 |
(6.8--10.6) |
2.9 |
(2.3--3.6) |
2.6 |
(2.2--3.2) |
5.1 |
(3.9--6.7) |
2.0 |
(1.5--2.6) |
|
|
Oklahoma |
2004 |
3.2 |
(2.3--4.5) |
9.4 |
(6.0--14.3) |
1.6 |
(1.0--2.7) |
3.2 |
(1.9--5.4) |
9.2 |
(4.6--17.5) |
1.6 |
(0.8--3.4) |
|
Pennsylvania |
2005 |
6.4 |
(5.4--7.5) |
15.5 |
(12.3--19.3) |
4.0 |
(3.2--4.9) |
2.1 |
(1.5--2.9) |
4.9 |
(3.1--7.6) |
1.4 |
(0.9--2.1) |
|
South Carolina |
2007 |
4.5 |
(3.6--5.5) |
10.7 |
(7.5--15.2) |
3.0 |
(2.5--3.7) |
1.9 |
(1.5--2.4) |
4.2 |
(2.8--6.2) |
1.3 |
(1.0--1.8) |
|
West Virginia |
2005 |
4.8 |
(3.8--6.0) |
7.5 |
(5.1--10.8) |
3.8 |
(2.9--5.1) |
3.1 |
(2.3--4.1) |
7.2 |
(4.9--10.5) |
1.7 |
(1.1--2.6) |
|
2007 |
4.4 |
(3.3--5.9) |
9.1 |
(6.3--13.1) |
3.0 |
(1.9--4.6) |
3.1 |
(2.4--4.2) |
6.6 |
(4.5--9.5) |
2.1 |
(1.3--3.2) |
|
|
Wyoming |
2004 |
4.2 |
(3.4--5.3) |
10.7 |
(7.7--14.7) |
2.7 |
(2.0--3.6) |
2.2 |
(1.6--3.0) |
5.5 |
(3.4--8.7) |
1.3 |
(0.9--2.0) |
|
2006 |
4.7 |
(3.7--6.1) |
11.9 |
(8.3--16.6) |
3.0 |
(2.1--4.2) |
1.2 |
(0.8--1.8) |
2.0 |
(1.1--3.7) |
1.0 |
(0.6--1.7) |
|
|
2007 |
4.0 |
(3.2--4.9) |
10.8 |
(7.9--14.4) |
2.3 |
(1.7--3.1) |
1.6 |
(1.1--2.3) |
4.4 |
(2.6--7.4) |
0.9 |
(0.6--1.5) |
|
|
Median |
4.6 |
10.5 |
3.3 |
2.3 |
5.6 |
1.5 |
|||||||
|
* Determined by response to the following question: "Do you think that breathing smoke from other people's cigarettes is: very harmful to one's health, somewhat harmful to one's health, not very harmful to one's health, or not harmful at all to one's health?" † Current cigarette smokers were respondents who had smoked at least 100 cigarettes in their lifetime and, at the time of the interview, reported smoking cigarettes every day or some days. § Nonsmokers include never smokers (smokers who had not smoked at least 100 cigarettes in their lifetime) and former smokers (smokers who had smoked at least 100 cigarettes in their lifetime but, at the time of the interview, reported no longer smoking at all). ¶ Confidence interval. |
|||||||||||||
|
TABLE 58. Level of support among adults aged ≥18 years for increasing excise tax on tobacco products,* by smoking status and state --- Adult Tobacco Survey, United States, 2003--2007 |
||||||||||||||
|---|---|---|---|---|---|---|---|---|---|---|---|---|---|---|
|
State |
Year |
State excise tax per pack,† $ |
>$2 per pack |
$2 per pack |
$1 per pack |
$0.50--$0.99 per pack |
<$0.50 per pack |
No tax increase |
||||||
|
% |
(95% CI§) |
% |
(95% CI) |
% |
(95% CI) |
% |
(95% CI) |
% |
(95% CI) |
% |
(95% CI) |
|||
|
Overall |
||||||||||||||
|
Georgia |
2004 |
0.37 |
26.5 |
(25.2--27.9) |
16.9 |
(15.8--18.2) |
13.5 |
(12.5--14.6) |
6.8 |
(6.1--7.7) |
5.4 |
(4.7--6.1) |
30.8 |
(29.4--32.3) |
|
Idaho |
2005 |
0.57 |
27.9 |
(25.6--30.2) |
16.7 |
(14.9--18.7) |
14.8 |
(12.9--16.8) |
6.1 |
(5.0--7.6) |
5.5 |
(4.4--6.7) |
29.0 |
(26.7--31.5) |
|
Iowa |
2004 |
0.36 |
20.1 |
(17.5--22.9) |
11.7 |
(9.6--14.2) |
16.8 |
(14.2--19.8) |
10.3 |
(8.2--12.8) |
10.4 |
(8.4--12.9) |
30.7 |
(27.5--34.2) |
|
Montana |
2006 |
1.70 |
29.9 |
(27.4--32.6) |
16.6 |
(14.5--18.9) |
15.6 |
(13.5--18.0) |
6.8 |
(5.3--8.6) |
2.0 |
(1.4--2.9) |
29.0 |
(26.4--31.8) |
|
South Carolina |
2007 |
0.07 |
28.4 |
(26.6--30.3) |
15.9 |
(14.5--17.4) |
14.5 |
(12.9--16.2) |
7.1 |
(6.1--8.2) |
4.5 |
(3.7--5.4) |
29.6 |
(27.6--31.6) |
|
Median |
0.37 |
27.9 |
16.6 |
14.8 |
6.8 |
5.4 |
29.6 |
|||||||
|
Current smokers¶ |
||||||||||||||
|
Georgia |
2004 |
0.37 |
6.8 |
(5.1--9.1) |
6.7 |
(5.1--8.8) |
12.7 |
(10.3--15.6) |
8.6 |
(6.8--10.8) |
10.8 |
(8.7--13.4) |
54.3 |
(50.7--57.9) |
|
Idaho |
2005 |
0.57 |
4.3 |
(2.2--8.3) |
5.3 |
(2.8--9.6) |
14.8 |
(10.1--21.1) |
7.4 |
(4.7--11.6) |
13.0 |
(9.3--17.8) |
55.3 |
(48.3--62.0) |
|
Iowa |
2004 |
0.36 |
3.9 |
(1.6--9.1) |
4.3 |
(1.7--10.6) |
9.7 |
(5.9--15.7) |
8.1 |
(4.9--13.0) |
17.2 |
(11.5--25.0) |
56.8 |
(48.3--64.9) |
|
Montana |
2006 |
1.70 |
2.7 |
(1.2--6.0) |
4.9 |
(2.8--8.6) |
16.1 |
(10.9--23.2) |
15.4 |
(10.2--22.5) |
4.3 |
(2.5--7.5) |
56.5 |
(48.5--64.3) |
|
South Carolina |
2007 |
0.07 |
4.9 |
(3.4--7.0) |
9.2 |
(6.5--12.8) |
10.1 |
(7.1--14.0) |
10.2 |
(7.6--13.6) |
12.1 |
(9.3--15.7) |
53.5 |
(48.2--58.7) |
|
Median |
0.37 |
4.3 |
5.3 |
12.7 |
8.6 |
12.1 |
55.3 |
|||||||
|
Former smokers** |
||||||||||||||
|
Georgia |
2004 |
0.37 |
25.9 |
(23.4--28.6) |
16.8 |
(14.7--19.2) |
13.7 |
(11.9--15.8) |
7.0 |
(5.6--8.7) |
4.7 |
(3.6--6.2) |
31.8 |
(28.9--34.8) |
|
Idaho |
2005 |
0.57 |
23.9 |
(20.1--28.1) |
18.2 |
(14.8--22.2) |
14.9 |
(11.8--18.7) |
5.7 |
(3.9--8.3) |
4.3 |
(2.8--6.5) |
33.0 |
(28.7--37.6) |
|
Iowa |
2004 |
0.36 |
17.6 |
(13.1--23.2) |
11.5 |
(7.7--16.7) |
20.9 |
(14.7--28.8) |
11.1 |
(7.7--15.7) |
9.3 |
(6.0--14.1) |
29.7 |
(23.9--36.2) |
|
Montana |
2006 |
1.70 |
29.1 |
(24.8--33.8) |
17.5 |
(14.1--21.7) |
16.9 |
(13.1--21.6) |
5.8 |
(4.0--8.2) |
1.8 |
(0.9--3.9) |
28.8 |
(24.6--33.4) |
|
South Carolina |
2007 |
0.07 |
30.9 |
(27.9--34.0) |
16.4 |
(14.2--18.8) |
16.0 |
(13.5--18.8) |
7.6 |
(6.1--9.6) |
3.7 |
(2.6--5.1) |
25.5 |
(22.5--28.7) |
|
Median |
0.37 |
25.9 |
16.8 |
16.0 |
7.0 |
4.3 |
29.7 |
|||||||
|
Never smokers†† |
||||||||||||||
|
Georgia |
2004 |
0.37 |
33.5 |
(31.6--35.6) |
20.6 |
(18.9--22.4) |
13.5 |
(12.1--14.9) |
6.2 |
(5.2--7.4) |
3.8 |
(3.1--4.7) |
22.4 |
(20.7--24.3) |
|
Idaho |
2005 |
0.57 |
36.1 |
(32.9--39.4) |
19.4 |
(16.9--22.2) |
14.7 |
(12.3--17.5) |
6.0 |
(4.4--8.0) |
3.8 |
(2.7--5.3) |
20.0 |
(17.4--22.8) |
|
Iowa |
2004 |
0.36 |
27.1 |
(23.2--31.4) |
14.5 |
(11.5--18.1) |
17.8 |
(14.5--21.7) |
10.8 |
(7.8--14.7) |
8.4 |
(6.1--11.3) |
21.5 |
(17.6--25.9) |
|
Montana |
2006 |
1.70 |
39.5 |
(35.6--43.4) |
20.0 |
(16.9--23.5) |
14.9 |
(12.3--17.9) |
4.4 |
(2.9--6.6) |
1.3 |
(0.7--2.5) |
19.9 |
(16.9--23.3) |
|
South Carolina |
2007 |
0.07 |
35.8 |
(33.0--38.6) |
18.3 |
(16.2--20.5) |
15.5 |
(13.3--18.0) |
5.7 |
(4.6--7.2) |
2.1 |
(1.4--2.9) |
22.7 |
(20.3--25.2) |
|
Median |
0.37 |
35.8 |
19.4 |
14.9 |
6.0 |
3.8 |
21.5 |
|||||||
|
* Determined by response to the following question: "How much additional tax on a pack of cigarettes would you be willing to support if some or all the money raised was used to fund tobacco control programs?" † State excise tax estimates obtained from the State Tobacco Activities Tracking and Evaluation (STATE) System (available at http://www.cdc.gov/tobacco/statesystem). § Confidence interval. ¶ Current cigarette smokers were respondents who had smoked at least 100 cigarettes in their lifetime and, at the time of the interview, reported smoking cigarettes every day or some days. ** Former smokers were respondents who had smoked at least 100 cigarettes in their lifetime but, at the time of the interview, reported no longer smoking at all. †† Never smokers were respondents who had not smoked 100 cigarettes in their lifetime. |
||||||||||||||
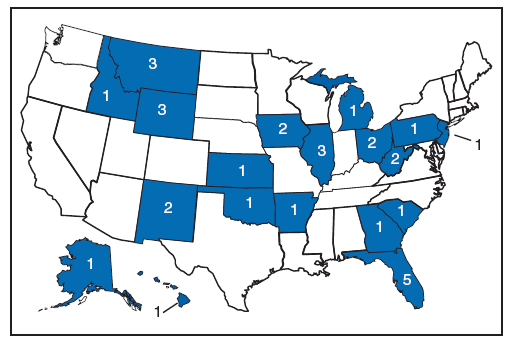
Alternate Text: Figure 1 shows a map of the 19 states in which the Adult Tobacco Survey was conducted during 2003-2007 and the number of surveys conducted by each state during those years: Alaska (1), Arkansas (1), Florida (5), Georgia (1), Hawaii (1), Idaho (1), Illinois (3), Kansas (1), Michigan (1), Montana (3), New Jersey (1), New Mexico (2), Ohio (2), Oklahoma (1), Pennsylvania (1), West Virginia (2), South Carolina (1), and Wyoming (3).
FIGURE 2. Number of cigarettes smoked per day in preceding 30 days among daily smokers* aged ≥18 years, by state --- Adult Tobacco Survey, United States, 2003--2007
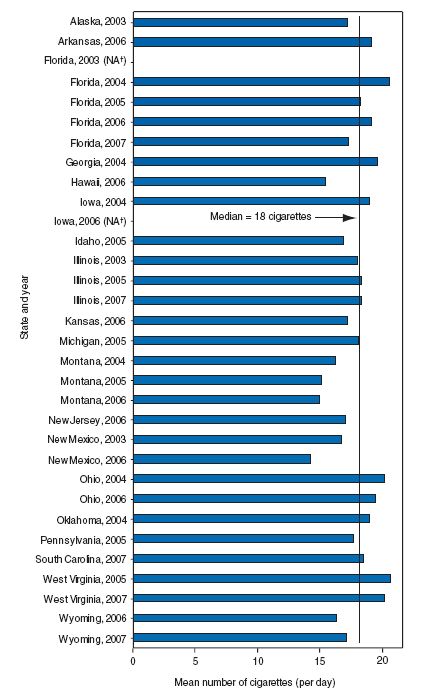
* Daily smokers were respondents who had smoked at least 100 cigarettes in their lifetime and, at the time of the interview, reported smoking cigarettes every day.
† Not analyzed (number of respondents <50).
Alternate Text: Figure 2 is a bar chart showing the mean number of smoked per day in preceding 30 days among daily smokers (respondents who had smoked at least 100 cigarettes in their lifetime and, at the time of the interview, reported smoking cigarettes every day) aged ≥18 years, by state, during 2003-2007. Among 32 ATSs, the mean number of cigarettes smoked per day by daily smokers ranged from 14.2 cigarettes (New Mexico in 2006) to 20.6 cigarettes (West Virginia in 2005) (median: 18.0 cigarettes).
FIGURE 3. Mean number of cigarettes smoked per day in preceding 30 days among some-day smokers* aged ≥18 years, by state --- Adult Tobacco Survey, United States, 2003--2007
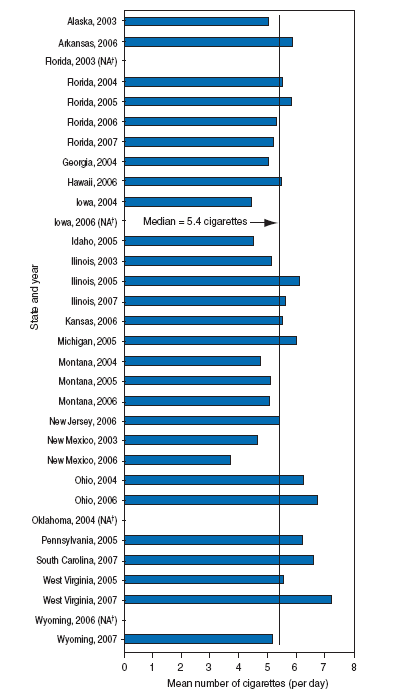
* Some-day smokers were respondents who had smoked at least 100 cigarettes in their lifetime and, at the time of the interview, reported smoking cigarettes some days.
† Not analyzed (number of respondents <50).
Alternate Text: Figure 3 is a bar chart showing the mean number of cigarettes smoked per day in the preceding 30 days among some-day smokers (respondents who had smoked at least 100 cigarettes in their lifetime and, at the time of the interview, reported smoking cigarettes some days) aged ≥18 years, by state, during 2003-2007. Among 28 ATSs, the mean number of cigarettes smoked per day by some-day smokers on the days they smoked ranged from 3.7 cigarettes (New Mexico in 2006) to 7.2 cigarettes (West Virginia in 2007) (median: 5.4 cigarettes).
FIGURE 4. Brand of cigarettes usually smoked by current smokers* aged ≥18 years, by sex --- Adult Tobacco Survey, United States, 2003--2007†
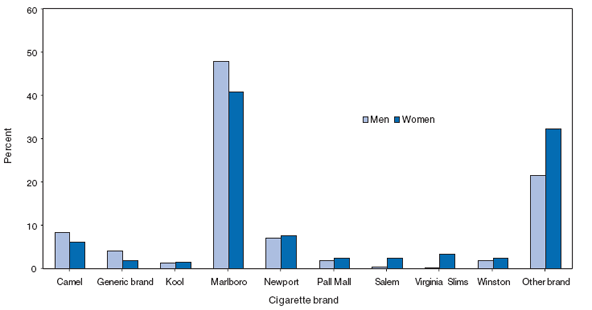
* Current cigarette smokers were respondents who had smoked at least 100 cigarettes in their lifetime and, at the time of the interview, reported smoking cigarettes every day or some days.
† From surveys in Michigan in 2005, Montana in 2004 and 2005, and New Jersey in 2006.
Alternate Text: Figure 4 is a bar chart that shows the brand of cigarettes usually smoked by current smokers (respondents who had smoked at least 100 cigarettes in their lifetime and, at the time of the interview, reported smoking cigarettes every day or some days) aged ≥18 years, by sex, during 2003-2007. Among four ATSs (Michigan in 2005, Montana in 2004 and 2005, and New Jersey in 2006), the largest differences between men and women in brand use were observed for Camel, Marlboro, Salem, Virginia Slims, generic brands, and other brands. Among men, use of other brands of cigarettes ranged from 18.0% (Montana in 2005) to 21.2% (Montana in 2004) (median: 21.5%) and among women, ranged from 24.5% (New Jersey in 2006) to 37.5% (Michigan in 2005) (median: 32.2%). Among men, Marlboro use ranged from 44.9% (Michigan in 2005) to 52.7% (Montana in 2004) (median: 47.9%) and among women, ranged from 28.6% (Michigan in 2005) to 47.6% (Montana in 2004) (median: 40.9%). Among men, Salem use ranged from 0.0% (Montana in 2004 and Montana in 2005) to 2.0% (New Jersey in 2006) (median: 0.4%) and among women, ranged from 1.0% (Montana in 2005) to 3.2% (Michigan in 2005) (median: 2.4%). Among men, Virginia Slims use ranged from 0.0% (Montana in 2005) to 2.4% (Montana in 2004) (median: 0.3%) and among women, ranged from 1.0% (Montana in 2004) to 5.8% (New Jersey in 2006) (median: 3.3%). Among men, Camel brand use ranged from 4.0% (New Jersey in 2006) to 18.4% (Montana in 2005) (median: 8.3%) and among women, ranged from 2.8% (Michigan in 2005 and New Jersey in 2006) to 10.4% (Montana in 2005) (median: 6.1%). Among men, use of generic brand cigarettes ranged from 0.1% (New Jersey in 2006) to 7.6% (Montana in 2004) (median: 4.0%) and among women, ranged from 0.3% (New Jersey in 2006) to 3.5% (Montana in 2004) (median: 1.9%).
FIGURE 5. Brand of cigarettes usually smoked by current smokers* aged ≥18 years, by age --- Adult Tobacco Survey, United States, 2003--2007†
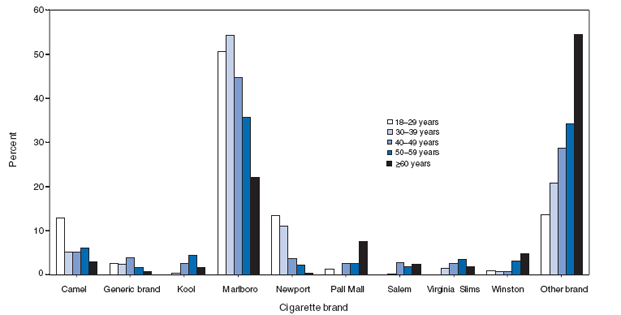
* Current cigarette smokers were respondents who had smoked at least 100 cigarettes in their lifetime and, at the time of the interview, reported smoking cigarettes every day or some days.
† From surveys in Michigan in 2005, Montana in 2004 and 2005, and New Jersey in 2006.
Alternate Text: Figure 5 is a bar chart that shows the brand of cigarettes usually smoked by current smokers (respondents who had smoked at least 100 cigarettes in their lifetime and, at the time of the interview, reported smoking cigarettes every day or some days) aged ≥18 years, by age, during 2003-2007. Among four ATSs (Michigan in 2005, Montana in 2004 and 2005, and New Jersey in 2006), among named cigarette brands, Marlboro was the most frequently used brand among all age groups. Approximately 50 percent of smokers aged 18-29 years and 30-39 years smoked Marlboro brand cigarettes. Among adults aged 18-29 years, Marlboro use ranged from 44.0% (New Jersey) to 57.0% (Montana in 2004) (median: 50.7%), use of other brands of cigarettes ranged from 9.1% (Montana in 2005) to 18.6% (Montana in 2004) (median: 13.6%), and Newport use ranged from 0.5% (Montana in 2004) to 32.1% (New Jersey in 2006) (median: 13.5%). Among adults aged 30-39 years, Marlboro use ranged from 44.2% (New Jersey in 2006) to 66.5% (Montana in 2004) (median: 54.3%), use of other brands ranged from 9.8% (Montana in 2004) to 26.0% (Michigan in 2005) (median: 20.8%), and Newport use ranged from 0.0% (Montana in 2004) to 24.2% (New Jersey) (median: 11.1%). Marlboro use was most commonly reported among adults aged 40-49 years and adults aged 50-59 years. Marlboro use by adults aged 40-49 years ranged from 36.5% (Michigan in 2005) to 49.2% (Montana in 2005) (median: 44.8%) and Marlboro use by adults aged 50-59 years ranged from 19.6% (Michigan in 2005) to 53.4% (Montana in 2004) (median: 35.8%). Among adults aged ≥60 years, other brand use was most commonly reported and ranged from 31.8% (New Jersey in 2006) to 65.0% (Montana in 2004) (median: 54.5%).
Use of trade names and commercial sources is for identification only and does not imply endorsement by the U.S. Department of
Health and Human Services.
References to non-CDC sites on the Internet are
provided as a service to MMWR readers and do not constitute or imply
endorsement of these organizations or their programs by CDC or the U.S.
Department of Health and Human Services. CDC is not responsible for the content
of pages found at these sites. URL addresses listed in MMWR were current as of
the date of publication.
All MMWR HTML versions of articles are electronic conversions from typeset documents.
This conversion might result in character translation or format errors in the HTML version.
Users are referred to the electronic PDF version (http://www.cdc.gov/mmwr)
and/or the original MMWR paper copy for printable versions of official text, figures, and tables.
An original paper copy of this issue can be obtained from the Superintendent of Documents, U.S.
Government Printing Office (GPO), Washington, DC 20402-9371;
telephone: (202) 512-1800. Contact GPO for current prices.
**Questions or messages regarding errors in formatting should be addressed to
mmwrq@cdc.gov.
