Wireless Substitution: Early Release of Estimates From the National Health Interview Survey, July – December 2008
by Stephen J. Blumberg, Ph.D., and Julian V. Luke, Division of Health Interview Statistics, National Center for Health Statistics
PDF Version (358 KB)
Overview
Preliminary results from the July-December 2008 National Health Interview Survey (NHIS) indicate that the number of American homes with only wireless telephones continues to grow. More than one of every five American homes (20.2%) had only wireless telephones (also known as cellular telephones, cell phones, or mobile phones) during the second half of 2008, an increase of 2.7 percentage points since the first half of 2008. This is the largest 6-month increase observed since NHIS began collecting data on wireless-only households in 2003. In addition, one of every seven American homes (14.5%) received all or almost all calls on wireless telephones, despite having a landline telephone in the home. This report presents the most up-to-date estimates available from the federal government concerning the size and characteristics of these populations.
NHIS Early Release Program
This report is published as part of the NHIS Early Release Program. In May and December of each year, the Centers for Disease Control and Prevention’s National Center for Health Statistics (NCHS) releases selected estimates of telephone coverage for the civilian, noninstitutionalized U.S. population based on data from NHIS, along with comparable estimates from NHIS for the previous 3 years. The estimates are based on in-person interviews that NHIS conducts continuously throughout the year to collect information on health status, health-related behaviors, and health care utilization. The survey also includes information about household telephones and whether anyone in the household has a wireless telephone.
Two additional reports are published as part of the Early Release Program. Early Release of Selected Estimates Based on Data from the National Health Interview Survey is published quarterly and provides estimates of 15 selected measures of health. Health Insurance Coverage: Early Release of Estimates from the National Health Interview Survey is also published quarterly and provides additional estimates of health insurance coverage.
Methods
For many years, NHIS has included questions on residential telephone numbers, to permit recontacting of survey participants. Starting in 2003, additional questions were asked, to determine whether the family’s telephone number was a landline telephone. All survey respondents were also asked whether “you or anyone in your family has a working cellular telephone.”
A “family” can be an individual or a group of two or more related persons living together in the same housing unit (a “household”). Thus, a family can consist of only one person, and more than one family can live in a household (including, for example, a household where there are multiple single-person families, as when unrelated roommates are living together).
In this report, families are identified as “wireless families” if anyone in the family had a working cellular telephone at the time of interview. This person (or persons) could be a civilian adult, a member of the military, or a child. Households are identified as “wireless-only” if they include at least one wireless family and if there are no working landline telephones inside the household. Persons are identified as wireless-only if they live in a wireless-only household. A similar approach is used to identify adults living in households with no telephone service (neither wireless nor landline). Household telephone status (rather than family telephone status) is used in this report because most telephone surveys draw samples of households rather than families.
From July through December 2008, information on household telephone status was obtained for 12,597 households that included at least one civilian adult or child. These households included 23,726 civilian adults aged 18 years and over and 8,635 children under age 18.
Analyses of demographic characteristics are based on data from the NHIS Person and Household files. Demographic data for all civilian adults living in interviewed households were used in these analyses. Estimates stratified by poverty status are based on reported income only. Household income was unknown for nearly 18% of adults.
Analyses of selected health measures are based on data from the NHIS Sample Adult file. Health-related data for one civilian adult randomly selected from each family were used in these analyses. From July through December 2008, data on household telephone status and selected health measures were collected from 9,841 randomly selected adults.
Because NHIS is conducted throughout the year and the sample is designed to yield a nationally representative sample each week, data can be analyzed quarterly. Weights are created for each calendar quarter of the NHIS sample. NHIS data weighting procedures are described in more detail in an NCHS published report (Series Report No. 2, Vol. 130 [PDF – 300 KB]). To provide access to the most recent information from NHIS, estimates using the July-December 2008 data are being released prior to final data editing and final weighting. These estimates should be considered preliminary and may differ slightly from estimates using the final data files.
Point estimates and 95% confidence intervals were calculated using SUDAAN software, to account for the complex sample design of NHIS. Differences between percentages were evaluated by using two-sided significance tests at the 0.05 level. Terms such as “more likely” and “less likely” indicate a statistically significant difference. Lack of comment regarding the difference between any two estimates does not necessarily mean that the difference was tested and found to be not significant. Because of small sample sizes, estimates based on less than 1 year of data may have large variances, and caution should be used in interpreting these estimates.
Questionnaire Changes in 2007
From 2003 to 2006, families were considered to have landline telephone service if the survey respondent provided a telephone number, identified it as “the family’s phone number,” and said that it was not a cellular telephone number. If the family’s phone number was reported to be a cellular telephone number, the respondent was asked if there was “at least one phone inside your home that is currently working and is not a cell phone.”
In 2007, the questionnaire was changed so that the survey respondent for each family was asked if there was “at least one phone inside your home that is currently working and is not a cell phone,” unless the respondent indicated not having any phone when asked for a telephone number.
From 2003 to 2006, the questions about cellular telephones were asked at the end of the survey. Because of incomplete interviews, more than 10% of households were not asked about wireless telephones. In 2007, the questions were asked earlier in the survey, resulting in fewer families with unknown wireless telephone status.
In 2007, a new question was added to the survey for persons living in families with both landline and cellular telephones. The respondent for the family was asked to consider all of the telephone calls that his or her family receives and to report whether “all or almost all calls are received on cell phones, some are received on cell phones and some on regular phones, or very few or none are received on cell phones.” This new question permits the identification of persons living in “wireless-mostly” households, defined as households with both landline and cellular telephones in which all families receive all or almost all calls on cell phones.
Finally, in 2007, the questionnaire was redesigned to improve the collection of income information. Initial evaluations suggest that the resulting poverty estimates are generally comparable with those from years 2006 and earlier. However, as a result of the changes, the poverty ratio variable has fewer missing values in 2007 and 2008 compared with prior years.
Telephone Status
In the last 6 months of 2008, more than one of every five households (20.2%) did not have a landline telephone but did have at least one wireless telephone (Table 1). Approximately 18.4% of all adults–more than 41 million adults–lived in households with only wireless telephones; 18.7% of all children–nearly 14 million children–lived in households with only wireless telephones.
The percentage of households that are wireless-only has been steadily increasing. In fact, the 2.7-percentage-point increase from the first 6 months of 2008 is the largest 6-month increase observed since NHIS began collecting data on wireless-only households in 2003.
The percentage of adults living in wireless-only households has also been increasing steadily (see Figure 1). During the last 6 months of 2008, more than one of every six adults lived in wireless-only households. One year before that (that is, during the last 6 months of 2007), one of every seven adults lived in wireless-only households. And 2 years before that (that is, during the last 6 months of 2005), only 1 of every 13 adults lived in wireless-only households.
The percentages of adults and children living without any telephone service have remained relatively unchanged over the past 3 years. Approximately 1.9% of households had no telephone service (neither wireless nor landline). Nearly 4 million adults (1.7%) and 2 million children (2.4%) lived in these households.
Demographic Differences
The percentage of U.S. civilian, noninstitutionalized adults living in wireless-only households is shown by selected demographic characteristics and by survey time period in Table 2. For the period July through December 2008,
- More than three in five adults living only with unrelated adult roommates (60.6%) were in households with only wireless telephones. This is the highest prevalence rate among the population subgroups examined.
- Nearly two in five adults renting their home (39.2%) had only wireless telephones. Adults renting their home were more likely than adults owning their home (9.9%) to be living in households with only wireless telephones.
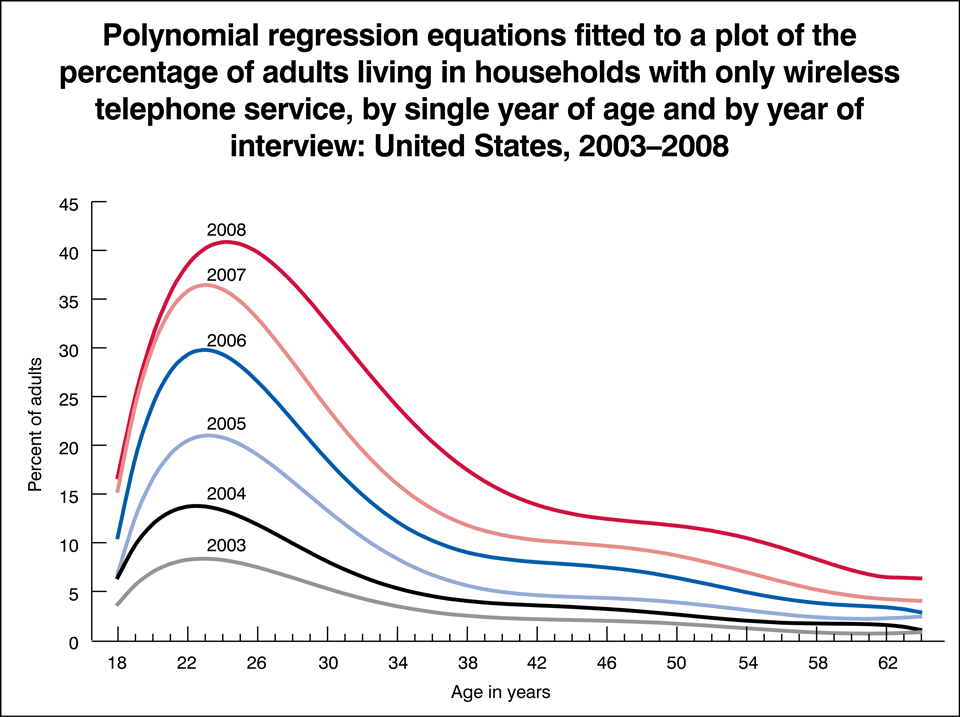
- More than two in five adults aged 25-29 years (41.5%) lived in households with only wireless telephones. Approximately one-third (33.1%) of adults aged 18-24 years lived in households with only wireless telephones.
- As age increased from 30 years, the percentage of adults living in households with only wireless telephones decreased: 21.6% for adults aged 30-44 years; 11.6% for adults aged 45-64 years; and 3.3% for adults aged 65 years and over. However, as shown in Table 2 and Figure 2, the percentage of wireless-only adults within each age group has increased over time.
- Men (20.0%) were more likely than women (17.0%) to be living in households with only wireless telephones.
- Adults living in poverty (30.9%) and adults living near poverty (23.8%) were more likely than higher income adults (16.0%) to be living in households with only wireless telephones.
- Adults living in the South (21.3%) and Midwest (20.8%) were more likely than adults living in the Northeast (11.4%) or West (17.2%) to be living in households with only wireless telephones.
- Non-Hispanic white adults (16.6%) were less likely than Hispanic adults (25.0%) or non-Hispanic black adults (21.4%) to be living in households with only wireless telephones.
Wireless-Mostly Households
Among households with both landline and cellular telephones, 24.4% received all or almost all calls on the cellular telephones, based on data for the period July through December 2008. These wireless-mostly households make up 14.5% of all households.
The percentage of adults living in wireless-mostly households has been increasing (see Table 3). During the last 6 months of 2008, approximately 35 million adults (15.4%) lived in wireless-mostly households. Although this prevalence estimate was not significantly different from the estimate for the first 6 months of 2008 (14.4%), it was significantly greater than the estimate for the first 6 months of 2007 (12.6%).
Table 3 presents the percentage of adults living in wireless-mostly households by selected demographic characteristics and by survey time period. For the period July through December 2008,
- Adults with college degrees (18.0%) were more likely to be living in wireless-mostly households than were high school graduates (13.2%) or adults with less education (9.8%).
- Adults living with children (19.2%) were more likely than adults living alone (12.2%) or with only adult relatives (13.2%) to be living in wireless-mostly households.
- Adults living in poverty (9.5%) and adults living near poverty (11.3%) were less likely than higher income adults (18.2%) to be living in wireless-mostly households.
- Adults living in metropolitan areas (15.8%) were more likely to be living in wireless-mostly households than were adults living in more rural areas (13.4%).
Selected Health Measures by Household Telephone Status
Most major survey research organizations, including NCHS, do not include wireless telephone numbers when conducting random-digit-dial telephone surveys. Therefore, the inability to reach households with only wireless telephones (or with no telephone service) has potential implications for results from health surveys, political polls, and other research conducted using random-digit-dial telephone surveys. Coverage bias may exist if there are differences between persons with and without landline telephones for the substantive variables of interest.
The NHIS Early Release Program updates and releases estimates for 15 key adult health indicators every 3 months. Table 4 presents estimates by household telephone status (landline, wireless-only, or without any telephone service) for all but two of these measures. (“Pneumococcal vaccination” and “personal care needs” were not included because these indicators are limited to adults aged 65 years and over.) For the period July through December 2008,
- The prevalence of binge drinking (i.e., having five or more alcoholic drinks in 1 day during the past year) among wireless-only adults (36.7%) was nearly twice as high as the prevalence among adults living in landline households (19.7%). Wireless-only adults were also more likely to be current smokers than were adults living in landline households.
- Compared with adults living in landline households, wireless-only adults were more likely to report that their health status was excellent or very good, were more likely to engage in regular leisure-time physical activity, and were less likely to have ever been diagnosed with diabetes.
- The percentage without health insurance coverage at the time of the interview among wireless-only nonelderly adults (27.5%) was considerably higher than the percentage among nonelderly adults living in landline households (16.4%).
- Compared with adults living in landline households, wireless-only adults were more likely to have experienced financial barriers to obtaining needed health care, and they were less likely to have a usual place to go for medical care. Wireless-only adults were also less likely to have received an influenza vaccination during the previous year.
- Wireless-only adults (47.0%) were more likely than adults living in landline households (37.1%) to have ever been tested for HIV, the virus that causes AIDS.
Conclusions
The potential for bias due to undercoverage remains a real and growing threat to surveys conducted only on landline telephones. For more information about the potential implications for health surveys that are based on landline telephone interviews, see
- Blumberg SJ, Luke JV. Coverage bias in traditional telephone surveys of low-income and young adults. Public Opin Q 71:734-49. 2007.
- Blumberg SJ, Luke JV, Cynamon ML. Telephone coverage and health survey estimates: Evaluating the need for concern about wireless substitution. Am J Public Health 96:926-31. 2006.
- Blumberg SJ, Luke JV, Cynamon ML, Frankel MR. Recent trends in household telephone coverage in the United States. In: Lepkowski JM et al., eds., Advances in telephone survey methodology. New York: John Wiley and Sons, 56-86. 2008.
The potential for bias may differ from one state to another because the prevalence of wireless-only households varies substantially across states. For more information about state-level prevalence estimates from the 2007 NHIS, see
- Blumberg SJ, Luke JV, Davidson G, Davern ME, Yu T, Soderberg K. Wireless substitution: State-level estimates from the National Health Interview Survey, January-December 2007. National health statistics report; no 14. Hyattsville, MD: National Center for Health Statistics. 2009.
For More Information
For more information about the National Health Interview Survey or the NHIS Early Release program, or to find other Early Release reports, please see the following websites:
- National Health Interview Survey homepage.
- National Health Interview Survey – Early Releases of Selected Estimates.
Suggested Citation
Blumberg SJ, Luke JV. Wireless substitution: Early release of estimates from the National Health Interview Survey, July-December 2008. National Center for Health Statistics. May 2009. Available from: /nchs/nhis.htm.
Figures
Figure 1
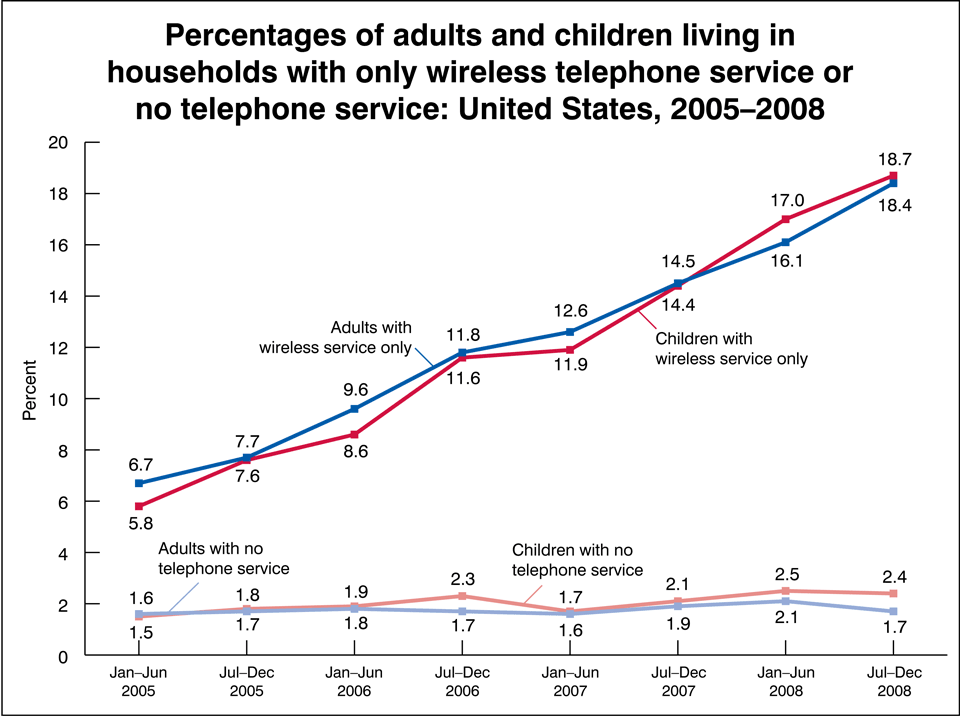
Figure 2
Tables
- Table 1. Percent distribution of household telephone status, by date of interview, for households, adults, and children: United States, January 2005-December 2008
- Table 2. Percentage of adults living in wireless-only households, by selected demographic characteristics and by calendar half-years: United States, January 2005-December 2008
- Table 3. Percentage of adults living in wireless-mostly households, by selected demographic characteristics and by calendar half-years: United States, January 2007-December 2008
- Table 4. Prevalence rates (and 95% confidence intervals) for selected measures of health-related behaviors, health status, health care service use, and health care access for adults 18 years of age and over, by household telephone status: United States, July-December 2008