Influenza Vaccination Coverage Among Pregnant Women — United States, 2014–15 Influenza Season
, MD1; , PhD2; , ScD3; , DrPH3; , MPH3; , MD2; , DVM2; , MD2; , MD, PhD2; , MPH4; , MPH2,5; , MD6; , PhD7; , MA8; , DrPH8; , EdD3; , DVM2
Pregnant women and infants are at increased risk for influenza-related complications and hospitalization. Influenza vaccination can reduce the risk for influenza-related illness among pregnant women and their infants (1). Since 2004, the Advisory Committee on Immunization Practices (ACIP) and the American College of Obstetricians and Gynecologists (ACOG) have recommended influenza vaccination for all women who are or will be pregnant during the influenza season, regardless of trimester of pregnancy (1,2). To assess influenza vaccination coverage among pregnant women during the 2014–15 influenza season, CDC analyzed data from an Internet panel survey conducted during March 31–April 6, 2015. Among 1,702 survey respondents who were pregnant at any time during October 2014–January 2015, 50.3% reported receiving influenza vaccination before or during pregnancy, similar to the reported coverage in the preceding season (3). Overall, 64.9% of respondents reported receiving a provider offer of influenza vaccination, 14.8% received a recommendation but no offer, and 20.3% received no recommendation. Vaccination coverage among these groups of women was 67.9%, 33.5%, and 8.5%, respectively. Reminder systems and standing orders that allow health care personnel other than the attending provider to assess vaccination status and administer vaccination, can help to ensure that influenza vaccination is recommended and offered to a pregnant woman at each provider visit to increase pregnant women's vaccination coverage (4,5).
Since the 2010–11 influenza season, CDC has conducted an Internet panel survey annually each April to provide end-of-season influenza vaccination coverage estimates among pregnant women. For the 2014–15 influenza season, the Internet panel survey was conducted during March 31–April 6, 2015 for CDC by Abt Associates, Inc., to 1) provide end-of-season estimates of influenza vaccination coverage among pregnant women; 2) assess respondent-reported provider recommendation for and offer of influenza vaccination; and 3) obtain updated information on pregnant women's knowledge, attitudes, and behaviors related to influenza vaccination. Women aged 18–49 years who reported being pregnant at any time since August 2014 were eligible to participate in the survey. Participants were recruited from a preexisting, national, opt-in, general population Internet panel operated by Survey Sampling International, which provides panel members with online survey opportunities in exchange for nominal incentives.* Pregnant women panelists were recruited through 1) an email invitation sent to female panel members aged 18–49 years living in the United States, and 2) a message on the panel website inviting panel members to answer a series of screening questions and, if eligible, to take the survey. Among 12,533 women who entered the survey site during March 31–April 6, 2015, 2,171 were determined to be eligible, and 2,053 completed the survey (completion rate† = 94.6%). Data were weighted to reflect the age, race/ethnicity, and geographic distribution of the total U.S. population of pregnant women. A woman was considered to be vaccinated if 1) vaccination was received during July 1, 2014–April 6, 2015 and 2) vaccination was received before or during the most recent pregnancy. The study population was limited to 1,702 women who reported being pregnant any time during the peak influenza vaccination period (October 2014–January 2015). Vaccination coverage estimates for the preceding five seasons were compared to assess trends over time. Similar survey methodology was used in all five seasons (3).
Survey respondents were asked about their vaccination status (before and/or during pregnancy), whether their provider recommended or offered influenza vaccination, their attitudes regarding influenza and influenza vaccination, and their reasons for receiving or not receiving influenza vaccination. Three composite variables defining attitudes about influenza vaccination efficacy, safety, and concerns about influenza infection were constructed using methods previously described (3). Because the opt-in Internet panel sample is not probability-based, no statistical tests were performed.§ Differences were noted when there was a ≥5 percentage-point difference between any values being compared.
Among the 1,702 women who were pregnant at any time during October 2014–January 2015, 50.3% reported receiving influenza vaccination before pregnancy (15.3%) or during pregnancy (35.0%) since July 1, 2014. The overall vaccination coverage was similar to that in the 2013–14 (52.2%) influenza season (Table 1). Non-Hispanic black women reported lower vaccination coverage (38.9%) than did non-Hispanic white women (51.9%). Compared with women in the reference category for each comparison stratum, lower influenza vaccination coverage was reported among women who were aged <35 years, had a college degree or less, were not married, had public insurance or no medical insurance, were not working for wages, were living below the poverty threshold, reported no high-risk conditions associated with increased influenza risk other than pregnancy, reported fewer than six visits to a health care provider since July 2014, and had a negative attitude toward efficacy or safety of influenza vaccination or were not concerned about influenza infection (Table 1).
Among women with at least one visit to a health care provider since July 2014, women who reported that a provider both recommended and offered influenza vaccination had higher vaccination coverage (67.9%) compared with women who reported receiving a provider recommendation but no offer (33.5%) and women who reported receiving no recommendation for vaccination (8.5%) (Figure). Compared with women in the reference category for each comparison stratum, a recommendation for and offer of influenza vaccination was less frequently reported by women who were aged <35 years, had less than a college degree, were unmarried, did not have medical insurance, were not working for wages, were living below the poverty threshold, did not have high-risk conditions, had fewer than 10 visits to a provider, and had a negative attitude toward influenza vaccination efficacy or safety or were not concerned about influenza infection (Table 2). Similarly, across all subgroups, influenza vaccination coverage was highest among women whose provider recommended and offered vaccination, followed by women who received only a recommendation but no offer, and lowest among women who received no provider recommendation. Even among women who reported negative attitudes regarding influenza vaccine efficacy or safety, or were not concerned about influenza infection, coverage was higher among those whose provider recommended and offered vaccination than among women with the same beliefs who reported only receiving a provider recommendation or receiving no recommendation (Table 2). Among vaccinated women, 86.8% reported that their provider recommended and offered vaccination; among unvaccinated women, the percentage was only 42.3%.
The most common reasons women reported for receiving influenza vaccination were "to protect my baby from flu" (33.1%), "to protect myself from flu" (21.4%), and "my doctor, nurse, or other medical professional recommended the flu vaccination" (15.0%). The most common reasons women reported for not receiving vaccination were "I don't think the vaccination is effective in preventing flu" (17.2%), "I have concerns about possible safety risk to my baby if I got vaccinated" (14.5%) and "I am concerned that the vaccination would give me the flu" (13.6%).
Discussion
During the 2014–15 influenza season approximately half of surveyed pregnant women had received influenza vaccination, similar to the percentages found for the 2013–14 (52.2%), 2012–13 (50.5%), and 2011–12 (46.4%) influenza seasons, but higher than those found for the 2010–11 season (44.0%) (3). A substantially higher percentage of women who reported that their provider both recommended and offered influenza vaccination had received influenza vaccine compared with women who reported receiving only a recommendation but no offer or no recommendation; however, the percentage of women receiving a provider offer and recommendation was similar to last season.
The higher coverage reported among pregnant women whose provider recommended and offered influenza vaccination, including women with negative attitudes about influenza vaccine efficacy or safety, or who were not concerned about getting influenza, highlights the importance of a provider recommendation for influenza vaccination coupled with an offer of influenza vaccination onsite to increase vaccination coverage among pregnant women. Implementing and strengthening systems that support provider ability to recommend and offer influenza vaccination to pregnant women, including standing orders and provider reminder systems, as well as expanded access to vaccination services in expanded health care settings, such as pharmacies, can increase opportunities for vaccination and improve coverage (4,5).
Similar to previous seasons, vaccination coverage was lower among black women than white women, despite a similar percentage of black and white women reporting receiving a provider recommendation and offer of vaccination, highlighting the need to identify and address possible factors contributing to this disparity, which might include weaker or less effective provider recommendations, differences in sociocultural norms, misperception of vaccine effectiveness and safety, vaccination resistance and hesitancy, and poorer quality of provider-patient relationships (6,7).
Unlike the previous influenza seasons, during the 2014–15 season the most commonly reported reason for not being vaccinated concerned lack of confidence in influenza vaccine efficacy, which might have reflected knowledge about the mismatch of the influenza vaccine with the circulating strain in the 2014–15 season (3,8). In addition to addressing this concern, clinic-based client education for pregnant women should emphasize that influenza vaccination during pregnancy is safe and can protect not only pregnant women themselves but also their infants during the first 6 months of life when they are too young to receive vaccination (1,2,4). This education needs to be supported by provider recommendation for and offer of influenza vaccination during the visit (4). Education messages can be delivered through multiple channels, including prenatal care consultation, social media, and text messaging (e.g., applications such as https://text4baby.org).
The findings in this report are subject to at least four limitations. First, vaccination was self-reported and not validated by medical records; therefore, coverage might be over- or underestimated. Second, the study sample did not include women without Internet access. Therefore, results are not generalizable to all pregnant women in the United States. Third, the Internet panel survey is an opt-in survey and estimates might be biased if a woman's decision to participate in this particular survey were related to receipt of vaccination. Fourth, the composite variables computed for attitudes toward influenza vaccination and infection were not validated. Despite these limitations, the opt-in Internet panel survey can provide timely estimates of influenza vaccination coverage and in-depth information about knowledge, attitudes, behaviors, and barriers related to influenza vaccination among pregnant women. Trends in vaccination coverage reported from the Internet panel surveys have been consistent with those reported from less timely probability sampling surveys (9).
The data from the current analysis demonstrate that to improve vaccination coverage, pregnant women receiving a provider recommendation for and offer of influenza vaccination is important, as is clinic-based education about the safety and efficacy of vaccination toward pregnant women. Missed opportunities for vaccination can be reduced by implementing standing orders that enable appropriately trained health personnel to administer vaccinations without the need for examination or a direct order from the provider at the time of the interaction, and provider reminders to ensure influenza vaccination is recommended and offered at each visit before and during pregnancy. Providing referrals in situations where a provider is unable to offer vaccination could help pregnant women receive influenza vaccination. Many unvaccinated women in this survey reported receiving a provider recommendation or offer to be vaccinated yet reported being unvaccinated, emphasizing the need for clinic-based education to address concerns about vaccination during pregnancy. Resources are available from CDC (http://www.cdc.gov/flu/protect/vaccine/pregnant.htm) to help providers communicate the risk for influenza and benefits of vaccination for pregnant women.
1Eagle Medical Services, LLC, San Antonio, Texas; 2Immunization Services Division, National Center for Immunization and Respiratory Diseases, CDC; 3Abt Associates, Inc., Cambridge, Massachusetts; 4Leidos, Atlanta, Georgia; 5Oak Ridge Institute for Science and Education (ORISE) fellow, CDC; 6Influenza Division, National Center for Immunization and Respiratory Diseases, CDC; 7Division of Reproductive Health, National Center for Chronic Disease Prevention and Health Promotion, CDC; 8Abt SRBI, New York, New York.
Corresponding author: Helen Ding, hding@cdc.gov, 404-639-8513.
References
- CDC. Prevention and control of influenza with vaccines: recommendations of the Advisory Committee on Immunization Practices (ACIP), United States, 2013–14. MMWR Recomm Rep 2013;62(No. RR-07):1–43.
- American Congress of Obstetricians and Gynecologists Committee on Obstetric Practice and Immunization Expert Work Group. ACOG committee opinion no. 468: influenza vaccination during pregnancy. Obstet Gynecol 2014;124:648–51.
- Ding H, Black CL, Ball S, et al. Influenza vaccination coverage among pregnant women—United States, 2013–14 influenza season. MMWR Morb Mortal Wkly Rep 2014;63:816–21.
- The Community Preventive Services Task Force. Increasing appropriate vaccination: health care system-based interventions implemented in combination. Washington, DC: US Department of Health and Human Services, the Community Preventive Services Task Force; 2015. Available at http://www.thecommunityguide.org/vaccines/healthsysteminterventions.html.
- American College of Obstetricians and Gynecologists. ACOG committee opinion no. 558: Integrating immunizations into practice. Obstet Gynecol 2013;121:897–903.
- Lindley MC, Wortley PM, Winston CA, Bardenheier BH. The role of attitudes in understanding disparities in adult influenza vaccination. Am J Prev Med 2006;31:281–5.
- Fiscella K. Commentary—anatomy of racial disparity in influenza vaccination. Health Serv Res 2005;40:539–49.
- Flannery B, Clippard J, Zimmerman RK, et al. Early estimates of seasonal influenza vaccine effectiveness—United States, January 2015. MMWR Morb Mortal Wkly Rep 2015;64:10–5.
- Lu P-J, Santibanez TA, Williams WW, et al. Surveillance of influenza vaccination coverage—United States, 2007–2008 through 2011–12 influenza seasons. MMWR Surveill Summ 2013;62(No. SS-04):1–28.
* Additional information on the online survey and incentives for participants is available at https://www.surveysampling.com.
† An opt-in Internet panel survey is a nonprobability sampling survey. The denominator for a response rate calculation cannot be determined because no sampling frame with a selection probability is involved at the recruitment stage. Instead, the survey completion rate is provided. Completion rate is the percentage of women who completed the survey, among those that were eligible and started the survey.
§ Additional information on obstacles to inference in non-probability samples is available at http://www.aapor.org/AAPORKentico/default.aspx.
Summary
What is already known on this topic?
Pregnant women and infants are at increased risk for influenza-related complications. The risk of influenza among pregnant women and their infants aged <6 months can be reduced by vaccinating pregnant women. Influenza vaccination coverage among pregnant women increased substantially during the 2009–10 influenza season and the increased coverage was sustained during the 2010–11 through 2013–14 seasons.
What is added by this report?
During the 2014–15 influenza season, 50.3% of pregnant women were vaccinated before or during pregnancy, similar to the 2013–14 season. Women who received a provider offer of vaccination had substantially higher vaccination coverage than those who did not receive an offer of vaccination. Barriers to vaccination included negative attitudes about safety and efficacy of influenza vaccination and unfounded concern that vaccination would cause influenza.
What are the implications for public health practice?
To protect mothers and their babies from complications of influenza, efforts are needed to improve influenza vaccination coverage among pregnant women. Interventions should include implementing clinic-based education to ensure access to information about influenza vaccine safety and efficacy and the risk for influenza for pregnant women and their infants, and systems to ensure that providers recommend and offer influenza vaccination to all pregnant women.
FIGURE. Percentage of women vaccinated for influenza before and during pregnancy, overall and by health care provider recommendation and offer* of influenza vaccination, among women pregnant at any time during October 2014–January 2015 — Internet panel survey, United States, 2014–15 influenza season
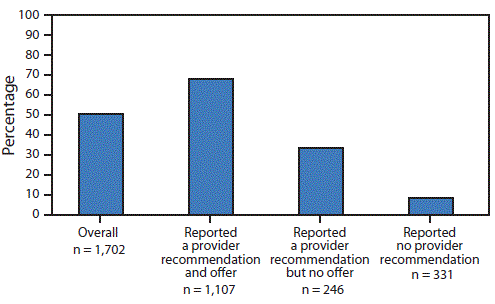
* Excluded women who had not visited a health care provider since July 2014 (n = 18).
Alternate Text: The figure above is a bar chart showing the percentage of women vaccinated for influenza before and during pregnancy, overall and by health care provider recommendation and offer of influenza vaccination, among women pregnant at any time during October 2014–January 2015 in the United States during the 2014–15 influenza season.
|
TABLE 1. (Continued) Influenza vaccination coverage before and during pregnancy among women who were pregnant any time during October 2014–January 2015, by selected characteristics — Internet panel surveys, United States, 2014–15 and 2013–2014 influenza seasons |
|||||||
|---|---|---|---|---|---|---|---|
|
Characteristic |
2013–14 influenza season |
2014–15 influenza season |
Percentage point difference in vaccination coverage (2014–15 - 2013–14) |
||||
|
Unweighted no. |
Weighted % |
Vaccinated, weighted % |
Unweighted no. |
Weighted % |
Vaccinated, weighted % |
||
|
Provider recommendation and/or offer of influenza vaccination¶¶ |
|||||||
|
Recommended, offered |
1,037 |
65.1 |
70.5* |
1,107 |
64.9 |
67.9* |
-2.6 |
|
Recommended, no offer |
242 |
15.1 |
32.0* |
246 |
14.8 |
33.5* |
1.5 |
|
No recommendation§ |
324 |
19.8 |
9.7 |
331 |
20.3 |
8.5 |
-1.2 |
|
Attitude toward efficacy of influenza vaccination*** |
|||||||
|
Positive§ |
1,316 |
81.3 |
62.9 |
1,302 |
75.8 |
62.4 |
-0.5 |
|
Negative |
303 |
18.7 |
5.8* |
400 |
24.2 |
12.2* |
6.4† |
|
Attitude toward safety of influenza vaccination††† |
|||||||
|
Positive§ |
1,241 |
75.2 |
65.1 |
1,278 |
74.0 |
63.5 |
-1.7 |
|
Negative |
378 |
24.8 |
13.2* |
424 |
26.0 |
12.6* |
-0.6 |
|
Attitude toward influenza infection§§§ |
|||||||
|
Concerned§ |
1,127 |
69.8 |
58.0 |
1,145 |
67.3 |
56.0 |
-2.0 |
|
Not concerned |
492 |
30.2 |
39.0* |
557 |
32.7 |
38.4* |
-0.6 |
|
* ≥5 percentage point difference compared with reference group. † ≥5 percentage point difference from 2013–14 to 2014–15 influenza season. § Reference group for comparisons within subgroups. ¶ Working status: Yes = those employed for wages and self-employed; No = those out of work, homemakers, students, retired, or unable to work. ** As determined by the U.S. Census Bureau (http://www.census.gov/hhes/www/poverty/data/threshld), for the 2014–15 season below poverty = total family income of <$24,008 for a family of four with two minors as of 2014; for the 2013–14 season below poverty = total annual family income of <$23,624 for a family of four with two minors as of 2013. †† Conditions associated with increased risk for serious medical complications from influenza, including chronic asthma, a lung condition other than asthma, a heart condition, diabetes, a kidney condition, a liver condition, obesity, or a weakened immune system caused by a chronic illness or by medicines taken for a chronic illness. §§ Vaccination coverage estimate was not reliable because sample size was <30. ¶¶ Excluding women who had not visited a health care provider since July 2013 (n = 16) for the 2013–14 influenza season, and who had not visited a health care provider since July 2014 (n = 18) for the 2014–15 influenza season. *** Created based on two questions regarding attitudes toward the efficacy of flu vaccination: 1) "Flu vaccine is somewhat/very effective in preventing flu," and 2) "Flu vaccine a pregnant women received is somewhat/very effective in protecting her baby from the flu." A 1-point score was given for each "yes" answer for either of the two questions. "Positive" attitude = summary score of 1 or 2; "Negative" attitude = summary score of 0. ††† Created based on three questions regarding attitudes toward the safety of flu vaccination: 1)"Flu vaccination is somewhat/very/completely safe for most adult women"; 2) "Flu vaccination is somewhat/very/completely safe for pregnant women"; and 3) "Flu vaccination that a pregnant woman receives is somewhat/very/completely safe for her baby." 1 point was given for each "yes" answer for any of the 3 questions. "Positive" attitude = summary score of 2 or 3; "Negative" attitude = summary score of 0 or 1. §§§ Created based on three questions regarding attitude toward flu infection: 1) "If a pregnant woman gets the flu, it is somewhat/very likely to harm the baby"; 2) "Flu infection during pregnancy somewhat/very likely harms pregnant women"; and 3) "somewhat/very worried about getting sick with the flu this season ." 1 point was given for each "yes" answer for any of the 3 questions. "Concerned" = summary score of 2 or 3; "Not concerned" = summary score of 1 or 0. |
|||||||
|
TABLE 2. (Continued) Percentage of women receiving a provider recommendation/offer of influenza vaccination and influenza vaccination coverage, by provider recommendation and offer of influenza vaccination, among women who visited a provider at least one time since July 2014 and who were pregnant any time during October 2014–January 2015 — Internet panel survey, United States, 2014–15 influenza season |
||||||||||
|---|---|---|---|---|---|---|---|---|---|---|
|
Characteristic |
Unweighted no. |
Provider recommendation/offer of influenza vaccination |
Vaccination coverage |
|||||||
|
Recommended, offered, weighted |
Recommended, no offer, weighted |
No recommendation, weighted % |
Provider recommended, offered |
Provider recommended, no offer |
No recommendation |
|||||
|
Unweighted no. |
Weighted % |
Unweighted no. |
Weighted % |
Unweighted no. |
Weighted % |
|||||
|
No. of visits to a provider since July |
||||||||||
|
1–5 |
399 |
48.1* |
16.0 |
35.9* |
194 |
61.1* |
62 |
32.5 |
143 |
7.6 |
|
6–10 visits |
657 |
66.1* |
15.1 |
18.9* |
446 |
72.5* |
96 |
35.8 |
115 |
9.4 |
|
>10 visits† |
628 |
74.4 |
13.8 |
11.8 |
467 |
66.4 |
88 |
31.7 |
73 |
8.6 |
|
Attitude toward efficacy of influenza vaccination§§ |
||||||||||
|
Positive† |
1,293 |
69.8 |
13.3 |
16.9 |
913 |
78.2 |
170 |
45.6 |
210 |
12.1 |
|
Negative |
391 |
49.2* |
19.7* |
31.1* |
194 |
21.0* |
76 |
7.5* |
121 |
2.2* |
|
Attitude toward safety of influenza vaccination¶¶ |
||||||||||
|
Positive† |
1,268 |
71.1 |
13.6 |
15.4 |
907 |
78.2 |
170 |
43.4 |
210 |
14.1 |
|
Negative |
416 |
47.2* |
18.4 |
34.4* |
200 |
21.0* |
76 |
12.6* |
121 |
1.2* |
|
Attitude toward influenza infection*** |
||||||||||
|
Concerned† |
1,134 |
68.4 |
14.2 |
17.4 |
907 |
71.7 |
157 |
39.7 |
190 |
10.1 |
|
Not concerned |
550 |
57.8* |
16.0 |
26.3* |
200 |
58.4* |
89 |
22.1* |
141 |
6.2 |
|
* ≥5 percentage point difference compared with reference group. † Reference group for comparisons within subgroups. § Vaccination coverage estimate was not reliable because sample size was <30. ¶ Working status, Yes = those employed for wages and self-employed; No = those out of work, homemakers, students, retired, or unable to work. ** Below poverty = a total family income of <$24,008 for a family of four with two minors as of 2014, as categorized by the U.S. Census Bureau (https://www.census.gov/hhes/www/poverty/data/threshld/). †† Conditions associated with increased risk for serious medical complication from influenza, including chronic asthma, a lung condition other than asthma, a heart condition, diabetes, a kidney condition, a liver condition, obesity, or a weakened immune system caused by a chronic illness or by medicines taken for a chronic illness. §§ Created based on two questions regarding attitudes toward the efficacy of flu vaccination: 1) "Flu vaccine is somewhat/very effective in preventing flu," and 2) "Flu vaccine a pregnant women received is somewhat/very effective in protecting her baby from the flu." A 1-point score was given for each "yes" answer for either of the two questions. "Positive" attitude = summary score of 1 or 2; "Negative" attitude = summary score of 0. ¶¶ Created based on three questions regarding attitudes toward the safety of flu vaccination: 1)"Flu vaccination is somewhat/very/completely safe for most adult women"; 2) "Flu vaccination is somewhat/very/completely safe for pregnant women"; and 3) "Flu vaccination that a pregnant woman receives is somewhat/very/completely safe for her baby." A 1-point score was given for each "yes" answer for any of the 3 questions. "Positive" attitude = summary score of 2 or 3; "Negative" attitude = summary score of 0 or 1. *** Created based on three questions regarding attitude toward flu infection: 1) "If a pregnant woman gets the flu, it is somewhat/very likely to harm the baby"; 2) "Flu infection during pregnancy somewhat/very likely harms pregnant women"; and 3) "somewhat/very worried about getting sick with the flu this season." A 1-point score was given for each "yes" answer for any of the 3 questions. "Concerned" = summary score of 2 or 3; "Not concerned" = summary score of 1 or 0. |
||||||||||
Use of trade names and commercial sources is for identification only and does not imply endorsement by the U.S. Department of
Health and Human Services.
References to non-CDC sites on the Internet are
provided as a service to MMWR readers and do not constitute or imply
endorsement of these organizations or their programs by CDC or the U.S.
Department of Health and Human Services. CDC is not responsible for the content
of pages found at these sites. URL addresses listed in MMWR were current as of
the date of publication.
All MMWR HTML versions of articles are electronic conversions from typeset documents.
This conversion might result in character translation or format errors in the HTML version.
Users are referred to the electronic PDF version (http://www.cdc.gov/mmwr)
and/or the original MMWR paper copy for printable versions of official text, figures, and tables.
An original paper copy of this issue can be obtained from the Superintendent of Documents, U.S.
Government Printing Office (GPO), Washington, DC 20402-9371;
telephone: (202) 512-1800. Contact GPO for current prices.
**Questions or messages regarding errors in formatting should be addressed to
mmwrq@cdc.gov.
