Influenza Vaccination Coverage Among Health Care Personnel — United States, 2014–15 Influenza Season
, PhD1; , MPS, MS1; , ScD2; , DrPH2; , MS2; , MD3; , PhD4; , MD1; , MPH1; , MD1; , MD, PhD1; , MD1; , DrPH5; , MA5; , EdD2; , DVM1
The Advisory Committee on Immunization Practices recommends annual influenza vaccination for all health care personnel (HCP) to reduce influenza-related morbidity and mortality among both HCP and their patients and to decrease absenteeism among HCP (1–5). To estimate influenza vaccination coverage among U.S. HCP for the 2014–15 influenza season, CDC conducted an opt-in Internet panel survey of 1,914 HCP during March 31–April 15, 2015. Overall, 77.3% of HCP survey participants reported receiving an influenza vaccination during the 2014–15 season, similar to the 75.2% coverage among HCP reported for the 2013–14 season (6). Vaccination coverage was highest among HCP working in hospitals (90.4%) and lowest among HCP working in long-term care (LTC) settings (63.9%). By occupation, coverage was highest among pharmacists (95.3%) and lowest among assistants and aides (64.4%). Influenza vaccination coverage was highest among HCP who were required by their employer to be vaccinated (96.0%). Among HCP without an employer requirement for vaccination, coverage was higher for HCP working in settings where vaccination was offered on-site at no cost for 1 day (73.6%) or multiple days (83.9%) and lowest among HCP working in settings where vaccine was neither required, promoted, nor offered on-site (44.0%). Comprehensive vaccination strategies that include making vaccine available at no cost at the workplace along with active promotion of vaccination might help increase vaccination coverage among HCP and reduce the risk for influenza to HCP and their patients (1,6,7).
The opt-in Internet panel survey was conducted for CDC by Abt Associates, Inc. (Cambridge, Massachusetts) during March 31–April 15, 2015, to provide estimates of influenza vaccination coverage among HCP during the 2014–15 influenza season. Two preexisting national opt-in Internet sources were used to recruit HCP for the survey. Professional clinical HCP (physicians, nurse practitioners, physician assistants, nurses, dentists, pharmacists, allied health professionals, technicians, and technologists) were recruited from the current membership roster of Medscape, a medical website managed by WebMD Health Professional Network.* Medscape's terms of service explicitly permit WebMD Professional Network to contact members about programming, including survey research; members receive an honorarium for completing surveys. HCP in other occupations (e.g., assistants, aides, and nonclinical personnel such as administrators, clerical support workers, janitors, food service workers, and housekeepers) who met eligibility criteria were recruited for a health survey from general population Internet panels operated by Survey Sampling International (SSI) that provide panel members with online survey opportunities in exchange for nominal incentives.† HCP were recruited through e-mails and messages on the list or panel websites and were eligible for the survey if they reported working in at least one of eight health care settings or reported any patient contact.
Survey elements included demographic characteristics, occupation, work setting, self-reported influenza vaccination, and employer vaccination policies (i.e., vaccination requirements, vaccination availability at the workplace, and promotion of vaccination including recognition, rewards, reminders, compensation, and free or subsidized vaccination). Survey responses were used to categorize HCP into seven occupation and four work setting groups for this analysis. The occupation types were 1) physicians, 2) nurse practitioners/physician assistants, 3) nurses, 4) pharmacists, 5) assistants/aides, 6) other clinical HCP,§ and 7) nonclinical HCP. The work settings were: 1) hospitals, 2) ambulatory care/physician offices, 3) LTC settings, and 4) other clinical settings.¶ Respondents could specify working in more than one work setting. Responses were weighted to the distribution of the U.S. population of HCP by occupation, age, sex, race/ethnicity, work setting, and census region.** Vaccination coverage estimates from opt-in Internet panel surveys conducted during the 2010–11 through 2014–15 influenza seasons were compared with assess trends over time. Similar methodology was used for all five influenza seasons, although Internet panels used to recruit both clinical and nonclinical HCP in 2010–11 differed from those used in subsequent years (6). Because the study sample was based on HCP from opt-in Internet panels rather than probability samples, no statistical tests were performed.†† A change was noted as an increase or decrease when there was at least a 5 percentage point difference between estimates; estimates with smaller differences were considered similar.
Among the 2,012 HCP who started the survey from either source (Medscape or SSI) and had eligible responses to the screening questions, 1,957 (97.3%) completed the survey.§§ Forty-three respondents with completed surveys who reported working in "other health care settings" were excluded because examination of other survey responses indicated that they were either unlikely to have contact with patients or that their work setting was not one of the health care settings of interest for this analysis, leaving a final analytic sample of 1,914 HCP. Overall, 77.3% of HCP reported receiving an influenza vaccination during the 2014–15 season, an increase of 13.8 percentage points compared with the 2010–11 season estimate, but similar to the 75.2% coverage estimate reported in 2013–14 (Figure, Table 1).
With the exception of LTC settings, coverage had increased in all work settings since the 2010–11 season (Figure); however, for all work settings, coverage in the 2014–15 season was similar to coverage in the 2013–14 season (Figure, Table 1). Compared with the 2013–14 season (Table 1), coverage was higher in 2014–15 among pharmacists (95.3% versus 85.7%), assistants/aides (64.4% versus 57.7%), and nonclinical personnel (75.2% versus 68.6%). Coverage among other clinical personnel decreased from 87.4% in 2013–14 to 81.3% in 2014–15. Coverage for other occupation types was similar in both seasons.
HCP working in settings with employer vaccination requirements had the highest influenza vaccination coverage (Table 2). During the 2014–15 season, vaccination coverage was 96.0% among HCP working in settings where vaccination was required. Overall, 40.1% of surveyed HCP were required to be vaccinated against influenza, an increase from 20.9% in the 2011–12 season. HCP working in hospitals were most likely to be required to be vaccinated (64.8%), with vaccination coverage of 97.2%, and HCP working in LTC settings were least likely to be required to be vaccinated (26.0%), with vaccination coverage of 97.3%. The lowest vaccination coverage in worksites with employer requirements was 85.7% among HCP in other clinical settings. Among HCP without an employer requirement for vaccination, vaccination coverage among HCP who worked in locations where their employer made vaccination available on-site at no cost for >1 day was 83.9%, compared with coverage of 73.6% among HCP who worked in locations where their employer made vaccination available at no cost for 1 day only and 59.5% among HCP who worked in locations where their employer did not provide influenza vaccination on-site at no cost but actively promoted vaccination through other mechanisms.¶¶
Vaccination coverage was lowest (44.0%) among HCP working in locations where employers neither required vaccination, provided vaccination on-site, nor promoted vaccination. HCP working in LTC settings were most likely to report that their employer neither required, provided, nor promoted vaccination (30.0%), compared with HCP working in other health care settings. In contrast, only 2.6% of HCP working in hospitals reported that their employer neither required, provided, nor promoted vaccination (Table 2).
Discussion
The overall HCP influenza vaccination coverage estimate for the 2014–15 season was 77.3%, similar to the previous influenza season but higher than the 2010–11 through 2012–13 seasons (6). As in previous influenza seasons, higher vaccination coverage among HCP was associated with employer vaccination requirements or access to vaccination at the workplace at no cost for more than 1 day (6). Access to influenza vaccination at the worksite has been associated with higher vaccination coverage among HCP in previous studies (6,8). These findings support recommendations for a comprehensive strategy that includes easy access to vaccination at no cost on multiple days, along with promotion of vaccination, to increase HCP influenza vaccination coverage (1,7).
Coverage among HCP working in LTC settings was the lowest among the work settings examined, a finding that was consistent with the previous three seasons (6). Influenza vaccination among HCP in LTC settings is important because influenza vaccine effectiveness is generally lowest in the elderly, making vaccination of close contacts even more critical (3). In addition, multiple studies have demonstrated that vaccination of HCP in LTC settings confers a health benefit to patients, including reduced risk for mortality (2–4). HCP working in LTC settings were least likely to report that their employer required vaccination or made vaccination available on-site at no cost for multiple days. Implementing strategies shown to improve HCP workplace vaccination coverage, including vaccination requirements or offering at no cost on-site vaccinations over multiple days, can help protect LTC patients from influenza (7).
HCP working in hospitals had the highest vaccination coverage and were the most likely to report that their employer required vaccination. Higher vaccination coverage and increased use of vaccination requirements and promotion in hospitals compared with other settings might be partly attributable to the Centers for Medicare and Medicaid Services (CMS) requirement in place since January 2013 to report HCP influenza vaccination levels as part of its hospital quality reporting programs (9). CMS has since added HCP influenza vaccination to quality reporting programs for other HCP work settings, which might affect vaccination coverage in nonhospital settings in future years; however, not all work settings are included in the program.
The findings in this report are subject to at least three limitations, all of which have been described previously (6). First, the sample was not randomly selected from HCP in the United States. The survey used a nonprobability sample of volunteer HCP members of Medscape and SSI Internet panels and the results based on this nonprobability sample might not be representative of the HCP population in the United States, in particular, those without internet access. Second, influenza vaccination coverage among HCP from the opt-in Internet panel survey (72.0%) differed from the population-based sample in the National Health Interview Survey in the 2009–10 through 2012–13 influenza seasons (66.9% for the 2012–13 season), although trends in coverage were similar across seasons (10) (CDC, unpublished data, 2015). Finally, all results were based on self-report and might be subject to recall bias.
The highest HCP vaccination coverage was reported in worksites with employer requirements for vaccination. In the absence of vaccination requirements, expanding the number of health care locations offering vaccination on-site, over multiple days, and at no cost might help sustain and improve influenza vaccination coverage among HCP. Employers and health care administrators can make use of the Guide to Community Preventive Services, which has found evidence to support on-site vaccination at no or low cost to HCP to increase influenza vaccination coverage among HCP (7). LTC employers can also use the LTC web-based toolkit*** developed by CDC and the National Vaccine Program Office, which provides access to resources, strategies, and educational materials for increasing influenza vaccination among HCP in LTC settings.
1Immunization Services Division, National Center for Immunization and Respiratory Diseases, CDC; 2Abt Associates Inc., Cambridge, MA; 3Division of Surveillance, Hazard Evaluations, and Field Studies, National Institute for Occupational Safety and Health, CDC; 4Division of Respiratory Disease Studies, National Institute for Occupational Safety and Health, CDC; 5Abt SRBI, New York, NY.
(Corresponding author: Carla L. Black, cblack2@cdc.gov, 404-639-8436).
References
- CDC. Immunization of health-care personnel: recommendations of the Advisory Committee on Immunization Practices (ACIP). MMWR Recomm Rep 2011;60(No. RR-7).
- Carman WF, Elder AG, Wallace LA, et al. Effects of influenza vaccination of health-care workers on mortality of elderly people in long-term care: a randomised controlled trial. Lancet 2000;355:93–7.
- Hayward AC, Harling R, Wetten S, et al. Effectiveness of an influenza vaccine programme for care home staff to prevent death, morbidity, and health service use among residents: cluster randomised controlled trial. BMJ 2006;333:1241.
- Lemaitre M, Meret T, Rothan-Tondeur M, et al. Effect of influenza vaccination of nursing home staff on mortality of residents: a cluster-randomized trial. J Am Geriatr Soc 2009;57:1580–6.
- Saxén H, Virtanen M. Randomized, placebo-controlled double blind study on the efficacy of influenza immunization on absenteeism of health care workers. Pediatr Infect Dis J 1999;18:779–83.
- Black CL, Yue X, Ball SW, et al. Influenza vaccination coverage among health care personnel—United States, 2013–14 influenza season. MMWR Morb Mortal Wkly Rep 2014;63:805–11.
- Community Preventive Services Task Force. Interventions to promote seasonal influenza vaccinations among healthcare workers. Atlanta, GA: The Guide to Community Preventive Services; 2008. Available at http://www.thecommunityguide.org/worksite/flu-hcw.html.
- Hollmeyer H, Hayden F, Mounts A, Buchholz U. Review: interventions to increase influenza vaccination among healthcare workers in hospitals. Influenza Other Respir Viruses 2013;7:604–21.
- Lindley MC, Bridges CB, Strikas RA, et al. Influenza vaccination performance measurement among acute care hospital-based health care personnel—United States, 2013–14 influenza season. MMWR Morb Mortal Wkly Rep 2014;63:812–5.
- CDC. Surveillance of influenza vaccination coverage—United States, 2007–08 through 2011–12 influenza seasons. MMWR Surveill Summ 2013;62(No. SS-04).
* Additional information on Medscape is available at http://www.medscape.com.
† Additional information on Survey Sampling International and its incentives for online survey participants is available at https://www.surveysampling.com.
§ Other clinical HCP included allied health professionals, technicians, and technologists.
¶ Ambulatory care/physician's office included physicians' offices, medical clinics, and other nonhospital outpatient or ambulatory care settings. LTC settings included nursing homes, home health agencies, home health care settings, assisted living facilities, or other LTC settings. Other clinical settings included dental offices or clinics, pharmacies, laboratories, public health settings, health care education settings, emergency medical services settings, or other settings where clinical care or related services were provided to patients.
** Population control totals of U.S. HCP by occupation and work setting were obtained from the Bureau of Labor Statistics, U.S. Department of Labor, Occupational Employment Statistics, May 2013 National Industry-specific Occupational Employment and Wage Estimates (available at http://www.bls.gov/oes/current/oessrci.htm). Population control totals by other demographic characteristics were obtained from the U.S. Census Bureau, Current Population Survey Monthly Labor Force Data, September 2014 (available at http://www.census.gov/cps/data).
†† Additional information on obstacles to inference in non-probability samples is available at http://www.aapor.org/AAPORKentico/AAPOR_Main/media/MainSiteFiles/NPS_TF_Report_Final_7_revised_FNL_6_22_13.pdf.
§§ A survey response rate requires specification of the denominator at each stage of sampling. During recruitment of an online opt-in survey sample, such as the Internet panels described in this report, these numbers are not available; therefore, a response rate cannot be calculated. Instead, the survey cooperation rate is provided.
¶¶ Influenza vaccination was promoted among employees through public identification of vaccinated persons, financial incentives, or rewards to individuals or groups of employees, competition between units or care areas, free or subsidized cost of vaccination, personal reminders to be vaccinated, or publicizing of the number or percentage of employees receiving vaccination.
*** The long-term care web-based toolkit is available at http://www.cdc.gov/flu/toolkit/long-term-care/index.htm.
Summary
What is already known on this topic?
The Advisory Committee on Immunization Practices recommends annual influenza vaccination for all health care personnel (HCP) to reduce influenza-related morbidity and mortality in health care settings. Estimated overall HCP vaccination coverage was 75.2% for the 2013–14 season.
What is added by this report?
Influenza vaccination coverage among HCP during the 2014–15 influenza season, assessed using an opt-in Internet panel survey, was 77.3%, similar to coverage during the 2013–14 season. Vaccination coverage was highest among physicians, pharmacists, nurse practitioners and physician assistants, nurses, and HCP working in hospital settings. Coverage was lowest among assistants/aides and HCP working in long-term care settings. Offering vaccination at the workplace at no cost was associated with higher vaccination coverage.
What are the implications for public health practice?
Worksites using vaccination requirements or, in the absence of requirements, offering at no cost influenza vaccination on-site over multiple days can achieve high HCP vaccination coverage. Including such measures in comprehensive worksite intervention strategies will be important to ensure HCP and patients are protected against influenza.
FIGURE. Percentage of health care personnel* (HCP) who reported receiving influenza vaccination, by work setting and occupation type — Internet panel surveys, United States, 2010–11 through 2014–15 influenza seasons
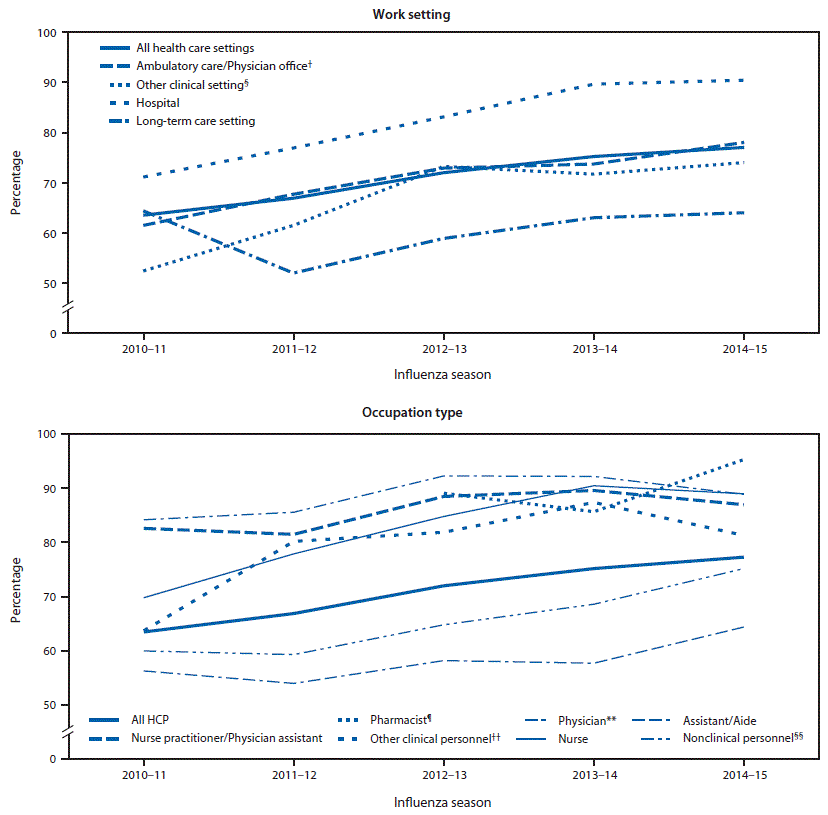
* Persons who worked in a place where clinical care or related services were provided to patients, or whose work involved face-to-face contact with patients or who were ever in the same room as patients.
† Ambulatory care (physician's office, medical clinic, and other ambulatory care setting).
§ Dentist office or dental clinic, pharmacy, laboratory, public health setting, health care education setting, emergency medical services setting, or other setting where clinical care or related services was provided to patients.
¶ Individual data on pharmacists were not collected before the 2012–13 season.
** Included dentists in 2010–11 season.
†† Allied health professionals, technicians, and technologists.
§§ Administrative support staff members or manager and nonclinical support staff members (including food service workers, laundry workers, janitors, and members of the housekeeping and maintenance staffs).
Alternate Text: The figure above is a line chart showing the percentage of health care personnel who reported receiving influenza vaccination, by work setting and occupation type, in the United States during the 2010–11 through 2014–15 influenza seasons.
Use of trade names and commercial sources is for identification only and does not imply endorsement by the U.S. Department of
Health and Human Services.
References to non-CDC sites on the Internet are
provided as a service to MMWR readers and do not constitute or imply
endorsement of these organizations or their programs by CDC or the U.S.
Department of Health and Human Services. CDC is not responsible for the content
of pages found at these sites. URL addresses listed in MMWR were current as of
the date of publication.
All MMWR HTML versions of articles are electronic conversions from typeset documents.
This conversion might result in character translation or format errors in the HTML version.
Users are referred to the electronic PDF version (http://www.cdc.gov/mmwr)
and/or the original MMWR paper copy for printable versions of official text, figures, and tables.
An original paper copy of this issue can be obtained from the Superintendent of Documents, U.S.
Government Printing Office (GPO), Washington, DC 20402-9371;
telephone: (202) 512-1800. Contact GPO for current prices.
**Questions or messages regarding errors in formatting should be addressed to
mmwrq@cdc.gov.
