Sustained Decrease in Laboratory Detection of Rotavirus after Implementation of Routine Vaccination — United States, 2000–2014
, MD1,2, , PhD2, , MPH2, and , MD2 (Author affiliations at end of text)
Rotavirus infection is the leading cause of severe gastroenteritis among infants and young children worldwide (1,2). Before the introduction of rotavirus vaccine in the United States in 2006, rotavirus infection caused significant morbidity among U.S. children, with an estimated 55,000–70,000 hospitalizations and 410,000 clinic visits annually (3). The disease showed a characteristic winter-spring seasonality and geographic pattern, with annual seasonal activity beginning in the West during December-January, extending across the country, and ending in the Northeast during April-May (4). To characterize changes in rotavirus disease trends and seasonality following introduction of rotavirus vaccines in the United States, CDC compared data from CDC's National Respiratory and Enteric Virus Surveillance System (NREVSS), a passive laboratory reporting system, for prevaccine (2000–2006) and postvaccine (2007–2014) years. National declines in rotavirus detection were noted, ranging from 57.8%–89.9% in each of the 7 postvaccine years compared with all 7 prevaccine years combined. A biennial pattern of rotavirus activity emerged in the postvaccine era, with years of low activity and highly erratic seasonality alternating with years of moderately increased activity and seasonality similar to that seen in the prevaccine era. These results demonstrate the substantial and sustained effect of rotavirus vaccine in reducing the circulation and changing the epidemiology of rotavirus among U.S. children.
NREVSS is a national laboratory-based passive reporting system for respiratory and enteric viruses, including rotavirus. Participating laboratories report weekly data to CDC, including the total number of stool samples tested for rotavirus by enzyme immunoassay and the number of specimens that tested positive. Annually, 75 to 90 laboratories report rotavirus testing data to NREVSS. A reporting year is defined as the period from July (epidemiologic week 27) to June (epidemiologic week 26) of the following year, beginning in July 2000. Rotavirus season onset is defined as the first of 2 consecutive weeks where 10% or more of specimens test positive for rotavirus. Similarly, season offset is defined as the last of 2 consecutive weeks where 10% or more of samples test positive. Peak season intensity is defined as the week with the highest proportion of tests positive for rotavirus. For analysis of season duration and peak intensity, data from all participating laboratories were included. The proportion of samples that tested positive for rotavirus and the mean decrease from the prevaccine years are reported for these data. Analyses of trends in disease were restricted to the 23 laboratories that consistently reported at least 26 weeks of data for each reporting year from July 2000 through June 2014. For this analysis, data are aggregated by week and reported as a 3-week moving average of total number of tests and rotavirus positive tests performed for the prevaccine period (2000–2006) and for each prevaccine season. Data are presented for the United States overall and for each U.S. census region.
Data from all participating NREVSS laboratories showed that with prevaccine seasons (2000–2006), median season onset was in epidemiologic week 50 (in December), peak activity was in week 9 (February/March, 43.1% positive samples) and season duration was 26 weeks. In comparison, these data showed that each of the 7 postvaccine seasons from 2007–2014 started later (if at all), had lower peak positivity for rotavirus (10.9%–27.3%), and were shorter in duration (0–18 weeks) (Table 1 and Figure 1). In the rotavirus reporting years spanning 2009–2010, 2011–2012 and 2013–2014, no seasonal onset occurred nationally, and the proportion of tests positive for rotavirus during the peak week was lower than the immediately preceding and following seasons. Examination of data for each region individually showed slight differences in seasonal onset, duration, and offset. Notably, in the South, season onset and duration varied, with some postvaccine years' season onset and duration comparable with median values from prevaccine years. This region also had only one reporting year where no season onset threshold was reached, whereas all other regions had at least two such reporting years. Regardless of these variations, most seasons within each region showed decreased length and activity compared with prevaccine years.
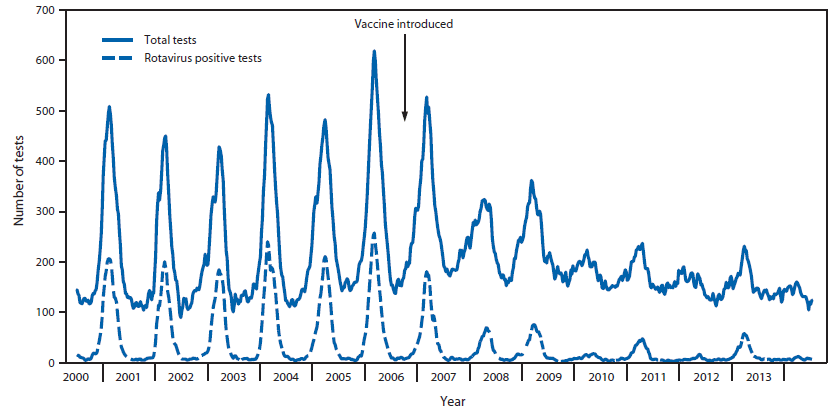
Data from 23 consistently reporting laboratories demonstrated a marked decline in rotavirus testing and positivity in the postvaccine years (Table 2 and Figure 2). Overall, after vaccine introduction, the number of total tests performed as well as the number of positive rotavirus tests declined each reporting year compared with those of the prevaccine years. Furthermore, the proportion of tests that were positive for rotavirus declined from 57.8%–89.9% in each of the seven postvaccine reporting years compared with prevaccine years combined, with alternating years of lower and greater positivity rates. Similar patterns were observed when the data were examined for each region.
Discussion
A marked and sustained decline in rotavirus activity was seen nationally in all seven rotavirus reporting years from 2007 to 2014 following the implementation of routine rotavirus vaccination of U.S. children. The decline was accompanied by changes in the predictable prevaccine seasonal pattern of rotavirus activity. The later onset and shorter duration of rotavirus seasons in the postvaccine era, including some years without a defined rotavirus season, could be a result of fewer unvaccinated, susceptible infants, resulting in reduced intensity and duration of rotavirus transmission (5). This reduced transmission of rotavirus likely also explains the declines in rates of rotavirus disease that have been seen in unvaccinated older children and even in some adult age groups in postvaccine years compared with the prevaccine era, resulting from the phenomenon known as herd immunity (6).
Biennial peaks in rotavirus activity also emerged in the postvaccine era in contrast to the annual peaks before vaccine implementation, although even the postvaccine reporting years with heavier rotavirus burden still demonstrated rotavirus activity levels that were substantially lower than those of the prevaccine years. This biennial pattern might be explained by an accumulation of a sufficient number of unvaccinated susceptible children over two successive reporting years to result in stronger rotavirus seasons every other year. Though rotavirus vaccine coverage among children aged 19–35 months has increased nationally since the vaccine was introduced, from 43.9% in 2009 to 72.6% 2013 (7), some children remain unvaccinated. In a low rotavirus reporting year, these unvaccinated children might not be exposed to wild-type rotavirus and thus remain susceptible in their second year of life. These susceptible children aged 12–23 months, together with unvaccinated infants from the next birth cohort, might form a critical mass of susceptible children sufficient to sustain more intense rotavirus transmission in alternate years.
The findings in this report are subject to at least four limitations. First, NREVSS only receives aggregate reports of the number of stool samples tested for rotavirus and the number of these that test positive, without any information on demographics or clinical features of individual patients, precluding detailed examination of these characteristics. Second, participating laboratory locations do not uniformly cover all areas of the United States, and as such regional biases might exist. Third, because testing for rotavirus does not alter clinical management of patients, testing practices might differ and affect comparability of data from site to site and year to year. Finally, any changes in rotavirus testing practices coinciding with implementation of the rotavirus vaccination program could affect interpretation of the disease trends, although the consistency of the declines in rotavirus activity across all regions and years argues against changes in testing being the main cause of the decline.
The declines in rotavirus activity seen in NREVSS data after vaccine introduction are supported by other U.S. studies showing declines in laboratory-confirmed rotavirus hospitalization (4) as well as reductions in outpatient visits, emergency room visits, acute gastroenteritis, and rotavirus-coded hospitalizations (8). During 2007–2011 more than 176,000 hospitalizations, 242,000 emergency department visits, and 1.1 million outpatients visits due to diarrhea were averted, resulting in costs savings of $924 million over this 4-year period (9). Given the sustained decline in rotavirus activity observed in the NREVSS data through 2014, we would expect additional medical visits due to diarrhea will have been prevented and additional cost savings accrued in the United States. The findings in this report are consistent with the high field effectiveness of vaccination observed in post-licensure epidemiologic studies (10). Taken together, these findings reaffirm the large public health impact of routine rotavirus vaccination in reducing the circulation of rotavirus among U.S. children.
¹Epidemic Intelligence Service, CDC; 2Division of Viral Diseases, National Center for Immunization and Respiratory Diseases, CDC (Corresponding author: Negar Aliabadi, ydh6@cdc.gov, 404.639.6367)
References
- Tate JE, Burton AH, Boschi-Pinto, Steele AD, Duque J, Parashar UD. 2008 estimate of worldwide rotavirus-associated mortality in children younger than 5 years before the introduction of universal rotavirus vaccination programmes: a systematic review and meta-analysis. Lancet Inf Dis 2012;12:136–41.
- Parashar UD, Hummelman EG, Bresee JS, Miller MA, Glass RI. Global illness and deaths caused by rotavirus disease in children. Emerg Infect Dis 2003;9:565–72.
- Cortese MM, Parashar UD. Prevention of rotavirus gastroenteritis among infants and children: recommendations of the advisory committee on immunization practices (ACIP). MMWR Recomm Rep 2009;58(No. RR-02):1–25.
- Tate JE, Mutuc JD, Panozzo CA, et al. Sustained decline in rotavirus detections in the United States following the introduction of rotavirus vaccine in 2006. 2011 Peds Inf Dis Supp; 30(1).
- Pitzer VE, Viboud C, Simonsen L, et al. Demographic variability, vaccination, and the spatiotemporal dynamics of rotavirus epidemics. Science 2009;325:290–4.
- Gastanaduy PA, Curns AT, Parashar UD, Lopman BA. Gastroenteritis hospitalization in older children and adults in the United States before and after implementation of infant rotavirus vaccination. JAMA 2013;210:851–3.
- Elam-Evans LD, Yankey D, Singleton JA, Kolasa M. National, state, and selected local area vaccination coverage among children aged 19–35 months — United States, 2013. 2014 MMWR Morbid Mortal Wkly Rep 2014;63;741–8.
- Cortes JE, Curns AT, Tate JE, et al. Rotavirus vaccine and health care utilization for diarrhea in US children. N Engl J Med 2011; 365:1108–17.
- Leshem E, Moritz RM, Curns AT et al. Rotavirus vaccines and health care utilization for diarrhea in the United States (2007-2011). Pediatrics 2014;134(1).
- Payne DC, Boom JA, Staat MA, et al. Effectiveness of pentavalent and monovalent rotavirus vaccines in concurrent use among US children <5 years of age, 2009–2011. Clin Inf Dis 2013;57:14–20.
What is already known on this topic?
Following the introduction of rotavirus vaccine in the United States in 2006, large declines have been observed in diarrhea and rotavirus hospitalizations among children aged <5 years, and onset of the rotavirus season has occurred later.
What is added by this report?
Analysis of data from the National Respiratory and Enteric Virus Surveillance System showed a marked and sustained decline in rotavirus activity nationally and regionally for the seven rotavirus reporting years from 2007 to 2014 following the implementation of routine rotavirus vaccination of U.S. children. In addition to rotavirus seasons with later onset and shorter duration, a biennial pattern of rotavirus activity emerged in the postvaccine era, with years of low activity and highly erratic seasonality alternating with years of greater activity and seasonality similar to those in the prevaccine era.
What are the implications for public health practice?
These findings reaffirm the large public health impact of routine rotavirus vaccination in reducing the circulation of rotavirus in U.S. children.
FIGURE 1. Rotavirus season duration and peak activity by reporting years (prevaccine 2000–2006 and postvaccine 2007–2011), NREVSS data — United States, 2000–2014
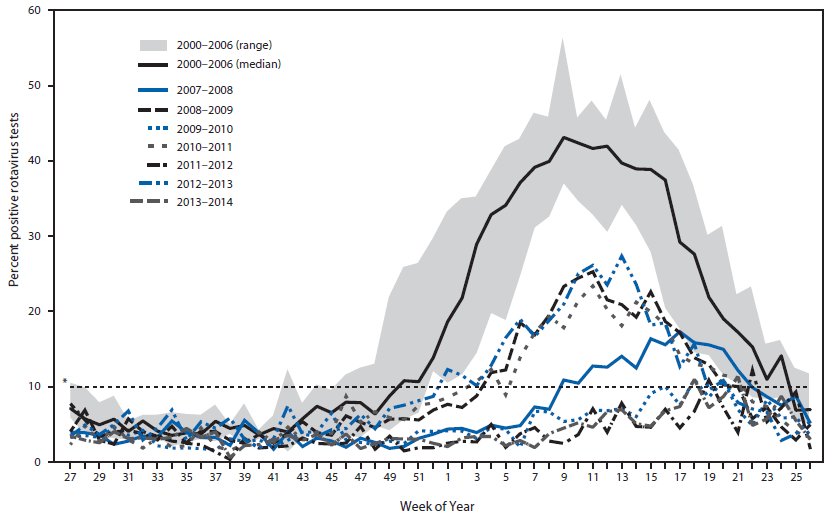
* Dashed line indicates the 10% threshold of numbers of positive test results, which is used to determine onset and offset of a rotavirus season.
Alternate Text: The figure above is a line chart showing rotavirus season duration and peak activity by reporting year (prevaccine 2000-2006 and postvaccine 2007-2011) in the United States during 2000-2014.
Use of trade names and commercial sources is for identification only and does not imply endorsement by the U.S. Department of
Health and Human Services.
References to non-CDC sites on the Internet are
provided as a service to MMWR readers and do not constitute or imply
endorsement of these organizations or their programs by CDC or the U.S.
Department of Health and Human Services. CDC is not responsible for the content
of pages found at these sites. URL addresses listed in MMWR were current as of
the date of publication.
All MMWR HTML versions of articles are electronic conversions from typeset documents.
This conversion might result in character translation or format errors in the HTML version.
Users are referred to the electronic PDF version (http://www.cdc.gov/mmwr)
and/or the original MMWR paper copy for printable versions of official text, figures, and tables.
An original paper copy of this issue can be obtained from the Superintendent of Documents, U.S.
Government Printing Office (GPO), Washington, DC 20402-9371;
telephone: (202) 512-1800. Contact GPO for current prices.
**Questions or messages regarding errors in formatting should be addressed to
mmwrq@cdc.gov.
