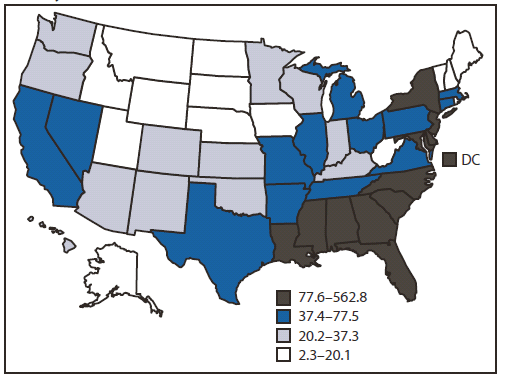
FIGURE 1. Prevalence rates of persons aged 13–24 years living with a diagnosis of HIV infection* — National HIV Surveillance System, United States, year-end 2009
Persons using assistive technology might not be able to fully access information in this file. For assistance, please send e-mail to: mmwrq@cdc.gov. Type 508 Accommodation and the title of the report in the subject line of e-mail.
Vital Signs: HIV Infection, Testing, and Risk Behaviors Among Youths — United States
On November 27, 2012, this report was posted as an MMWR Early Release on the MMWR website (http://www.cdc.gov/mmwr).
Abstract
Background: In 2009, 6.7% of the estimated 1.1 million persons living with human immunodeficiency virus (HIV) infection in the United States were youths (defined in this report as persons aged 13–24 years); more than half of youths with HIV (59.5%) were unaware of their infection.
Methods: CDC used National HIV Surveillance System data to estimate, among youths, prevalence rates of diagnosed HIV infection in 2009 and the number of new infections (incidence) in 2010. To assess the prevalence of risk factors and HIV testing among youths, CDC used the 2009 and 2011 Youth Risk Behavior Surveillance System for 9th–12th grade students and the 2010 National Health Interview Survey (NHIS) for persons 18–24 years.
Results: Prevalence of diagnosed HIV was 69.5 per 100,000 youths at the end of 2009. Youths accounted for 12,200 (25.7%) new HIV infections in 2010. Of these, 7,000 (57.4%) were among blacks/African Americans, 2,390 (19.6%) among Hispanics/Latinos, and 2,380 (19.5%) among whites; 8,800 (72.1%) were attributed to male-to-male sexual contact. The percentage of youths tested for HIV overall was 12.9% among high school students and 34.5% among those aged 18–24 years; it was lower among males than females, and lower among whites and Hispanics/Latinos than blacks/African Americans.
Conclusions: A disproportionate number of new HIV infections occurs among youths, especially blacks/African Americans, Hispanics/Latinos, and men who have sex with men (MSM). The percentage of youths tested for HIV, however, was low, particularly among males.
Implications for Public Health: More effort is needed to provide effective school- and community-based interventions to ensure all youths, particularly MSM, have the knowledge, skills, resources, and support necessary to avoid HIV infection. Health-care providers and public health agencies should ensure that youths are tested for HIV and have access to sexual health services, and that HIV-positive youths receive ongoing health-care and prevention services.
Introduction
The risk for acquiring human immunodeficiency virus (HIV) infection during adolescence and early adulthood starts with initiation of sexual behavior or injection drug use, and initiation of contributing behaviors such as use of alcohol and other drugs. The prevalence of HIV in potential sex partners, the percentage of HIV-infected persons unaware of their status, and the frequency of risky sexual behaviors and injection drug use contribute to the level of risk. In 2009, youths (defined in this report as persons aged 13–24 years), who represented 21% of the U.S. population, comprised 6.7% of persons living with HIV. More than half (59.5%) were unaware of their infection, the highest for any age group (1). All persons need to understand the threat of HIV and how to prevent it (2). Youths, particularly those at highest risk, need effective school-based, school-linked, and community-based interventions (3) that make them aware of their risk for HIV and help delay initiation of sexual activity, increase condom use for those who are sexually active, and decrease other behaviors, such as alcohol and drug use, that contribute to HIV risk. This report describes, among youths, 1) rates of those living with a diagnosis of HIV infection at the end of 2009, 2) the estimated number of new HIV infections in 2010, 3) the percentage that have been tested for HIV, and 4) the percentage that engage in selected risk behaviors.
Methods
To calculate prevalence per 100,000 by state among persons aged 13–24 years living with diagnosed HIV infection at the end of 2009, and the number of new HIV infections among youths by sex, race/ethnicity, and transmission category* in 2010, data from the National HIV Surveillance System were used.† To describe HIV testing and risk behaviors for persons aged 13–24 years, two data sources were required. First, two components of the Youth Risk Behavior Surveillance System were analyzed. The 2011 National Youth Risk Behavior Survey (YRBS) (4) was used to estimate percentages of 9th–12th grade students (predominantly aged 14–17 years) who had ever been tested for HIV (excluding tests performed for blood donations), overall and by sex, race/ethnicity, and sexual behavior.§ To describe HIV risk behaviors among male and female students in grades 9–12 based on the sex of their sexual contacts, CDC combined additional YRBS data from 2009 and 2011 collected by 12 states and nine large urban school districts.¶ Approximately half (48.9%) of all persons aged 13–24 years living with an HIV diagnosis and reported to the National HIV Surveillance System live in these 12 states and nine cities. T-tests were used to test for statistically significant differences (p<0.05) between subgroups. Second, 2010 National Health Interview Survey (NHIS) data were used to calculate the percentages of persons aged 18–24 years who had ever been tested for HIV (excluding tests performed for blood donations) overall and by sex, race/ethnicity, and HIV risk factor.**
Results
At the end of 2009, the prevalence of persons aged 13–24 years living with an HIV diagnosis was 69.5 per 100,000, ranging by state from 2.3 to 562.8 per 100,000 population (Figure 1). Rates were higher in the South and Northeast compared with the West and Midwest.
In 2010, of the estimated 47,500 new HIV infections, 12,200 (25.7%) were among youths (10,100 [82.8%] among males and 2,100 [17.2%] among females). An estimated 7,000 (57.4%) newly infected youths were blacks/African Americans (5,600 males and 1,400 females), 2,390 (19.6%) were Hispanics/Latinos (2,100 males and 290 females), and 2,380 (19.5%) were whites (2,100 males and 280 females) (Figure 2). By transmission category, 72.1% of all new HIV infections among youths were attributed to male-to-male sexual contact, 19.8% to heterosexual contact,†† 4.0% to injection drug use, and 3.7% to male-to-male sexual contact and injection drug use. Among females, 85.7% of infections were attributed to heterosexual contact and 12.9% to injection drug use. Among males, 87.1% of infections were attributed to male-to-male sexual contact, 6.0% to heterosexual contact, 2.2% to injection drug use, and 4.5% to male-to-male sexual contact and injection drug use. Of the 8,800 new infections among youths attributed to male-to-male sexual contact, 4,800 (54.4%) were among blacks/African Americans, 1,900 (21.6%) among Hispanics/Latinos, and 1,800 (20.5%) among whites.
In the 12 states and nine large urban school districts, more risk behaviors were reported by male high school students who had sexual contact with males (i.e., males who had sexual contact with males only or with both males and females [MSM]) compared with males who had sexual contact only with females (Table 1). Among high school students who had had sexual contact, MSM were significantly more likely than other males to have had sexual intercourse with four or more persons during their lifetime (39.4% compared with 26.9%), and to have ever injected any illegal drug (20.4% compared with 2.9%), and were significantly less likely to report having ever been taught in school about acquired immunodeficiency syndrome (AIDS) or HIV infection (74.6% compared with 86.3%). Currently sexually active§§ MSM were significantly more likely than currently sexually active males who had sexual contact only with females to have drunk alcohol or used drugs before last sexual intercourse (38.5% compared with 24.3%) and were significantly less likely to have used a condom during last sexual intercourse (44.3% compared with 70.2%).
In 2011, 12.9% of all 9th–12th grade students had been tested for HIV (Table 2). Of those who ever had sexual intercourse (49.2% of male and 45.6% of female high school students), 22.2% had been tested for HIV. Female students (27.2%) were significantly more likely than male students (17.6%), and black/African American students (32.0%) were significantly more likely than Hispanic/Latino (20.1%) or white (19.6%) students to have been tested for HIV. In 2010, 34.5% of persons aged 18–24 years had ever been tested for HIV (Table 3). Testing among this age group also was higher among females (45.0%) compared with males (24.1%), and higher among blacks/African Americans (53.3%) compared with Hispanics/Latinos (36.2%) or whites (29.8%).
Conclusions and Comment
Based on the most recent data available from 2009 and 2010, youths represent 6.7% of persons living with HIV in the United States and account for 25.7% of new HIV infections. Of new HIV infections among youths, 45.9% were among black/African American males, the majority of which were attributed to male-to-male sexual contact. Nationwide, the percentage of youths who had ever been tested for HIV was low compared with other age groups (1): 12.9% among high school students (22.2% among those who ever had sexual intercourse) and 34.5% among persons aged 18–24 years.
The higher HIV prevalence among blacks/African Americans overall (nearly three times higher than among Hispanics/Latinos and nearly eight times higher than among whites [1]) and MSM overall (nearly 40 times higher than other men [5]) contributes to the disproportionate number of new HIV infections among black/African American youths and young MSM. Because of this disparity, black/African American youths are at higher risk for infection even with similar levels of risk behaviors (6). Other research has found that among young MSM, other factors such as stigma, discrimination (7), less condom use, more alcohol and drug use, and having sex with older partners (8) contribute to even higher risk for HIV acquisition. This analysis also found that young MSM were significantly less likely to use condoms during last sexual intercourse, more likely to drink alcohol or use drugs before last sexual intercourse, and more likely to have four or more partners during their lifetime compared with young men who had sexual intercourse only with females. These behaviors are associated with substantial risk for infection. In one study among MSM, the attributable risk for new HIV infection was 29% for using alcohol or drugs before sex and 32% for having four to nine sex partners (9). Further, in a study of primarily young MSM, 75% of those with acute HIV infection reported sex under the influence of drugs or alcohol compared with 31% of HIV-uninfected MSM. Moreover, the risk for HIV infection doubled for MSM with a sex partner 5 years older and quadrupled with a sex partner 10 years older (8).
More than half (59.5%) of youths with HIV are unaware of their infection (1). Although the number of new HIV infections is highest among males, fewer males have been tested for HIV than females. Routine HIV testing as part of regular medical care is recommended by CDC for all persons aged 13–64 years (10) and by the American Academy of Pediatrics for all youths by age 16–18 years and all sexually active youths regardless of age (11). Better adherence to these guidelines, especially for males, is needed to increase early HIV diagnosis and facilitate treatment that improves health and reduces transmission.
Interventions for youths have been proven effective for delaying initiation of sexual activity, increasing condom use, and reducing other risk behaviors, such as drug and alcohol use.¶¶ The Community Preventive Services Task Force recommends risk reduction interventions in school and community settings to prevent HIV among adolescents (3). Individual- and group-level HIV prevention interventions provide knowledge, skill building, and increased motivation to adopt behaviors that protect against HIV infection, and some are designed specifically for youths at high risk for HIV.
For young MSM (those aged 18–29 years), "Mpowerment" is an effective community-level intervention that has been shown to reduce unprotected anal intercourse, the sexual behavior that carries the greatest risk for HIV transmission (12). However, additional individual- and group-level interventions specifically designed for young MSM, and young black/African American MSM in particular, are needed. Evidence-based behavioral HIV interventions for high risk youths can be adapted to address the unique needs of young MSM and to communicate the substantial risks associated with having sex with partners who are more likely to be infected, particularly those who are older.
Multicomponent school-based interventions, including classroom-based curricula and school-wide environmental changes, have been shown to decrease unprotected sex and increase condom use among youths (3). Policies can support these efforts by promoting in schools an inclusive environment for sexual minorities that reduces stigma and discrimination (13) and requiring evidence-based HIV prevention education (3) for all students. In addition, community organizations, schools, and health-care providers can establish procedures that reduce barriers and protect confidentiality (i.e., procedures that do not disclose information to unauthorized persons unless required under state law) for youths seeking sexual health services (14) and facilitate access to education and other HIV prevention services.
Early diagnosis and treatment can reduce HIV progression and prevent transmission, but youths are less likely to be tested, access care, remain in care, and achieve viral suppression (15). Youth-friendly, culturally competent, confidential, and convenient health services facilitate access to and retention in care.*** Comprehensive health services, including HIV/sexually transmitted infection screening, treatment, and prevention services, and adjunct services, such as mental health, drug and alcohol treatment, and housing assistance, are necessary for youths at highest risk of acquiring or transmitting HIV. Because young MSM often acquire HIV from older, HIV-positive partners (8), regular testing, care, and treatment for adult MSM also are essential to prevent HIV infections among youths.
Limitations of the estimates of new HIV infections have been described previously (15). In addition, the findings in this report are subject to at least three more limitations. First, YRBS data apply only to youths who attend school and therefore are not representative of all persons in this age group. Nationwide, in 2009, of persons aged 16–17 years, approximately 4% were not enrolled in a high school program and had not completed high school (4). Second, NHIS excludes active military personnel and those who live outside of households (e.g., persons who are incarcerated, in long-term–care institutions, or homeless), who might be at greater risk for HIV infection than persons in households. Finally, data from YRBS and NHIS are self-reported and subject to recall bias and potential underreporting of sensitive information, such as HIV risk factors and HIV testing.
To achieve the goals of the National HIV/AIDS Strategy for the United States (i.e., to reduce the number of persons who become infected with HIV and reduce disparities), public health agencies, in conjunction with families, educators, and health-care practitioners, must educate youths about HIV before they begin engaging in risk behaviors, especially young gay and bisexual males, particularly blacks/African Americans, who face a disproportionately higher risk (2). To delay the onset of sexual activity, increase condom use among those who are sexually active, and decrease injection drug use, multicomponent school- and community-based approaches that provide access to condoms, HIV testing and treatment, and behavioral interventions for those at highest risk are needed.
Reported by
Suzanne K. Whitmore, DrPH, Laura Kann, PhD, Joseph Prejean, PhD, Linda J Koenig, PhD, Bernard M. Branson, MD, H. Irene Hall, PhD, Amy M. Fasula, PhD, Angie Tracey, Jonathan Mermin, MD, Linda A. Valleroy, PhD, Div of HIV/AIDS Prevention, Div of Adolescent and School Health, National Center for HIV/AIDS, Viral Hepatitis, STD, and TB Prevention, CDC. Corresponding contributor: Suzanne K. Whitmore, swhitmore@cdc.gov, 404-639-1556.
References
- CDC. Monitoring selected national HIV prevention and care objectives by using HIV surveillance data—United States and six U.S. dependent areas—2010. HIV Surveillance Supplemental Report 2012;17(No. 3, part A). Atlanta, GA: US Department of Health and Human Services, CDC; 2012. Available at http://www.cdc.gov/hiv/topics/surveillance/resources/reports. Accessed October 25, 2012.
- Office of National AIDS Policy. National HIV/AIDS Strategy. Washington, DC: Office of National AIDS Policy; 2010. Available at http://www.whitehouse.gov/administration/eop/onap/nhas. Accessed October 25, 2012.
- CDC. Guide to community preventive services. Prevention of HIV/AIDS, other STIs and pregnancy: interventions for adolescents. Atlanta, GA: US Department of Health and Human Services, CDC; 2010. Available at http://www.thecommunityguide.org/hiv/riskreduction.html. Accessed October 25, 2012.
- CDC. Youth Risk Behavior Surveillance—United States, 2011. MMWR 2012;61(No. SS-4).
- Purcell DW, Johnson CH, Lansky A, et al. Estimating the population size of men who have sex with men in the United States to obtain HIV and syphilis rates. Open AIDS J 2012;6(Suppl1:M6):98–107.
- Hallfors DD, Iritani BJ, Miller WC, Bauer DJ. Sexual and drug behavior patterns and HIV and STD racial disparities: the need for new directions. Am J Public Health 2007;97:125–32.
- Wong CF, Weiss G, Ayala G, Kipke MD. Harassment, discrimination, violence, and illicit drug use among young men who have sex with men. AIDS Educ Prev 2010;22:286–98.
- Hurt CB, Matthews DD, Calabria MS, et al. Sex with older partners is associated with primary HIV infection among men who have sex with men in North Carolina. J Acquir Immune Defic Syndr 2010;54:185–90.
- Koblin BA, Husnik MJ, Colfax G, et al. Risk factors for HIV infection among men who have sex with men. AIDS 2006;20:731–9.
- CDC. Revised recommendations for HIV testing of adults, adolescents, and pregnant women in health-care settings. MMWR 2006;55(No. RR-14).
- Committee on Pediatric AIDS, Emmanuel PJ, Martinez J. Adolescents and HIV infection: the pediatrician's role in promoting routine testing. Pediatrics 2011;128:1023–9.
- Kegeles SM, Hays RB, Coates TJ. The Mpowerment Project: a community-level HIV prevention intervention for young gay men. Am J Public Health 1996;86:1129–36.
- Goodenow C, Szalacha L, Westheimer K. School support groups, other school factors, and the safety of sexual minority adolescents. Psychology in the Schools 2006;43:573–89.
- Ford C, English A, Sigman G. Confidential health care for adolescents: position paper of the Society for Adolescent Medicine. J Adolesc Health 2004;35:160–7.
- Hall HI, Frazier EL, Rhodes P, et al. Continuum of HIV care: differences in care and treatment by sex and race/ethnicity in the United States. Presented at the 2012 International AIDS Conference, District of Columbia, July 22–27, 2012, oral abstract FRLBX05.
- Prejean J, Song R, Hernandez A, et al; HIV Incidence Surveillance Group. Estimated HIV incidence in the United States, 2006–2009. PLoS One 2011;6:e17502.
* Transmission category is the term used to summarize a person's HIV risk factors; the summary classification results from selecting, from the presumed hierarchical order of probability, the one risk factor most likely to have been responsible for transmission. For surveillance purposes, a single transmission category is assigned to each diagnosis of HIV infection. Persons with more than one reported risk factor for HIV infection are classified in the transmission category listed first in a hierarchy of transmission categories based on their presumed order of probability. An exception is the category for male-to-male sexual contact and injection drug use; this group makes up a separate transmission category. Persons whose transmission category is classified as male-to-male sexual contact include males who ever had sexual contact with other males and males who ever had sexual contact with both males and females.
† Through HIV incidence surveillance, data on HIV testing and antiretroviral use history are used to calculate the probability that a person would have a test for HIV infection during a defined recency period, and these probabilities are used to assign a weight to each new diagnosis classified as a recent infection, using results of the serologic testing algorithm for recent HIV seroconversion. Weights are summed to determine the incidence of HIV infection in the 18 states and two cities that provide HIV incidence surveillance data. To extrapolate results to the entire United States, the ratio of the number of new HIV infections to the number of new HIV diagnoses in the areas providing data is applied to the number of new HIV diagnoses in the areas that did not contribute data.
§ The national YRBS used a three-stage cluster sample to obtain cross-sectional data representative of public and private school students in grades 9–12 in the 50 states and District of Columbia. The school response rate was 81%, the student response rate was 87%, and the overall response rate was 71%.
¶ These surveys used a two-stage cluster sample to obtain additional data representative of public school students in grade 9–12 in 11 states (Connecticut, Delaware, Florida, Hawaii, Illinois, Massachusetts, Michigan, New Hampshire, Rhode Island, Vermont, and Wisconsin) and nine large urban school districts (Boston, Chicago, Detroit, District of Columbia, Los Angeles, Milwaukee, New York City, San Diego, and Seattle) and public and private school students in grades 9–12 in one state (Ohio). The school response rates averaged 92%, the student response rates averaged 80%, and the overall response rates averaged 73%.
** NHIS is a nationally representative, annual, cross-sectional, multistage probability sample household survey that provides prevalence estimates for a broad range of health measures for the civilian, noninstitutionalized U.S. population, based on in-person interviews with a nationally representative sample of adults aged ≥18 years. This report presents NHIS data for adults aged 18–24 years living in the 50 states and District of Columbia. The final response rate for the adult sample person component was calculated as 60.8%.
†† Heterosexual contact with a person known to have, or to be at high risk for, HIV infection.
§§ Had sexual intercourse with at least one person during the 3 months before the survey.
¶¶ Additional information available at http://www.cdc.gov/hiv/topics/research/prs/subset-best-evidence-interventions.htm#link2.3.
*** Additional information available at http://whqlibdoc.who.int/publications/2009/9789241598859_eng.pdf.
|
Key Points |
|
Abbreviation: HIV = human immunodeficiency virus.
* Prevalence rates are per 100,000 population and are not adjusted for reporting delays. Prevalences are categorized into quartiles. Overall prevalence rate: 69.5 per 100,000.
Alternate Text: The figure above shows prevalence rates of persons aged 13-24 years living with a diagnosis of HIV infection in the United States as of the end of 2009. The prevalence of persons aged 13-24 years living with an HIV diagnosis was 69.5 per 100,000 population, ranging by state from 2.3 to 562.8 per 100,000.
FIGURE 2. Number of new HIV infections among youths aged 13–24 years, by sex and race/ethnicity — United States, 2010
![The figure shows the number of new HIV infections among youths aged 13-24 years, by sex and race/ethnicity, in the United States during 2010. In 2010, of the estimated 47,500 new HIV infections, 12,200 (25.7%) were among youths, (10,100 [82.8%] among males and 2,100 [17.2%] among females). An estimated 7,000 (57.4%) newly infected youths were blacks/African Americans (5,600 males and 1,400 females), 2,390 (19.6%) were Hispanics/Latinos (2,100 males and 290 females), and 2,380 (19.5%) were whites (2,100 males and 280 females).](figures/m6147a5f2.gif)
Abbreviation: HIV = human immunodeficiency virus.
* Hispanics/Latinos might be of any race.
Alternate Text: The figure above shows the number of new HIV infections among youths aged 13-24 years, by sex and race/ethnicity, in the United States during 2010. In 2010, of the estimated 47,500 new HIV infections, 12,200 (25.7%) were among youths, (10,100 [82.8%] among males and 2,100 [17.2%] among females). An estimated 7,000 (57.4%) newly infected youths were blacks/African Americans (5,600 males and 1,400 females), 2,390 (19.6%) were Hispanics/Latinos (2,100 males and 290 females), and 2,380 (19.5%) were whites (2,100 males and 280 females).
Use of trade names and commercial sources is for identification only and does not imply endorsement by the U.S. Department of
Health and Human Services.
References to non-CDC sites on the Internet are
provided as a service to MMWR readers and do not constitute or imply
endorsement of these organizations or their programs by CDC or the U.S.
Department of Health and Human Services. CDC is not responsible for the content
of pages found at these sites. URL addresses listed in MMWR were current as of
the date of publication.
All MMWR HTML versions of articles are electronic conversions from typeset documents.
This conversion might result in character translation or format errors in the HTML version.
Users are referred to the electronic PDF version (http://www.cdc.gov/mmwr)
and/or the original MMWR paper copy for printable versions of official text, figures, and tables.
An original paper copy of this issue can be obtained from the Superintendent of Documents, U.S.
Government Printing Office (GPO), Washington, DC 20402-9371;
telephone: (202) 512-1800. Contact GPO for current prices.
**Questions or messages regarding errors in formatting should be addressed to
mmwrq@cdc.gov.
