| TABLE 58. (Continued) Percentage of high school students who ever took steroids without a doctor's prescription,* by sex — selected U.S. sites, Youth Risk Behavior Survey, 2011 |
||||||
|---|---|---|---|---|---|---|
| Site |
Female |
Male |
Total |
|||
| % |
CI† |
% |
CI |
% |
CI |
|
Large urban school district surveys |
||||||
Boston, MA |
1.1 |
(0.5–2.6) |
4.0 |
(2.2–7.3) |
2.6 |
(1.5–4.4) |
Broward County, FL |
1.7 |
(1.0–2.9) |
3.6 |
(2.5–5.2) |
2.8 |
(2.1–3.8) |
Charlotte-Mecklenburg, NC |
— |
— |
— |
— |
— |
— |
Chicago, IL |
3.5 |
(2.2–5.5) |
5.0 |
(3.5–7.1) |
4.5 |
(3.5–5.7) |
Dallas, TX |
2.0 |
(1.1–3.8) |
2.8 |
(1.5–5.2) |
2.4 |
(1.5–3.8) |
Detroit, MI |
1.7 |
(1.1–2.8) |
2.7 |
(1.6–4.4) |
2.5 |
(1.8–3.5) |
District of Columbia |
1.2 |
(0.6–2.5) |
6.6 |
(4.5–9.8) |
3.9 |
(2.6–5.9) |
Duval County, FL |
3.4 |
(2.6–4.5) |
6.6 |
(5.1–8.3) |
5.2 |
(4.3–6.3) |
Houston, TX |
4.7 |
(3.5–6.4) |
5.3 |
(4.0–7.0) |
5.1 |
(4.2–6.3) |
Los Angeles, CA |
1.8 |
(1.1–2.9) |
5.2 |
(3.0–8.7) |
3.8 |
(2.5–5.7) |
Memphis, TN |
1.3 |
(0.6–2.8) |
2.2 |
(1.3–3.8) |
1.8 |
(1.2–2.8) |
Miami-Dade County, FL |
2.8 |
(1.8–4.5) |
4.6 |
(3.3–6.4) |
3.7 |
(2.7–5.0) |
Milwaukee, WI |
— |
— |
— |
— |
— |
— |
New York City, NY |
— |
— |
— |
— |
— |
— |
Orange County, FL |
3.4 |
(2.4–4.9) |
4.8 |
(2.9–7.7) |
4.1 |
(3.0–5.5) |
Palm Beach County, FL |
2.7 |
(1.8–4.1) |
6.5 |
(4.7–8.8) |
4.7 |
(3.7–6.1) |
Philadelphia, PA |
2.8 |
(1.9–4.2) |
4.2 |
(2.8–6.3) |
3.7 |
(2.7–5.0) |
San Bernardino, CA |
3.9 |
(2.6–6.0) |
4.1 |
(2.7–6.3) |
4.0 |
(2.9–5.5) |
San Diego, CA |
2.3 |
(1.3–4.0) |
3.3 |
(2.1–5.2) |
2.9 |
(1.9–4.3) |
San Francisco, CA |
— |
— |
— |
— |
— |
— |
Seattle, WA |
— |
— |
— |
— |
— |
— |
Median |
2.5 |
4.4 |
3.7 |
|||
Range |
1.1–4.7 |
2.2–6.6 |
1.8–5.2 |
|||
* Took steroid pills or shots without a doctor's prescription one or more times during their life. † 95% confidence interval. § Not available. |
||||||
Persons using assistive technology might not be able to fully access information in this file. For assistance, please send e-mail to: mmwrq@cdc.gov. Type 508 Accommodation and the title of the report in the subject line of e-mail.
Youth Risk Behavior Surveillance — United States, 2011
Abstract
Problem: Priority health-risk behaviors, which are behaviors that contribute to the leading causes of morbidity and mortality among youth and adults, often are established during childhood and adolescence, extend into adulthood, and are interrelated and preventable.
Reporting Period Covered: September 2010–December 2011.
Description of the System: The Youth Risk Behavior Surveillance System (YRBSS) monitors six categories of priority health-risk behaviors among youth and young adults: 1) behaviors that contribute to unintentional injuries and violence; 2) tobacco use; 3) alcohol and other drug use; 4) sexual behaviors that contribute to unintended pregnancy and sexually transmitted diseases (STDs), including human immunodeficiency virus (HIV) infection; 5) unhealthy dietary behaviors; and 6) physical inactivity. In addition, YRBSS monitors the prevalence of obesity and asthma. YRBSS includes a national school-based Youth Risk Behavior Survey (YRBS) conducted by CDC and state and large urban school district school-based YRBSs conducted by state and local education and health agencies. This report summarizes results from the 2011 national survey, 43 state surveys, and 21 large urban school district surveys conducted among students in grades 9–12.
Results: Results from the 2011 national YRBS indicated that many high school students are engaged in priority health-risk behaviors associated with the leading causes of death among persons aged 10–24 years in the United States. During the 30 days before the survey, 32.8% of high school students nationwide had texted or e-mailed while driving, 38.7% had drunk alcohol, and 23.1% had used marijuana. During the 12 months before the survey, 32.8% of students had been in a physical fight, 20.1% had ever been bullied on school property, and 7.8% had attempted suicide. Many high school students nationwide are engaged in sexual risk behaviors associated with unintended pregnancies and STDs, including HIV infection. Nearly half (47.4%) of students had ever had sexual intercourse, 33.7% had had sexual intercourse during the 3 months before the survey (i.e., currently sexually active), and 15.3% had had sexual intercourse with four or more people during their life. Among currently sexually active students, 60.2% had used a condom during their last sexual intercourse. Results from the 2011 national YRBS also indicate many high school students are engaged in behaviors associated with the leading causes of death among adults aged ≥25 years in the United States. During the 30 days before the survey, 18.1% of high school students had smoked cigarettes and 7.7% had used smokeless tobacco. During the 7 days before the survey, 4.8% of high school students had not eaten fruit or drunk 100% fruit juices and 5.7% had not eaten vegetables. Nearly one-third (31.1%) had played video or computer games for 3 or more hours on an average school day.
Interpretation: Since 1991, the prevalence of many priority health-risk behaviors among high school students nationwide has decreased. However, many high school students continue to engage in behaviors that place them at risk for the leading causes of morbidity and mortality. Variations were observed in many health-risk behaviors by sex, race/ethnicity, and grade. The prevalence of some health-risk behaviors varied substantially among states and large urban school districts.
Public Health Action: YRBS data are used to measure progress toward achieving 20 national health objectives for Healthy People 2020 and one of the 26 leading health indicators; to assess trends in priority health-risk behaviors among high school students; and to evaluate the impact of broad school and community interventions at the national, state, and local levels. More effective school health programs and other policy and programmatic interventions are needed to reduce risk and improve health outcomes among youth.
Introduction
In the United States, 72% of all deaths among youth and young adults aged 10–24 years result from four causes: motor vehicle crashes (26%), other unintentional injuries (17%), homicide (16%), and suicide (13%) (1). Substantial morbidity and social problems also result from the estimated 410,000 births (2); 517,174 cases of chlamydia, gonorrhea, and syphilis (3); and 2,036 cases of human immunodeficiency virus (HIV) (4) reported in 2009 among youth aged 15–19 years. Among adults aged ≥25 years, 57% of all deaths in the United States result from cardiovascular disease (34%) and cancer (23%) (1). These leading causes of morbidity and mortality among youth and adults in the United States are related to six categories of priority health-risk behaviors: 1) behaviors that contribute to unintentional injuries and violence; 2) tobacco use; 3) alcohol and other drug use; 4) sexual behaviors that contribute to unintended pregnancy and sexually transmitted diseases (STDs), including HIV infection; 5) unhealthy dietary behaviors; and 6) physical inactivity. These behaviors frequently are interrelated and are established during childhood and adolescence and extend into adulthood. To monitor priority health-risk behaviors in each of these six categories and obesity and asthma among youth and young adults, CDC developed the Youth Risk Behavior Surveillance System (YRBSS) (5). YRBSS includes school-based national, state, and large urban school district Youth Risk Behavior Surveys (YRBS) conducted among representative samples of students in grades 9–12. National, state, and large urban school district surveys have been conducted biennially since 1991 (Table 1). Additional information about the YRBSS is available at http://www.cdc.gov/yrbs.
This report summarizes results from the 2011 national YRBS and trends in health-risk behaviors during 1991–2011. Data from the 43 state and 21 large urban school district surveys with weighted data for the 2011 YRBSS cycle (Figure) also are included in this report. Data from the remaining four state surveys and one large urban school district survey with unweighted data are not included. Among those with weighted data for 2011, one state and five large urban school district surveys were conducted during fall 2010; the national survey, 39 state surveys, and 15 large urban school district surveys were conducted during spring 2011; and three state surveys and one large urban school district survey were conducted during fall 2011.
Methods
Detailed information about the methodology of the national, state, and large urban school district YRBSs has been described elsewhere (5).
Sampling
National Youth Risk Behavior Survey
The sampling frame for the 2011 national YRBS consisted of all regular public and private schools with students in at least one of grades 9–12 in the 50 states and the District of Columbia. The sampling frame was obtained from the Market Data Retrieval (MDR) database (6). The MDR database includes information on both public and private schools and the most recent data from the Common Core of Data from the National Center for Education Statistics (7). A three-stage cluster sample design produced a nationally representative sample of students in grades 9–12 who attend public and private schools. The first-stage sampling frame consisted of 1,276 primary sampling units (PSUs), consisting of counties, subareas of large counties, or groups of smaller, adjacent counties. The 1,276 PSUs were categorized into 16 strata according to their metropolitan statistical area (MSA) status (i.e., urban city) and the percentages of black and Hispanic students in the PSUs. From the 1,276 PSUs, 57 were sampled with probability proportional to overall school enrollment size for the PSU.
In the second stage of sampling, 194 schools with any of grades 9–12 were sampled with probability proportional to school enrollment size. The third stage of sampling consisted of random sampling in each of grades 9–12, one or two classrooms from either a required subject (e.g., English or social studies) or a required period (e.g., homeroom or second period). All students in sampled classes were eligible to participate. Schools, classes, and students that refused to participate were not replaced.
To enable a separate analysis of data for black and Hispanic students, three strategies were used to oversample these students: 1) larger sampling rates were used to select PSUs that were in high-black and high-Hispanic strata; 2) a modified measure of size was used to increase the probability of sampling schools with a disproportionately high minority enrollment; and 3) two classes per grade, rather than one, were sampled in schools with a high minority enrollment.
State and Large Urban School District Youth Risk Behavior Surveys
In 2011, a two-stage cluster sample design was used to produce a representative sample of public school students in grades 9–12 in 41 states and 21 large urban school districts and of public and private school students in grades 9–12 in two states (Ohio and South Dakota). In the first sampling stage, schools with any of grades 9–12 were sampled with probability proportional to school enrollment size in 42 states and four large urban school districts; all schools with any of grades 9–12 were invited to participate in one state and 17 large urban school districts. In the second sampling stage, intact classes from either a required subject (e.g., English or social studies) or a required period (e.g., homeroom or second period) were sampled randomly in 42 states and 21 large urban school districts, and all students in the sampled classes were eligible to participate. In one state, all students in sampled schools were eligible to participate.
Data Collection Procedures and Questionnaires
Survey procedures for the national, state, and large urban school district surveys were designed to protect students' privacy by allowing for anonymous and voluntary participation. Before survey administration, local parental permission procedures were followed. Students completed the self-administered questionnaire during one class period and recorded their responses directly on a computer-scannable booklet or answer sheet. CDC's Institutional Review Board approved the protocol for the national YRBS.
The 2011 YRBS standard questionnaire contained 86 questions. States and large urban school districts could add or delete questions from the standard questionnaire. For the national questionnaire, 11 questions were added to the standard questionnaire. Skip patterns were not included in any YRBS questionnaire to protect students' privacy by ensuring all students took about the same amount of time to complete the questionnaire. For state and large urban school district surveys, only data from standard questions are presented in this report. Information about the reliability of the standard questionnaire has been published elsewhere (8). The standard and national YRBS questionnaires are available at http://www.cdc.gov/healthyyouth/yrbs/questionnaire_rationale.htm.
Data Processing Procedures and Response Rates
For the 2011 national YRBS, 15,503 questionnaires were completed in 158 schools. The national data set was cleaned and edited for inconsistencies. Missing data were not statistically imputed. Among the 15,503 completed questionnaires, 78 failed quality control* and were excluded from analysis, leaving 15,425 usable questionnaires (Table 2). The school response rate was 81%; the student response rate was 87%; the overall response rate was 71%† (Table 2).
Data from each state and large urban school district survey were cleaned and edited for inconsistencies with the same procedures used for the national data set. The number of completed questionnaires that failed quality control checks and were excluded from analysis ranged from 0 to 351 (median: 13) across the state surveys and from 0 to 231 (median: 13) across the large urban school district surveys. The student sample sizes ranged from 1,147 to 13,201 (median: 2,170) across the state surveys and from 1,013 to 11,570 (median: 1,767) across the large urban school district surveys (Table 2). Among the state surveys, the school response rates ranged from 73% to 100%; student response rates ranged from 60% to 88%; and overall response rates ranged from 60% to 84%, and among the large urban school district surveys, the school response rates ranged from 84% to 100%; student response rates ranged from 61% to 86%; and overall response rates ranged from 61% to 86% (Table 2).
Race/ethnicity was computed from two questions: 1) "Are you Hispanic or Latino?" (response options were "yes" or "no"), and 2) "What is your race?" (response options were "American Indian or Alaska Native," "Asian," "black or African American," "Native Hawaiian or other Pacific Islander," or "white"). For the second question, students could select more than one response option. For this report, students were classified as "Hispanic/Latino" and were referred to as "Hispanic" if they answered "yes" to the first question, regardless of how they answered the second question. Students who answered, "no" to the first question and selected only "black or African American" to the second question were classified as "black or African American" and are referred to as "black." Students who answered "no" to the first question and selected only "white" to the second question were classified, and were referred to, as "white." Race/ethnicity was classified as missing for students who did not answer the first question and for students who answered "no" to the first question but did not answer the second question.
Students were classified as obese or overweight based on their body mass index (kg/m2) (BMI), which was calculated from self-reported height and weight. The BMI values were compared with sex- and age-specific reference data from the 2000 CDC growth charts (9). Obese was defined as a BMI of ≥95th percentile for age and sex. Overweight was defined as a BMI of ≥85th percentile and <95th percentile for age and sex. These classifications are not intended to diagnose obesity or overweight in individual students, but to provide population-level estimates of obesity and overweight.
Weighting
For the national YRBS, a weight based on student sex, race/ethnicity, and grade was applied to each record to adjust for school and student nonresponse and oversampling of black and Hispanic students. The overall weights were scaled so that the weighted count of students equals the total sample size, and the weighted proportions of students in each grade match the national population proportions. Therefore, weighted estimates are representative of all students in grades 9–12 attending public and private school in the United States.
State and large urban school district surveys that had a representative sample of students, appropriate documentation, and an overall response rate of 60% or higher were weighted. A weight was applied to each record to adjust for student nonresponse and the distribution of students by grade, sex, and race/ethnicity in each jurisdiction. Data from 43 state and 21 large urban school district surveys were weighted. In 41 states and all large urban school districts, weighted estimates are representative of all students in grades 9–12 attending public schools in each jurisdiction. In two states (Ohio and South Dakota), weighted estimates are representative of all students in grades 9–12 attending public and private schools in each jurisdiction.
Analytic Methods
Statistical analyses were conducted on weighted data using SAS (10) and SUDAAN (11) software to account for the complex sampling designs. Prevalence estimates and confidence intervals were computed for all variables and all data sets. In addition, for the national YRBS data, t tests were used to determine pairwise differences between subpopulations (12). Differences between prevalence estimates were considered statistically significant if the t test p value was <0.05 for main effects (sex, race/ethnicity, and grade) and for interactions (sex by race/ethnicity, sex by grade, race/ethnicity by sex, and grade by sex). In the results section, only statistically significant differences in prevalence estimates are reported in the following order: sex, sex by race/ethnicity, sex by grade, race/ethnicity, race/ethnicity by sex, grade, and grade by sex.
To identify long-term temporal changes in health-risk behaviors nationwide, prevalence estimates from the earliest year of data collection to 2011 for each variable assessed with identically worded questions in three or more survey years were examined. Logistic regression analyses were used to account for all available estimates; control for sex, grade, and racial/ethnic changes over time; and simultaneously assess orthogonal linear and quadratic time effects (12). Cubic and other higher order time effects are not reported here. A quadratic time effect indicates a significant but nonlinear trend in prevalence over time. A temporal change that includes a significant linear and quadratic time effect demonstrates nonlinear variation (e.g., leveling off or change in direction) in addition to an overall increase or decrease over time. In this report, if both linear and quadratic time effects are significant only the quadratic time effect is reported. In addition, to identify 2-year temporal changes in health-risk behaviors nationwide, prevalence estimates from 2009 and 2011 were compared using t tests for each variable assessed with identically worded questions in both survey years. Prevalence estimates were considered statistically different if the t test p value was <0.05. In the results section, long-term temporal changes are described first, followed by 2-year (from 2009 to 2011) temporal changes.
Results
Behaviors that Contribute to Unintentional Injuries
Rarely or Never Wore a Bicycle Helmet
Among the 70.2% of students nationwide who had ridden a bicycle during the 12 months before the survey, 87.5% had rarely or never worn a bicycle helmet (Table 3). Overall, the prevalence of having rarely or never worn a bicycle helmet was higher among male (88.8%) than female (85.9%) students; higher among white male (87.1%) and black male (94.4%) than white female (83.9%) and black female (89.4%) students, respectively; and higher among 12th-grade male (92.0%) than 12th-grade female (87.3%) students. Overall, the prevalence of having rarely or never worn a bicycle helmet was higher among black (92.3%) and Hispanic (92.1%) than white (85.7%) students; higher among Hispanic female (92.0%) than white female (83.9%) students; and higher among black male (94.4%) and Hispanic male (92.2%) than white male (87.1%) students. Overall, the prevalence of having rarely or never worn a bicycle helmet was higher among 12th-grade (89.9%) than 9th-grade (86.6%), 10th-grade (86.7%), and 11th-grade (87.7%) students and higher among 12th-grade male (92.0%) than 9th-grade male (87.2%), 10th-grade male (87.9%), and 11th-grade male (89.2%) students. The prevalence of having rarely or never worn a bicycle helmet among students who had ridden a bicycle during the 12 months before the survey ranged from 52.7% to 95.1% across state surveys (median: 87.1%) and from 59.3% to 94.3% across large urban school district surveys (median: 89.7%) (Table 4).
Among students nationwide who had ridden a bicycle, the prevalence of rarely or never wearing a bicycle helmet decreased during 1991–2001 (96.2%–84.7%) and then did not change significantly during 2001–2011 (84.7%–87.5%). The prevalence of rarely or never wearing a bicycle helmet also did not change significantly from 2009 (84.7%) to 2011 (87.5%).
Rarely or Never Wore a Seat Belt
Nationwide, 7.7% of students rarely or never wore a seat belt when riding in a car driven by someone else (Table 3). Overall, the prevalence of rarely or never wearing a seat belt was higher among male (8.9%) than female (6.3%) students; higher among white male (7.3%) and black male (12.6%) than white female (5.1%) and black female (8.0%) students, respectively; and higher among 10th-grade male (9.0%), 11th-grade male (7.0%), and 12th-grade male (8.5%) than 10th-grade female (5.9%), 11th-grade female (4.9%), and 12th-grade female (5.5%) students, respectively. Overall, the prevalence of rarely or never wearing a seat belt was higher among black (10.3%) and Hispanic (9.3%) than white (6.3%) students; higher among black female (8.0%) and Hispanic female (8.4%) than white female (5.1%) students; and higher among black male (12.6%) than white male (7.3%) students. Overall, the prevalence of rarely or never wearing a seat belt was higher among 9th-grade (9.5%) than 10th-grade (7.5%), 11th-grade (6.0%), and 12th-grade (7.1%) students; higher among 10th-grade (7.5%) than 11th-grade (6.0%) students; higher among 9th-grade female (8.4%) than 10th-grade female (5.9%), 11th-grade female (4.9%), and 12th-grade female (5.5%) students; and higher among 9th-grade male (10.3%) than 11th-grade male (7.0%) students. The prevalence of rarely or never wearing a seat belt ranged from 4.4% to 20.1% across state surveys (median: 10.3%) and from 4.1% to 25.8% across large urban school district surveys (median: 10.9%) (Table 4).
During 1991–2011, among students nationwide, a significant linear decrease occurred in the prevalence of rarely or never wearing a seat belt (25.9%–7.7%). The prevalence of rarely or never wearing a seat belt also decreased from 2009 (9.7%) to 2011 (7.7%).
Rode with a Driver Who Had Been Drinking Alcohol
During the 30 days before the survey, 24.1% of students nationwide had ridden one or more times in a car or other vehicle driven by someone who had been drinking alcohol (Table 5). The prevalence of having ridden with a driver who had been drinking alcohol was higher among white female (23.8%) than white male (20.5%) students. Overall, the prevalence of having ridden with a driver who had been drinking alcohol was higher among Hispanic (30.7%) than white (22.1%) and black (22.8%) students; higher among Hispanic female (30.7%) than white female (23.8%) and black female (23.2%) students; and higher among Hispanic male (30.7%) than white male (20.5%) and black male (22.5%) students. Overall, the prevalence of having ridden with a driver who had been drinking alcohol was higher among 12th-grade (27.7%) than 9th-grade (21.8%), 10th-grade (23.3%), and 11th-grade (23.8%) students; higher among 12th-grade female (28.0%) than 9th-grade female (22.9%) and 10th-grade female (23.5%) students; and higher among 12th-grade male (27.4%) than 9th-grade male (20.7%), 10th-grade male (23.1%), and 11th-grade male (22.4%) students. The prevalence of having ridden with a driver who had been drinking alcohol ranged from 13.5% to 32.2% across state surveys (median: 23.2%) and from 17.6% to 34.2% across large urban school district surveys (median: 24.2%) (Table 6).
During 1991–2011, among students nationwide, a significant linear decrease occurred in the prevalence of riding with a driver who had been drinking alcohol (39.9%–24.1%). The prevalence of riding with a driver who had been drinking alcohol also decreased from 2009 (28.3%) to 2011 (24.1%).
Drove When Drinking Alcohol
During the 30 days before the survey, 8.2% of students nationwide had driven a car or other vehicle one or more times when they had been drinking alcohol (Table 5). Overall, the prevalence of having driven when they had been drinking alcohol was higher among male (9.5%) than female (6.7%) students; higher among white male (8.9%), black male (7.8%), and Hispanic male (11.5%) than white female (7.0%), black female (4.0%), and Hispanic female (7.8%) students, respectively; and higher among 9th-grade male (6.1%), 11th-grade male (10.4%), and 12th-grade male (16.0%) than 9th-grade female (3.3%), 11th-grade female (7.8%), and 12th-grade female (11.2%) students, respectively. Overall, the prevalence of having driven when they had been drinking alcohol was higher among white (8.0%) than black (5.9%) students; higher among Hispanic (9.7%) than white (8.0%) and black (5.9%) students; higher among white female (7.0%) and Hispanic female (7.8%) than black female (4.0%) students; and higher among Hispanic male (11.5%) than white male (8.9%) and black male (7.8%) students. Overall, the prevalence of having driven when they had been drinking alcohol was higher among 11th-grade (9.1%) and 12th-grade (13.6%) than 9th-grade (4.7%) and 10th-grade (5.6%) students; higher among 12th-grade (13.6%) than 11th-grade (9.1%) students; higher among 10th-grade female (5.2%), 11th-grade female (7.8%), and 12th-grade female (11.2%) than 9th-grade female (3.3%) students; higher among 11th-grade female (7.8%) and 12th-grade female (11.2%) than 10th-grade female (5.2%) students; higher among 12th-grade female (11.2%) than 11th-grade female (7.8%) students; higher among 11th-grade male (10.4%) and 12th-grade male (16.0%) than 9th-grade male (6.1%) and 10th-grade male (6.0%) students; and higher among 12th-grade male (16.0%) than 11th-grade male (10.4%) students. The prevalence of having driven a car when they had been drinking alcohol ranged from 4.0% to 11.7% across state surveys (median: 7.7%) and from 2.9% to 11.9% across large urban school district surveys (median: 6.8%) (Table 6).
Among students nationwide, the prevalence of having driven a car when they had been drinking alcohol did not change significantly during 1991–1997 (16.7%–16.9%) and then decreased during 1997–2011 (16.9%–8.2%). The prevalence of having driven a car when they had been drinking alcohol also decreased from 2009 (9.7%) to 2011 (8.2%).
Texted or E-mailed While Driving
Nationwide, 32.8% of students had texted or e-mailed while driving a car or other vehicle on at least 1 day during the 30 days before the survey (Table 7). Overall, the prevalence of having texted or e-mailed while driving was higher among male (34.9%) than female (30.4%) students; higher among black male (29.3%) and Hispanic male (35.2%) than black female (19.0%) and Hispanic female (26.3%) students, respectively; and higher among 9th-grade male (13.9%) and 10th-grade male (25.6%) than 9th-grade female (9.4%) and 10th-grade female (20.6%) students, respectively. Overall, the prevalence of having texted or e-mailed while driving was higher among white (36.2%) than black (24.1%) and Hispanic (30.9%) students; higher among Hispanic (30.9%) than black (24.1%) students; higher among white female (35.4%) than black female (19.0%) and Hispanic female (26.3%) students; higher among Hispanic female (26.3%) than black female (19.0%) students; and higher among white male (36.9%) and Hispanic male (35.2%) than black male (29.3%) students. Overall, the prevalence of having texted or e-mailed while driving was higher among 10th-grade (23.2%), 11th-grade (42.9%), and 12th-grade (58.0%) than 9th-grade (11.7%) students; higher among 11th-grade (42.9%) and 12th-grade (58.0%) than 10th-grade (23.2%) students; higher among 12th-grade (58.0%) than 11th-grade (42.9%) students; higher among 10th-grade female (20.6%), 11th-grade female (40.6%), and 12th-grade female (55.9%) than 9th-grade female (9.4%) students; higher among 11th-grade female (40.6%) and 12th-grade female (55.9%) than 10th-grade female (20.6%) students; higher among 12th-grade female (55.9%) than 11th-grade female (40.6%) students; higher among 10th-grade male (25.6%), 11th-grade male (45.0%), and 12th-grade male (60.0%) than 9th-grade male (13.9%) students; higher among 11th-grade male (45.0%) and 12th-grade male (60.0%) than 10th-grade male (25.6%) students; and higher among 12th-grade male (60.0%) than 11th-grade male (45.0%) students.
Behaviors that Contribute to Violence
Carried a Weapon
Nationwide, 16.6% of students had carried a weapon (e.g., a gun, knife, or club) on at least 1 day during the 30 days before the survey (Table 8). Overall, the prevalence of having carried a weapon was higher among male (25.9%) than female (6.8%) students; higher among white male (27.2%), black male (21.0%), and Hispanic male (24.5%) than white female (6.2%), black female (7.5%), and Hispanic female (7.5%) students, respectively; and higher among 9th-grade male (26.6%), 10th-grade male (26.4%), 11th-grade male (25.9%), and 12th-grade male (24.1%) than 9th-grade female (7.6%), 10th-grade female (6.1%), 11th-grade female (6.2%), and 12th-grade female (7.1%) students, respectively. The prevalence of having carried a weapon was higher among white male (27.2%) and Hispanic male (24.5%) than black male (21.0%) students. The prevalence of having carried a weapon ranged from 9.6% to 27.1% across state surveys (median: 17.6%) and from 9.1% to 18.9% across large urban school district surveys (median: 13.8%) (Table 9).
Among students nationwide, the prevalence of having carried a weapon decreased during 1991–1999 (26.1%–17.3%) and then did not change significantly during 1999–2011 (17.3%–16.6%). The prevalence of having carried a weapon also did not change significantly from 2009 (17.5%) to 2011 (16.6%).
Carried a Gun
Nationwide, 5.1% of students had carried a gun on at least 1 day during the 30 days before the survey (Table 8). Overall, the prevalence of having carried a gun was higher among male (8.6%) than female (1.4%) students; higher among white male (7.2%), black male (10.3%), and Hispanic male (9.2%) than white female (1.1%), black female (1.7%), and Hispanic female (1.4%) students, respectively; and higher among 9th-grade male (7.7%), 10th-grade male (9.4%), 11th-grade male (8.6%), and 12th-grade male (8.2%) than 9th-grade female (1.4%), 10th-grade female (1.6%), 11th-grade female (1.1%), and 12th-grade female (1.0%) students, respectively. Overall, the prevalence of having carried a gun was higher among black (6.1%) than white (4.3%) students and higher among black male (10.3%) than white male (7.2%) students. The prevalence of having carried a gun ranged from 2.5% to 10.8% across state surveys (median: 6.0%) and from 2.3% to 7.5% across large urban school district surveys (median: 5.0%) (Table 9).
Among students nationwide, the prevalence of having carried a gun decreased during 1993–1999 (7.9%–4.9%) and then did not change significantly during 1999–2011 (4.9%–5.1%). The prevalence of having carried a gun also did not change significantly from 2009 (5.9%) to 2011 (5.1%).
Carried a Weapon on School Property
Nationwide, 5.4% of students had carried a weapon (e.g., a gun, knife, or club) on school property on at least 1 day during the 30 days before the survey (Table 10). Overall, the prevalence of having carried a weapon on school property was higher among male (8.2%) than female (2.3%) students; higher among white male (7.8%), black male (6.7%), and Hispanic male (8.8%) than white female (2.3%), black female (2.5%), and Hispanic female (2.6%) students, respectively; and higher among 9th-grade male (7.4%), 10th-grade male (9.4%), 11th-grade male (7.5%), and 12th-grade male (8.2%) than 9th-grade female (2.1%), 10th-grade female (2.5%), 11th-grade female (1.8%), and 12th-grade female (2.8%) students, respectively. The prevalence of having carried a weapon on school property ranged from 3.1% to 10.5% across state surveys (median: 5.7%) and from 2.1% to 8.1% across large urban school district surveys (median: 4.5%) (Table 11).
Among students nationwide, the prevalence of having carried a weapon on school property decreased during 1993–2003 (11.8%–6.1%) and then did not change significantly during 2003–2011 (6.1%–5.4%). The prevalence of having carried a weapon on school property also did not change significantly from 2009 (5.6%) to 2011 (5.4%).
Threatened or Injured with a Weapon on School Property
During the 12 months before the survey, 7.4% of students nationwide had been threatened or injured with a weapon (e.g., a gun, knife, or club) on school property one or more times (Table 10). Overall, the prevalence of having been threatened or injured with a weapon on school property was higher among male (9.5%) than female (5.2%) students; higher among white male (8.0%), black male (11.2%), and Hispanic male (12.1%) than white female (4.2%), black female (6.6%), and Hispanic female (6.0%) students, respectively; and higher among 9th-grade male (10.3%), 10th-grade male (9.7%), 11th-grade male (9.2%), and 12th-grade male (8.3%) than 9th-grade female (6.2%), 10th-grade female (5.3%), 11th-grade female (5.3%), and 12th-grade female (3.4%) students, respectively. Overall, the prevalence of having been threatened or injured with a weapon on school property was higher among black (8.9%) and Hispanic (9.2%) than white (6.1%) students; higher among black female (6.6%) and Hispanic female (6.0%) than white female (4.2%) students; and higher among black male (11.2%) and Hispanic male (12.1%) than white male (8.0%) students. Overall, the prevalence of having been threatened or injured with a weapon on school property was higher among 9th-grade (8.3%) and 10th-grade (7.7%) than 12th-grade (5.9%) students and higher among 9th-grade female (6.2%), 10th-grade female (5.3%), and 11th-grade female (5.3%) than 12th-grade female (3.4%) students. The prevalence of having been threatened or injured with a weapon on school property ranged from 5.1% to 11.7% across state surveys (median: 6.8%) and from 6.7% to 11.1% across large urban school district surveys (median: 8.2%) (Table 11).
Among students nationwide, the prevalence of having been threatened or injured with a weapon on school property did not change significantly during 1993–2003 (7.3%–9.2%) and then decreased during 2003–2011 (9.2%–7.4%). The prevalence of having been threatened or injured with a weapon on school property did not change significantly from 2009 (7.7%) to 2011 (7.4%).
In a Physical Fight
Nationwide, 32.8% of students had been in a physical fight one or more times during the 12 months before the survey (Table 12). Overall, the prevalence of having been in a physical fight was higher among male (40.7%) than female (24.4%) students; higher among white male (37.7%), black male (45.8%), and Hispanic male (44.4%) than white female (20.4%), black female (32.3%), and Hispanic female (28.7%) students, respectively; and higher among 9th-grade male (46.0%), 10th-grade male (44.2%), 11th-grade male (36.3%), and 12th-grade male (34.1%) than 9th-grade female (28.8%), 10th-grade female (25.5%), 11th-grade female (22.7%), and 12th-grade female (19.4%) students, respectively. Overall, the prevalence of having been in a physical fight was higher among black (39.1%) and Hispanic (36.8%) than white (29.4%) students; higher among black female (32.3%) and Hispanic female (28.7%) than white female (20.4%) students; higher among black female (32.3%) than Hispanic female (28.7%) students; and higher among black male (45.8%) and Hispanic male (44.4%) than white male (37.7%) students. Overall, the prevalence of having been in a physical fight was higher among 9th-grade (37.7%) and 10th-grade (35.3%) than 11th-grade (29.7%) and 12th-grade (26.9%) students; higher among 9th-grade female (28.8%) than 11th-grade female (22.7%) and 12th-grade female (19.4%) students; higher among 10th-grade female (25.5%) than 12th-grade female (19.4%) students; and higher among 9th-grade male (46.0%) and 10th-grade male (44.2%) than 11th-grade male (36.3%) and 12th-grade male (34.1%) students. The prevalence of having been in a physical fight ranged from 19.5% to 36.0% across state surveys (median: 26.8%) and from 18.7% to 42.2% across large urban school district surveys (median: 31.9%) (Table 13).
Among students nationwide, the prevalence of having been in a physical fight decreased during 1991–2009 (42.5%–31.5%), and then did not change significantly during 2009–2011 (31.5%–32.8%).
Injured in a Physical Fight
During the 12 months before the survey, 3.9% of students nationwide had been in a physical fight one or more times in which they were injured and had to be treated by a doctor or nurse (Table 12). Overall, the prevalence of having been injured in a physical fight was higher among male (5.1%) than female (2.6%) students; higher among white male (3.5%), black male (8.1%), and Hispanic male (7.0%) than white female (1.9%), black female (3.2%), and Hispanic female (3.7%) students, respectively; and higher among 9th-grade male (5.9%), 10th-grade male (5.1%), 11th-grade male (4.8%), and 12th-grade male (4.3%) than 9th-grade female (2.7%), 10th-grade female (3.0%), 11th-grade female (2.2%), and 12th-grade female (2.1%) students, respectively. Overall, the prevalence of having been injured in a physical fight was higher among black (5.7%) and Hispanic (5.5%) than white (2.8%) students; higher among black female (3.2%) and Hispanic female (3.7%) than white female (1.9%) students; and higher among black male (8.1%) and Hispanic male (7.0%) than white male (3.5%) students. The prevalence of having been injured in a physical fight was higher among 9th-grade male (5.9%) than 12th-grade male (4.3%) students. The prevalence of having been injured in a physical fight ranged from 2.1% to 5.2% across state surveys (median: 3.5%) and from 3.5% to 7.2% across large urban school district surveys (median: 4.4%) (Table 13).
During 1991–2011, among students nationwide, a significant linear decrease occurred in the prevalence of having been injured in a physical fight (4.4%–3.9%). The prevalence of having been injured in a physical fight did not change significantly from 2009 (3.8%) to 2011 (3.9%).
In a Physical Fight on School Property
Nationwide, 12.0% of students had been in a physical fight on school property one or more times during the 12 months before the survey (Table 14). Overall, the prevalence of having been in a physical fight on school property was higher among male (16.0%) than female (7.8%) students; higher among white male (13.8%), black male (19.6%), and Hispanic male (19.4%) than white female (5.6%), black female (13.1%), and Hispanic female (9.0%) students, respectively; and higher among 9th-grade male (21.7%), 10th-grade male (17.0%), 11th-grade male (12.3%), and 12th-grade male (11.4%) than 9th-grade female (10.4%), 10th-grade female (8.0%), 11th-grade female (6.0%), and 12th-grade female (6.1%) students, respectively. Overall, the prevalence of having been in a physical fight on school property was higher among black (16.4%) and Hispanic (14.4%) than white (9.9%) students; higher among black female (13.1%) and Hispanic female (9.0%) than white female (5.6%) students; higher among black female (13.1%) than Hispanic female (9.0%) students; and higher among black male (19.6%) and Hispanic male (19.4%) than white male (13.8%) students. Overall, the prevalence of having been in a physical fight on school property was higher among 9th-grade (16.2%) than 10th-grade (12.8%), 11th-grade (9.2%), and 12th-grade (8.8%) students; higher among 10th-grade (12.8%) than 11th-grade (9.2%) and 12th-grade (8.8%) students; higher among 9th-grade female (10.4%) than 11th-grade female (6.0%) and 12th-grade female (6.1%) students; higher among 9th-grade male (21.7%) than 10th-grade male (17.0%), 11th-grade male (12.3%), and 12th-grade male (11.4%) students; and higher among 10th-grade male (17.0%) than 11th-grade male (12.3%) and 12th-grade male (11.4%) students. The prevalence of having been in a physical fight on school property ranged from 7.1% to 15.7% across state surveys (median: 9.4%) and from 7.6% to 18.9% across large urban school district surveys (median: 13.2%) (Table 15).
Among students nationwide, the prevalence of having been in a physical fight on school property decreased during 1993–2009 (16.2%–11.1%) and then did not change significantly during 2009–2011 (11.1%–12.0%).
Bullied on School Property
Nationwide, 20.1% of students had been bullied on school property during the 12 months before the survey (Table 14). Overall, the prevalence of having been bullied on school property was higher among female (22.0%) than male (18.2%) students; higher among white female (25.2%) than white male (20.7%) students; and higher among 9th-grade female (27.1%), 10th-grade female (24.6%), and 12th-grade female (17.2%) than 9th-grade male (21.5%), 10th-grade male (20.4%), and 12th-grade male (13.4%) students, respectively. Overall, the prevalence of having been bullied on school property was higher among white (22.9%) than black (11.7%) and Hispanic (17.6%) students; higher among Hispanic (17.6%) than black (11.7%) students; higher among white female (25.2%) than black female (12.2%) and Hispanic female (19.3%) students; higher among Hispanic female (19.3%) than black female (12.2%) students; higher among white male (20.7%) than black male (11.1%) and Hispanic male (16.0%) students; and higher among Hispanic male (16.0%) than black male (11.1%) students. Overall, the prevalence of having been bullied on school property was higher among 9th-grade (24.2%) and 10th-grade (22.4%) than 11th-grade (17.1%) and 12th-grade (15.2%) students; higher among 9th-grade female (27.1%) and 10th-grade female (24.6%) than 11th-grade female (17.5%) and 12th-grade female (17.2%) students; higher among 9th-grade male (21.5%) than 11th-grade male (16.7%) and 12th-grade male (13.4%) students; and higher among 10th-grade male (20.4%) and 11th-grade male (16.7%) than 12th-grade male (13.4%) students. The prevalence of having been bullied on school property ranged from 14.0% to 26.7% across state surveys (median: 20.3%) and from 9.7% to 19.5% across large urban school district surveys (median: 13.8%) (Table 15).
The prevalence of having been bullied on school property did not change significantly from 2009 (19.9%) to 2011 (20.1%).
Electronically Bullied
Nationwide, 16.2% of students had been electronically bullied, including being bullied through e-mail, chat rooms, instant messaging, websites, or texting, during the 12 months before the survey (Table 16). Overall, the prevalence of having been electronically bullied was higher among female (22.1%) than male (10.8%) students; higher among white female (25.9%), black female (11.0%), and Hispanic female (18.0%) than white male (11.8%), black male (6.9%), and Hispanic male (9.5%) students, respectively; and higher among 9th-grade female (22.6%), 10th-grade female (24.2%), 11th-grade female (19.8%), and 12th-grade female (21.5%) than 9th-grade male (8.9%), 10th-grade male (12.6%), 11th-grade male (12.4%), and 12th-grade male (8.8%) students, respectively. Overall, the prevalence of having been electronically bullied was higher among white (18.6%) than black (8.9%) and Hispanic (13.6%) students; higher among Hispanic (13.6%) than black (8.9%) students; higher among white female (25.9%) than black female (11.0%) and Hispanic female (18.0%) students; higher among Hispanic female (18.0%) than black female (11.0%) students; and higher among white male (11.8%) and Hispanic male (9.5%) than black male (6.9%) students. Overall, the prevalence of having been electronically bullied was higher among 10th-grade (18.1%) than 9th-grade (15.5%) and 12th-grade (15.0%) students; higher among 10th-grade female (24.2%) than 11th-grade female (19.8%) students; and higher among 10th-grade male (12.6%) and 11th-grade male (12.4%) than 9th-grade male (8.9%) students. The prevalence of having been electronically bullied ranged from 12.3% to 21.6% across state surveys (median: 15.6%) and from 8.2% to 16.1% across large urban school district surveys (median: 11.0%) (Table 17).
Did Not Go to School Because of Safety Concerns
Nationwide, 5.9% of students had not gone to school on at least 1 day during the 30 days before the survey because they felt they would be unsafe at school or on their way to or from school (Table 16). The prevalence of having not gone to school because of safety concerns was higher among black male (8.0%) than black female (5.3%) students. Overall, the prevalence of having not gone to school because of safety concerns was higher among black (6.7%) and Hispanic (9.1%) than white (4.4%) students; higher among Hispanic (9.1%) than black (6.7%) students; higher among Hispanic female (9.6%) than white female (4.7%) and black female (5.3%) students; and higher among black male (8.0%) and Hispanic male (8.5%) than white male (4.0%) students. Overall, the prevalence of having not gone to school because of safety concerns was higher among 10th-grade (6.8%) than 11th-grade (5.2%) students and higher among 10th-grade female (7.1%) than 11th-grade female (5.1%) students. The prevalence of having not gone to school because of safety concerns ranged from 3.4% to 9.0% across state surveys (median: 5.2%) and from 5.1% to 20.9% across large urban school district surveys (median: 8.2%) (Table 17).
Among students nationwide, the prevalence of having not gone to school because of safety concerns did not change significantly during 1993–2011 (4.4%–5.9%). The prevalence of having not gone to school because of safety concerns also did not change significantly from 2009 (5.0%) to 2011 (5.9%).
Had Property Stolen or Damaged on School Property
Nationwide, 26.1% of students had had their property (e.g., car, clothing or books) stolen or deliberately damaged on school property one or more times during the 12 months before the survey (Table 18). Overall, the prevalence of having property stolen or damaged on school property was higher among male (28.8%) than female (23.4%) students; higher among white male (26.8%) and Hispanic male (33.3%) than white female (21.0%) and Hispanic female (27.8%) students, respectively; and higher among 11th-grade male (26.7%) and 12th-grade male (26.9%) than 11th-grade female (20.1%) and 12th-grade female (19.5%) students, respectively. Overall, the prevalence of having property stolen or damaged on school property was higher among black (27.3%) and Hispanic (30.7%) than white (24.0%) students; higher among Hispanic (30.7%) than black (27.3%) students; higher among Hispanic female (27.8%) than white female (21.0%) students; and higher among Hispanic male (33.3%) than white male (26.8%) and black male (28.7%) students. Overall, the prevalence of having property stolen or damaged on school property was higher among 10th-grade (30.6%) than 9th-grade (26.6%) students; higher among 9th-grade (26.6%) and 10th-grade (30.6%) than 11th-grade (23.5%) and 12th-grade (23.3%) students; higher among 9th-grade female (25.5%) and 10th-grade female (27.4%) than 11th-grade female (20.1%) and 12th-grade female (19.5%) students; and higher among 10th-grade male (33.4%) than 11th-grade male (26.7%) and 12th-grade male (26.9%) students.
During 2003–2011, among students nationwide, a significant linear decrease occurred in the prevalence of having property stolen or damaged on school property (29.8%–26.2%).
Dating Violence
During the 12 months before the survey, 9.4% of students nationwide had been hit, slapped, or physically hurt on purpose by their boyfriend or girlfriend (i.e., dating violence) (Table 19). Overall, the prevalence of dating violence was higher among black (12.2%) and Hispanic (11.4%) than white (7.6%) students; higher among black female (11.8%) and Hispanic female (10.6%) than white female (7.7%) students; and higher among black male (12.4%) and Hispanic male (12.1%) than white male (7.4%) students. Overall, the prevalence of dating violence was higher among 10th-grade (9.6%), 11th-grade (10.3%), and 12th-grade (10.3%) than 9th-grade (7.5%) students; higher among 10th-grade female (9.8%) and 12th-grade female (10.7%) than 9th-grade female (7.6%) students; and higher among 11th-grade male (11.2%) and 12th-grade male (10.0%) than 9th-grade male (7.4%) students. The prevalence of dating violence ranged from 6.5% to 16.1% across state surveys (median: 11.0%) and from 7.6% to 24.2% across large urban school district surveys (median: 11.6%) (Table 20).
Among students nationwide, the prevalence of dating violence did not change significantly during 1999–2011 (8.8%–9.4%) or from 2009 (9.8%) to 2011 (9.4%).
Forced to Have Sexual Intercourse
Nationwide, 8.0% of students had ever been physically forced to have sexual intercourse when they did not want to (Table 19). Overall, the prevalence of having been forced to have sexual intercourse was higher among female (11.8%) than male (4.5%) students; higher among white female (12.0%), black female (11.0%), and Hispanic female (11.2%) than white male (3.2%), black male (6.1%), and Hispanic male (5.4%) students, respectively; and higher among 9th-grade female (8.2%), 10th-grade female (12.2%), 11th-grade female (12.7%), and 12th-grade female (14.5%) than 9th-grade male (3.5%), 10th-grade male (4.2%), 11th-grade male (5.2%), and 12th-grade male (4.7%) students, respectively. The prevalence of having been forced to have sexual intercourse was higher among black male (6.1%) and Hispanic male (5.4%) than white male (3.2%) students. Overall, the prevalence of having been forced to have sexual intercourse was higher among 10th-grade (8.0%), 11th-grade (8.8%), and 12th-grade (9.5%) than 9th-grade (5.8%) students; higher among 10th-grade female (12.2%), 11th-grade female (12.7%), and 12th-grade female (14.5%) than 9th-grade female (8.2%) students; and higher among 11th-grade male (5.2%) than 9th-grade male (3.5%) students. The prevalence of having been forced to have sexual intercourse ranged from 5.6% to 12.2% across state surveys (median: 8.4%) and from 6.5% to 12.6% across large urban school district surveys (median: 8.1%) (Table 20).
Among students nationwide, the prevalence of having been forced to have sexual intercourse did not change significantly during 2001–2011 (7.7%–8.0%) or from 2009 (7.4%) to 2011 (8.0%).
Felt Sad or Hopeless
During the 12 months before the survey, 28.5% of students nationwide had felt so sad or hopeless almost every day for 2 or more weeks in a row that they stopped doing some usual activities (Table 21). Overall, the prevalence of having felt sad or hopeless almost every day for 2 or more weeks in a row was higher among female (35.9%) than male (21.5%) students; higher among white female (34.3%), black female (31.4%), and Hispanic female (41.4%) than white male (20.7%), black male (18.0%), and Hispanic male (24.4%) students, respectively; and higher among 9th-grade female (37.4%), 10th-grade female (37.2%), 11th-grade female (34.3%), and 12th-grade female (34.4%) than 9th-grade male (18.2%), 10th-grade male (21.1%), 11th-grade male (23.6%), and 12th-grade male (23.6%) students, respectively. Overall, the prevalence of having felt sad or hopeless almost every day for 2 or more weeks in a row was higher among Hispanic (32.6%) than white (27.2%) and black (24.7%) students; higher among Hispanic female (41.4%) than white female (34.3%) and black female (31.4%) students; and higher among Hispanic male (24.4%) than black male (18.0%) students. The prevalence of having felt sad or hopeless almost every day for 2 or more weeks in a row was higher among 11th-grade male (23.6%) and 12th-grade male (23.6%) than 9th-grade male (18.2%) students. The prevalence of having felt sad or hopeless almost every day for 2 or more weeks in a row ranged from 19.2% to 33.6% across state surveys (median: 25.8%) and from 21.7% to 32.8% across large urban school district surveys (median: 27.6%) (Table 22).
During 1999–2011, among students nationwide, the prevalence of having felt sad or hopeless almost every day for 2 or more weeks in a row did not change significantly (28.3%–28.5%). The prevalence of having felt sad or hopeless almost every day for 2 or more weeks in a row increased from 2009 (26.1%) to 2011 (28.5%).
Seriously Considered Attempting Suicide
Nationwide, 15.8% of students had seriously considered attempting suicide during the 12 months before the survey (Table 23). Overall, the prevalence of having seriously considered attempting suicide was higher among female (19.3%) than male (12.5%) students; higher among white female (18.4%), black female (17.4%), and Hispanic female (21.0%) than white male (12.8%), black male (9.0%), and Hispanic male (12.6%) students, respectively; and higher among 9th-grade female (21.5%), 10th-grade female (22.3%), and 12th-grade female (15.8%) than 9th-grade male (12.9%), 10th-grade male (11.4%), and 12th-grade male (11.5%) students, respectively. Overall, the prevalence of having seriously considered attempting suicide was higher among white (15.5%) and Hispanic (16.7%) than black (13.2%) students; higher among Hispanic female (21.0%) than black female (17.4%) students; and higher among white male (12.8%) and Hispanic male (12.6%) than black male (9.0%) students. Overall, the prevalence of having seriously considered attempting suicide was higher among 9th-grade (17.1%) and 10th-grade (16.5%) than 12th-grade (13.6%) students and higher among 9th-grade female (21.5%) and 10th-grade female (22.3%) than 11th-grade female (16.7%) and 12th-grade female (15.8%) students. The prevalence of having seriously considered attempting suicide ranged from 11.4% to 18.9% across state surveys (median: 14.6%) and from 10.7% to 15.7% across large urban school district surveys (median: 13.2%) (Table 24).
Among students nationwide, the prevalence of having seriously considered attempting suicide decreased during 1991–2009 (29.0%–13.8%) and then increased during 2009 –2011(13.8%–15.8%).
Made a Suicide Plan
During the 12 months before the survey, 12.8% of students nationwide had made a plan about how they would attempt suicide (Table 23). Overall, the prevalence of having made a suicide plan was higher among female (15.0%) than male (10.8%) students; higher among white female (13.7%), black female (13.9%), and Hispanic female (17.6%) than white male (10.6%), black male (8.4%), and Hispanic male (11.1%) students, respectively; and higher among 9th-grade female (16.9%), 10th-grade female (17.9%), and 12th-grade female (12.0%) than 9th-grade male (10.4%), 10th-grade male (11.3%), and 12th-grade male (9.5%) students, respectively. Overall, the prevalence of having made a suicide plan was higher among Hispanic (14.3%) than white (12.1%) and black (11.1%) students and higher among Hispanic female (17.6%) than white female (13.7%) and black female (13.9%) students. Overall, the prevalence of having made a suicide plan was higher among 9th-grade (13.6%) and 10th-grade (14.4%) than 12th-grade (10.7%) students; higher among 10th-grade (14.4%) than 11th-grade (11.9%) students; and higher among 9th-grade female (16.9%) and 10th-grade female (17.9%) than 11th-grade female (12.3%) and 12th-grade female (12.0%) students. The prevalence of having made a suicide plan ranged from 8.4% to 16.3% across state surveys (median: 12.3%) and from 8.6% to 14.9% across large urban school district surveys (median: 11.4%) (Table 24).
During 1991–2011, among students nationwide, a significant linear decrease occurred in the prevalence of having made a suicide plan (18.6%–12.8%). The prevalence of having made a suicide plan increased from 2009 (10.9%) to 2011 (12.8%).
Attempted Suicide
Nationwide, 7.8% of students had attempted suicide one or more times during the 12 months before the survey (Table 25). Overall, the prevalence of having attempted suicide was higher among female (9.8%) than male (5.8%) students; higher among white female (7.9%) and Hispanic female (13.5%) than white male (4.6%) and Hispanic male (6.9%) students, respectively; and higher among 9th-grade female (11.8%), 10th-grade female (11.6%), and 12th-grade female (7.7%) than 9th-grade male (6.8%), 10th-grade male (5.1%), and 12th-grade male (5.0%) students, respectively. Overall, the prevalence of having attempted suicide was higher among black (8.3%) and Hispanic (10.2%) than white (6.2%) students; higher among Hispanic female (13.5%) than white female (7.9%) and black female (8.8%) students; and higher among black male (7.7%) and Hispanic male (6.9%) than white male (4.6%) students. Overall, the prevalence of having attempted suicide was higher among 9th-grade (9.3%) and 10th-grade (8.2%) than 11th-grade (6.6%) and 12th-grade (6.3%) students and higher among 9th-grade female (11.8%) and 10th-grade female (11.6%) than 11th-grade female (7.4%) and 12th-grade female (7.7%) students. The prevalence of having attempted suicide ranged from 3.6% to 11.3% across state surveys (median: 7.8%) and from 6.0% to 15.8% across large urban school district surveys (median: 9.2%) (Table 26).
Among students nationwide, the prevalence of having attempted suicide did not change significantly during 1991–2001 (7.3%–8.8%) and then decreased during 2001–2011 (8.8%–7.8%). The prevalence of having attempted suicide increased from 2009 (6.3%) to 2011 (7.8%).
Suicide Attempt Treated by a Doctor or Nurse
During the 12 months before the survey, 2.4% of students nationwide had made a suicide attempt that resulted in an injury, poisoning, or overdose that had to be treated by a doctor or nurse (Table 25). Overall, the prevalence of having made a suicide attempt that resulted in an injury, poisoning, or overdose that had to be treated by a doctor or nurse was higher among female (2.9%) than male (1.9%) students; higher among white female (2.2%) and Hispanic female (4.1%) than white male (1.5%) and Hispanic male (2.2%) students, respectively; and higher among 9th-grade female (3.7%) and 10th-grade female (3.4%) than 9th-grade male (2.0%) and 10th-grade male (1.8%) students, respectively. Overall, the prevalence of having made a suicide attempt that resulted in an injury, poisoning, or overdose that had to be treated by a doctor or nurse was higher among Hispanic (3.2%) than white (1.9%) students and higher among Hispanic female (4.1%) than white female (2.2%) and black female (2.4%) students. Overall, the prevalence of having made a suicide attempt that resulted in an injury, poisoning, or overdose that had to be treated by a doctor or nurse was higher among 9th-grade (2.8%) than 11th-grade (1.9%) and 12th-grade (2.0%) students; higher among 10th-grade (2.6%) than 11th-grade (1.9%) students; higher among 9th-grade female (3.7%) than 11th-grade female (2.0%) and 12th-grade female (2.3%) students; and higher among 10th-grade female (3.4%) than 11th-grade female (2.0%) students. The prevalence of having made a suicide attempt that resulted in an injury, poisoning, or overdose that had to be treated by a doctor or nurse ranged from 1.1% to 5.4% across state surveys (median: 2.7%) and from 1.6% to 5.6% across large urban school district surveys (median: 3.4%) (Table 26).
Among students nationwide, the prevalence of having made a suicide attempt that resulted in an injury, poisoning, or overdose that had to be treated by a doctor or nurse increased during 1991–1995 (1.7%–2.8%) and then decreased during 1995–2011 (2.8%–2.4%). The prevalence of having made a suicide attempt that resulted in an injury, poisoning, or overdose that had to be treated by a doctor or nurse did not change significantly from 2009 (1.9%) to 2011 (2.4%).
Tobacco Use
Ever Smoked Cigarettes
Nationwide, 44.7% of students had ever tried cigarette smoking (even one or two puffs) (i.e., ever smoked cigarettes) (Table 27). Overall, the prevalence of having ever smoked cigarettes was higher among male (46.3%) than female (42.9%) students; higher among Hispanic male (51.5%) than Hispanic female (45.5%) students; and higher among 11th-grade male (50.2%) than 11th-grade female (43.9%) students. Overall, the prevalence of having ever smoked cigarettes was higher among white (44.2%) and Hispanic (48.6%) than black (39.1%) students; higher among Hispanic female (45.5%) than black female (38.0%) students; higher among white male (45.6%) than black male (40.0%) students; and higher among Hispanic male (51.5%) than white male (45.6%) and black male (40.0%) students. Overall, the prevalence of having ever smoked cigarettes was higher among 11th-grade (47.1%) and 12th-grade (54.5%) than 9th-grade (37.6%) and 10th-grade (41.0%) students; higher among 12th-grade (54.5%) than 11th-grade (47.1%) students; higher among 10th-grade female (40.8%), 11th-grade female (43.9%), and 12th-grade female (53.6%) than 9th-grade female (35.0%) students; higher among 12th-grade female (53.6%) than 10th-grade female (40.8%) and 11th-grade female (43.9%) students; and higher among 11th-grade male (50.2%) and 12th-grade male (55.3%) than 9th-grade male (40.0%) and 10th-grade male (41.1%) students. The prevalence of having ever smoked cigarettes ranged from 23.1% to 59.5% across state surveys (median: 46.4%) and from 28.9% to 51.1% across large urban school district surveys (median: 41.0%) (Table 28).
Among students nationwide, the prevalence of having ever smoked cigarettes did not change significantly during 1991–1999 (70.1%–70.4%) and then decreased during 1999–2011 (70.4%–44.7%). The prevalence of having ever smoked cigarettes did not change significantly from 2009 (46.3%) to 2011 (44.7%).
Ever Smoked Cigarettes Daily
Nationwide, 10.2% of students had ever smoked at least one cigarette every day for 30 days (i.e., ever smoked cigarettes daily) (Table 27). Overall, the prevalence of having ever smoked cigarettes daily was higher among male (11.0%) than female (9.2%) students; higher among Hispanic male (9.0%) than Hispanic female (6.4%) students; and higher among 9th-grade male (6.8%) than 9th-grade female (5.0%) students. Overall, the prevalence of having ever smoked cigarettes daily was higher among white (12.0%) than black (5.3%) and Hispanic (7.8%) students; higher among Hispanic (7.8%) than black (5.3%) students; higher among white female (11.4%) than black female (4.3%) and Hispanic female (6.4%) students; higher among white male (12.5%) than black male (6.3%) and Hispanic male (9.0%) students; and higher among Hispanic male (9.0%) than black male (6.3%) students. Overall, the prevalence of having ever smoked cigarettes daily was higher among 10th-grade (8.4%), 11th-grade (11.1%), and 12th-grade (15.7%) than 9th-grade (6.0%) students; higher among 11th-grade (11.1%) and 12th-grade (15.7%) than 10th-grade (8.4%) students; higher among 12th-grade (15.7%) than 11th-grade (11.1%) students; higher among 10th-grade female (8.6%), 11th-grade female (9.7%), and 12th-grade female (14.1%) than 9th-grade female (5.0%) students; higher among 12th-grade female (14.1%) than 10th-grade female (8.6%) and 11th-grade female (9.7%) students; higher among 11th-grade male (12.3%) and 12th-grade male (17.3%) than 9th-grade male (6.8%) and 10th-grade male (8.3%) students; and higher among 12th-grade male (17.3%) than 11th-grade male (12.3%) students. The prevalence of having ever smoked cigarettes daily ranged from 4.2% to 19.4% across state surveys (median: 10.5%) and from 3.0% to 8.1% across large urban school district surveys (median: 6.0%) (Table 28).
During 2001–2011, among students nationwide, a significant linear decrease occurred in the prevalence of having ever smoked cigarettes daily (20.0%–10.2%). The prevalence of having ever smoked cigarettes daily did not change significantly from 2009 (11.2%) to 2011 (10.2%).
Smoked a Whole Cigarette Before Age 13 Years
Nationwide, 10.3% of students had smoked a whole cigarette for the first time before age 13 years (Table 29). Overall, the prevalence of having smoked a whole cigarette before age 13 years was higher among male (12.0%) than female (8.4%) students; higher among white male (11.2%), black male (11.1%), and Hispanic male (14.7%) than white female (8.4%), black female (6.6%), and Hispanic female (8.7%) students, respectively; and higher among 9th-grade male (14.8%), 10th-grade male (11.5%), and 12th-grade male (9.6%) than 9th-grade female (9.2%), 10th-grade female (8.5%), and 12th-grade female (6.8%) students, respectively. Overall, the prevalence of having smoked a whole cigarette before age 13 years was higher among Hispanic (11.8%) than black (8.8%) students and higher among Hispanic male (14.7%) than white male (11.2%) and black male (11.1%) students. Overall, the prevalence of having smoked a whole cigarette before age 13 years was higher among 9th-grade (12.1%) than 11th-grade (9.8%) and 12th-grade (8.2%) students; higher among 10th-grade (10.1%) than 12th-grade (8.2%) students; and higher among 9th-grade male (14.8%) than 10th-grade male (11.5%), 11th-grade male (10.9%), and 12th-grade male (9.6%) students. The prevalence of having smoked a whole cigarette before age 13 years ranged from 4.6% to 19.7% across state surveys (median: 10.9%) and from 6.4% to 12.7% across large urban school district surveys (median: 9.1%) (Table 30).
Among students nationwide, the prevalence of having smoked a whole cigarette before age 13 years increased during 1991–1993 (23.8%–26.9%) and then decreased during 1993–2011 (26.9%–10.3%). The prevalence of having smoked a whole cigarette before age 13 years did not change significantly from 2009 (10.7%) to 2011 (10.3%).
Current Cigarette Use
Nationwide, 18.1% of students had smoked cigarettes on at least 1 day during the 30 days before the survey (i.e., current cigarette use) (Table 29). Overall, the prevalence of current cigarette use was higher among male (19.9%) than female (16.1%) students; higher among black male (13.7%) and Hispanic male (19.5%) than black female (7.4%) and Hispanic female (15.2%) students, respectively; and higher among 9th-grade male (15.1%) and 12th-grade male (28.0%) than 9th-grade female (10.9%) and 12th-grade female (22.2%) students, respectively. Overall, the prevalence of current cigarette use was higher among white (20.3%) and Hispanic (17.5%) than black (10.5%) students; higher among white female (18.9%) than black female (7.4%) and Hispanic female (15.2%) students; higher among Hispanic female (15.2%) than black female (7.4%) students; and higher among white male (21.5%) and Hispanic male (19.5%) than black male (13.7%) students. Overall, the prevalence of current cigarette use was higher among 10th-grade (15.6%), 11th-grade (19.3%), and 12th-grade (25.1%) than 9th-grade (13.0%) students; higher among 11th-grade (19.3%) and 12th-grade (25.1%) than 10th-grade (15.6%) students; higher among 12th-grade (25.1%) than 11th-grade (19.3%) students; higher among 10th-grade female (15.1%), 11th-grade female (17.2%), and 12th-grade female (22.2%) than 9th-grade female (10.9%) students; higher among 12th-grade female (22.2%) than 10th-grade female (15.1%) and 11th-grade female (17.2%) students; higher among 11th-grade male (21.2%) and 12th-grade male (28.0%) than 9th-grade male (15.1%) and 10th-grade male (16.1%) students; and higher among 12th-grade male (28.0%) than 11th-grade male (21.2%) students. The prevalence of current cigarette use ranged from 5.9% to 24.1% across state surveys (median: 17.4%) and from 4.8% to 14.7% across large urban school district surveys (median: 11.0%) (Table 30).
Among students nationwide, the prevalence of current cigarette use increased during 1991–1997 (27.5%–36.4%) and then decreased during 1997–2011 (36.4%–18.1%). The prevalence of current cigarette use did not change significantly from 2009 (19.5%) to 2011 (18.1%).
Current Frequent Cigarette Use
Nationwide, 6.4% of students had smoked cigarettes 20 or more days during the 30 days before the survey (i.e., current frequent cigarette use) (Table 31). Overall, the prevalence of current frequent cigarette use was higher among male (7.4%) than female (5.4%) students; higher among Hispanic male (5.8%) than Hispanic female (2.8%) students; and higher among 9th-grade male (4.3%), 11th-grade male (9.2%), and 12th-grade male (12.3%) than 9th-grade female (2.3%), 11th-grade female (6.2%), and 12th-grade female (9.3%) students, respectively. Overall, the prevalence of current frequent cigarette use was higher among white (8.0%) than black (2.6%) and Hispanic (4.4%) students; higher among Hispanic (4.4%) than black (2.6%) students; higher among white female (7.4%) than black female (1.9%) and Hispanic female (2.8%) students; higher among white male (8.6%) than black male (3.4%) and Hispanic male (5.8%) students; and higher among Hispanic male (5.8%) than black male (3.4%) students. Overall, the prevalence of current frequent cigarette use was higher among 11th-grade (7.7%) and 12th-grade (10.8%) than 9th-grade (3.3%) and 10th-grade (4.3%) students; higher among 12th-grade (10.8%) than 11th-grade (7.7%) students; higher among 10th-grade female (4.2%), 11th-grade female (6.2%), and 12th-grade female (9.3%) than 9th-grade female (2.3%) students; higher among 12th-grade female (9.3%) than 10th-grade female (4.2%) and 11th-grade female (6.2%) students; higher among 11th-grade male (9.2%) and 12th-grade male (12.3%) than 9th-grade male (4.3%) and 10th-grade male (4.4%) students; and higher among 12th-grade male (12.3%) than 11th-grade male (9.2%) students. Prevalence of current frequent cigarette use ranged from 2.1% to 11.6% across state surveys (median: 6.3%) and from 0.9% to 5.3% across large urban school district surveys (median: 3.2%) (Table 32).
Among students nationwide, the prevalence of current frequent cigarette use increased during 1991–1999 (12.7%–16.8%) and then decreased during 1999–2011 (16.8%–6.4%). The prevalence of current frequent cigarette use did not change significantly from 2009 (7.3%) to 2011 (6.4%).
Smoked More than 10 Cigarettes per Day
Among the 18.1% of students nationwide who currently smoked cigarettes, 7.8% of students had smoked more than 10 cigarettes per day on the days they smoked during the 30 days before the survey (Table 31). Overall, the prevalence of having smoked more than 10 cigarettes per day was higher among male (9.4%) than female (5.7%) students; higher among Hispanic male (8.8%) than Hispanic female (2.7%) students; and higher among 11th-grade male (11.6%) than 11th-grade female (3.9%) students. Overall, the prevalence of having smoked more than 10 cigarettes per day was higher among white (8.5%) than black (4.6%) students and higher among white female (7.4%) than Hispanic female (2.7%) students. The prevalence of having smoked more than 10 cigarettes per day ranged from 3.5% to 18.2% across state surveys (median: 7.8%) and from 1.9% to 12.9% across large urban school district surveys (median: 8.3%) (Table 32).
During 1991–2011, among students nationwide, a significant linear decrease occurred in the prevalence of having smoked more than 10 cigarettes per day (18.0%–7.8%). The prevalence of having smoked more than 10 cigarettes per day did not change significantly from 2009 (7.8%) to 2011 (7.8%).
Smoked Cigarettes on School Property
Nationwide, 4.9% of students had smoked cigarettes on school property on at least 1 day during the 30 days before the survey (Table 33). Overall, the prevalence of having smoked cigarettes on school property was higher among male (5.7%) than female (4.1%) students; higher among black male (4.3%) and Hispanic male (5.5%) than black female (1.8%) and Hispanic female (3.1%) students, respectively; and higher among 12th-grade male (8.5%) than 12th-grade female (4.7%) students. Overall, the prevalence of having smoked cigarettes on school property was higher among white (5.4%) than black (3.0%) students and higher among white female (5.0%) than black female (1.8%) and Hispanic female (3.1%) students. Overall, the prevalence of having smoked cigarettes on school property was higher among 10th-grade (4.4%), 11th-grade (5.9%), and 12th-grade (6.6%) than 9th-grade (2.8%) students; higher among 11th-grade (5.9%) and 12th-grade (6.6%) than 10th-grade (4.4%) students; higher among 10th-grade female (4.2%), 11th-grade female (5.2%), and 12th-grade female (4.7%) than 9th-grade female (2.2%) students; higher among 11th-grade male (6.7%) and 12th-grade male (8.5%) than 9th-grade male (3.4%) students; and higher among 12th-grade male (8.5%) than 10th-grade male (4.6%) students. The prevalence of having smoked cigarettes on school property ranged from 2.3% to 9.3% across state surveys (median: 4.3%) and from 1.5% to 6.1% across large urban school district surveys (median: 3.7%) (Table 34).
Among students nationwide, the prevalence of having smoked cigarettes on school property did not change significantly during 1993–1995 (13.2%–16.0%) and then decreased during 1995–2011 (16.0%–4.9%). The prevalence of having smoked cigarettes on school property did not change significantly from 2009 (5.1%) to 2011 (4.9%).
Bought Cigarettes in a Store or Gas Station
Among the 14.2% of students nationwide who currently smoked cigarettes and were aged <18 years, 14.0% had usually obtained their own cigarettes by buying them in a store (e.g., convenience store, supermarket, or discount store) or gas station during the 30 days before the survey (Table 33). Overall, the prevalence of having bought their own cigarettes in a store or gas station was higher among male (17.1%) than female (10.2%) students; higher among white male (17.5%) and Hispanic male (20.8%) than white female (9.8%) and Hispanic female (7.5%) students, respectively; and higher among 10th-grade male (16.1%) than 10th-grade female (6.6%) students. Overall, the prevalence of having bought their own cigarettes in a store or gas station was higher among 11th-grade (18.3%) and 12th-grade (18.1%) than 9th-grade (8.7%) students; higher among 11th-grade (18.3%) than 10th-grade (11.8%) students; higher among 11th-grade female (13.4%) than 10th-grade female (6.6%) students; and higher among 11th-grade male (22.4%) and 12th-grade male (20.8%) than 9th-grade male (10.3%) students. The prevalence of having bought their own cigarettes in a store or gas station ranged from 3.0% to 25.5% across state surveys (median: 12.3%) and from 10.3% to 30.1% across large urban school district surveys (median: 18.0%) (Table 34).
During 2001–2011, among students nationwide who currently smoked cigarettes and were aged <18 years, a significant linear decrease occurred in the prevalence of having bought their own cigarettes in a store or gas station (19.0%–14.0%). The prevalence of having bought their own cigarettes in a store or gas station did not change significantly from 2009 (14.1%) to 2011 (14.0%).
Tried to Quit Smoking Cigarettes
Among the 18.1% of students nationwide who currently smoked cigarettes, 49.9% had tried to quit smoking cigarettes during the 12 months before the survey (Table 35). Overall, the prevalence of having tried to quit smoking cigarettes was higher among female (53.9%) than male (47.0%) students; higher among white female (54.0%) and Hispanic female (55.9%) than white male (46.3%) and Hispanic male (44.7%) students, respectively; and higher among 11th-grade female (55.1%) and 12th-grade female (52.6%) than 11th-grade male (43.1%) and 12th-grade male (44.1%) students, respectively. Overall, the prevalence of having tried to quit smoking cigarettes was higher among 10th-grade (55.9%) than 12th-grade (47.8%) students and higher among 10th-grade male (53.9%) than 11th-grade male (43.1%) and 12th-grade male (44.1%) students. The prevalence of having tried to quit smoking cigarettes ranged from 44.3% to 68.0% across state surveys (median: 52.1%) and from 40.5% to 61.6% across large urban school district surveys (median: 53.3%) (Table 36).
During 2001–2011, among students nationwide who currently smoke cigarettes, a significant linear decrease occurred in the prevalence of having ever tried to quit smoking cigarettes (57.4%–49.9%). The prevalence of having ever tried to quit smoking cigarettes did not change significantly from 2009 (50.8%) to 2011 (49.9%).
Current Smokeless Tobacco Use
Nationwide, 7.7% of students had used smokeless tobacco (e.g., chewing tobacco, snuff, or dip) on at least 1 day during the 30 days before the survey (i.e., current smokeless tobacco use) (Table 37). Overall, the prevalence of current smokeless tobacco use was higher among male (12.8%) than female (2.2%) students; higher among white male (15.6%), black male (5.4%), and Hispanic male (8.7%) than white female (2.4%), black female (0.8%), and Hispanic female (2.8%) students, respectively; and higher among 9th-grade male (9.6%), 10th-grade male (12.1%), 11th-grade male (14.5%), and 12th-grade male (15.0%) than 9th-grade female (2.0%), 10th-grade female (2.1%), 11th-grade female (2.3%), and 12th-grade female (2.2%) students, respectively. Overall, the prevalence of current smokeless tobacco use was higher among white (9.3%) than black (3.1%) and Hispanic (5.9%) students; higher among Hispanic (5.9%) than black (3.1%) students; higher among white female (2.4%) and Hispanic female (2.8%) than black female (0.8%) students; higher among white male (15.6%) than black male (5.4%) and Hispanic male (8.7%) students; and higher among Hispanic male (8.7%) than black male (5.4%) students. Overall, the prevalence of current smokeless tobacco use was higher among 11th-grade (8.6%) and 12th-grade (8.8%) than 9th-grade (5.9%) students; higher among 11th-grade male (14.5%) and 12th-grade male (15.0%) than 9th-grade male (9.6%) students; and higher among 12th-grade male (15.0%) than 10th-grade male (12.1%) students. The prevalence of current smokeless tobacco use ranged from 3.5% to 16.9% across state surveys (median: 8.8%) and from 1.4% to 7.5% across large urban school district surveys (median: 3.8%) (Table 38).
Among students nationwide, the prevalence of current smokeless tobacco use decreased during 1995–2003 (11.4%–6.7%) and then did not change significantly during 2003–2011 (6.7%–7.7%). The prevalence of current smokeless tobacco use also did not change significantly from 2009 (8.9%) to 2011 (7.7%).
Used Smokeless Tobacco on School Property
Nationwide, 4.8% of students had used smokeless tobacco (e.g., chewing tobacco, snuff, or dip) on school property on at least 1 day during the 30 days before the survey (Table 37). Overall, the prevalence of having used smokeless tobacco on school property was higher among male (8.4%) than female (0.9%) students; higher among white male (10.1%), black male (3.4%), and Hispanic male (5.7%) than white female (0.8%), black female (0.4%), and Hispanic female (1.4%) students, respectively; and higher among 9th-grade male (6.4%), 10th-grade male (7.8%), 11th-grade male (9.1%), and 12th-grade male (10.4%) than 9th-grade female (0.9%), 10th-grade female (1.0%), 11th-grade female (0.8%), and 12th-grade female (0.7%) students, respectively. Overall, the prevalence of having used smokeless tobacco on school property was higher among white (5.6%) than black (1.9%) and Hispanic (3.7%) students; higher among Hispanic (3.7%) than black (1.9%) students; higher among white male (10.1%) than black male (3.4%) and Hispanic male (5.7%) students; and higher among Hispanic male (5.7%) than black male (3.4%) students. Overall, the prevalence of having used smokeless tobacco on school property was higher among 12th-grade (5.7%) than 9th-grade (3.8%) students; higher among 11th-grade male (9.1%) and 12th-grade male (10.4%) than 9th-grade male (6.4%) students; and higher among 12th-grade male (10.4%) than 10th-grade male (7.8%) students. The prevalence of having used smokeless tobacco on school property ranged from 2.3% to 11.6% across state surveys (median: 5.1%) and from 0.7% to 3.5% across large urban school district surveys (median: 2.2%) (Table 38).
Among students nationwide, the prevalence of having used smokeless tobacco on school property did not change significantly during 1995–2011 (6.3%–4.8%) or from 2009 (5.5%) to 2011 (4.8%).
Current Cigar Use
Nationwide, 13.1% of students had smoked cigars, cigarillos, or little cigars on at least 1 day during the 30 days before the survey (i.e., current cigar use) (Table 39). Overall, the prevalence of current cigar use was higher among male (17.8%) than female (8.0%) students; higher among white male (19.0%), black male (15.1%), and Hispanic male (17.2%) than white female (7.5%), black female (8.5%), and Hispanic female (9.1%) students, respectively; and higher among 9th-grade male (12.3%), 10th-grade male (15.4%), 11th-grade male (20.4%), and 12th-grade male (23.9%) than 9th-grade female (5.5%), 10th-grade female (8.1%), 11th-grade female (8.4%), and 12th-grade female (10.2%) students, respectively. The prevalence of current cigar use was higher among white male (19.0%) than black male (15.1%) students. Overall, the prevalence of current cigar use was higher among 10th-grade (11.9%), 11th-grade (14.5%), and 12th-grade (17.3%) than 9th-grade (9.0%) students; higher among 11th-grade (14.5%) and 12th-grade (17.3%) than 10th-grade (11.9%) students; higher among 10th-grade female (8.1%), 11th-grade female (8.4%), and 12th-grade female (10.2%) than 9th-grade female (5.5%) students; higher among 10th-grade male (15.4%), 11th-grade male (20.4%), and 12th-grade male (23.9%) than 9th-grade male (12.3%) students; and higher among 11th-grade male (20.4%) and 12th-grade male (23.9%) than 10th-grade male (15.4%) students. The prevalence of current cigar use ranged from 5.0% to 18.3% across state surveys (median: 13.9%) and from 6.0% to 15.7% across large urban school district surveys (median: 10.4%) (Table 40).
Among students nationwide, the prevalence of current cigar use decreased during 1997–2005 (22.0%–14.0%) and then did not change significantly during 2005–2011 (14.0%–13.1%). The prevalence of current cigar use also did not change significantly from 2009 (14.0%) to 2011 (13.1%).
Current Tobacco Use
Nationwide, 23.4% of students had reported current cigarette use, current smokeless tobacco use, or current cigar use (i.e., current tobacco use) (Table 39). Overall, the prevalence of current tobacco use was higher among male (28.1%) than female (18.5%) students; higher among white male (31.5%), black male (18.8%), and Hispanic male (24.4%) than white female (21.2%), black female (12.3%), and Hispanic female (16.3%) students, respectively; and higher among 9th-grade male (19.7%), 10th-grade male (25.3%), 11th-grade male (31.6%), and 12th-grade male (37.1%) than 9th-grade female (12.4%), 10th-grade female (17.2%), 11th-grade female (19.8%), and 12th-grade female (25.4%) students, respectively. Overall, the prevalence of current tobacco use was higher among white (26.5%) than black (15.4%) and Hispanic (20.5%) students; higher among Hispanic (20.5%) than black (15.4%) students; higher among white female (21.2%) than black female (12.3%) and Hispanic female (16.3%) students; higher among Hispanic female (16.3%) than black female (12.3%) students; higher among white male (31.5%) than black male (18.8%) and Hispanic male (24.4%) students; and higher among Hispanic male (24.4%) than black male (18.8%) students. Overall, the prevalence of current tobacco use was higher among 10th-grade (21.5%), 11th-grade (25.8%), and 12th-grade (31.4%) than 9th-grade (16.1%) students; higher among 11th-grade (25.8%) and 12th-grade (31.4%) than 10th-grade (21.5%) students; higher among 12th-grade (31.4%) than 11th-grade (25.8%) students; higher among 10th-grade female (17.2%), 11th-grade female (19.8%), and 12th-grade female (25.4%) than 9th-grade female (12.4%) students; higher among 12th-grade female (25.4%) than 10th-grade female (17.2%) and 11th-grade female (19.8%) students; higher among 10th-grade male (25.3%), 11th-grade male (31.6%), and 12th-grade male (37.1%) than 9th-grade male (19.7%) students; and higher among 11th-grade male (31.6%) and 12th-grade male (37.1%) than 10th-grade male (25.3%) students. The prevalence of current tobacco use ranged from 7.8% to 31.9% across state surveys (median: 23.9%) and from 9.3% to 20.0% across large urban school district surveys (median: 14.9%) (Table 40).
Among students nationwide, the prevalence of current tobacco use decreased during 1997–2007 (43.4%–25.7%) and then did not change significantly during 2007–2011 (25.7%–23.4%). The prevalence of current tobacco use also did not change significantly from 2009 (26.0%) to 2011 (23.4%).
Alcohol and Other Drug Use
Ever Drank Alcohol
Nationwide, 70.8% of students had had at least one drink of alcohol on at least 1 day during their life (i.e., ever drank alcohol) (Table 41). The prevalence of having ever drunk alcohol was higher among black female (66.1%) than black male (60.9%) students. Overall, the prevalence of having ever drunk alcohol was higher among white (71.7%) and Hispanic (73.2%) than black (63.5%) students; higher among Hispanic female (74.1%) than black female (66.1%) students; and higher among white male (72.3%) and Hispanic male (72.4%) than black male (60.9%) students. Overall, the prevalence of having ever drunk alcohol was higher among 10th-grade (69.2%), 11th-grade (75.3%), and 12th-grade (79.0%) than 9th-grade (61.7%) students; higher among 11th-grade (75.3%) and 12th-grade (79.0%) than 10th-grade (69.2%) students; higher among 12th-grade (79.0%) than 11th-grade (75.3%) students; higher among 10th-grade female (69.1%), 11th-grade female (74.8%), and 12th-grade female (80.0%) than 9th-grade female (61.9%) students; higher among 11th-grade female (74.8%) and 12th-grade female (80.0%) than 10th-grade female (69.1%) students; higher among 12th-grade female (80.0%) than 11th-grade female (74.8%) students; higher among 10th-grade male (69.2%), 11th-grade male (75.7%), and 12th-grade male (78.0%) than 9th-grade male (61.6%) students; and higher among 11th-grade male (75.7%) and 12th-grade male (78.0%) than 10th-grade male (69.2%) students. The prevalence of having ever drunk alcohol ranged from 35.1% to 75.6% across state surveys (median: 66.3%) and from 49.1% to 72.2% across large urban school district surveys (median: 65.2%) (Table 42).
Among students nationwide, the prevalence of having ever drunk alcohol did not change significantly during 1991–1999 (81.6%–81.0%) and then decreased during 1999–2011 (81.0%–70.8%). The prevalence of having ever drunk alcohol did not change significantly from 2009 (72.5%) to 2011 (70.8%).
Drank Alcohol Before Age 13 Years
Nationwide, 20.5% of students had drunk alcohol (other than a few sips) for the first time before age 13 years (Table 41). Overall, the prevalence of having drunk alcohol before age 13 years was higher among male (23.3%) than female (17.4%) students; higher among white male (21.1%), black male (24.1%), and Hispanic male (27.2%) than white female (14.8%), black female (19.4%), and Hispanic female (23.0%) students, respectively; and higher among 9th-grade male (28.9%), 10th-grade male (24.3%), 11th-grade male (20.9%), and 12th-grade male (17.9%) than 9th-grade female (24.1%), 10th-grade female (17.6%), 11th-grade female (14.2%), and 12th-grade female (12.2%) students, respectively. Overall, the prevalence of having drunk alcohol before age 13 years was higher among black (21.8%) than white (18.1%) students; higher among Hispanic (25.2%) than white (18.1%) and black (21.8%) students; higher among black female (19.4%) than white female (14.8%) students; higher among Hispanic female (23.0%) than white female (14.8%) and black female (19.4%) students; and higher among Hispanic male (27.2%) than white male (21.1%) students. Overall, the prevalence of having drunk alcohol before age 13 years was higher among 9th-grade (26.6%) than 10th-grade (21.1%), 11th-grade (17.6%), and 12th-grade (15.1%) students; higher among 10th-grade (21.1%) than 11th-grade (17.6%) and 12th-grade (15.1%) students; higher among 11th-grade (17.6%) than 12th-grade (15.1%) students; higher among 9th-grade female (24.1%) than 10th-grade female (17.6%), 11th-grade female (14.2%), and 12th-grade female (12.2%) students; higher among 10th-grade female (17.6%) than 11th-grade female (14.2%) and 12th-grade female (12.2%) students; higher among 9th-grade male (28.9%) than 10th-grade male (24.3%), 11th-grade male (20.9%), and 12th-grade male (17.9%) students; and higher among 10th-grade male (24.3%) and 11th-grade male (20.9%) than 12th-grade male (17.9%) students. The prevalence of having drunk alcohol before age 13 years ranged from ranged from 10.7% to 27.4% across state surveys (median: 19.0%) and from 16.2% to 26.4% across large urban school district surveys (median: 21.9%) (Table 42).
Among students nationwide, the prevalence of having drunk alcohol before age 13 years did not change significantly during 1991–1999 (32.7%–32.2%) and then decreased during 1999–2011 (32.2%–20.5%). The prevalence of having drunk alcohol before age 13 years did not change significantly from 2009 (21.1%) to 2011 (20.5%).
Current Alcohol Use
Nationwide, 38.7% of students had had at least one drink of alcohol on at least 1 day during the 30 days before the survey (i.e., current alcohol use) (Table 43). The prevalence of current alcohol use was higher among 11th-grade male (45.2%) and 12th-grade male (51.2%) than 11th-grade female (40.1%) and 12th-grade female (45.4%) students, respectively. Overall, the prevalence of current alcohol use was higher among white (40.3%) and Hispanic (42.3%) than black (30.5%) students; higher among white female (38.8%) and Hispanic female (42.4%) than black female (31.6%) students; and higher among white male (41.6%) and Hispanic male (42.1%) than black male (29.5%) students. Overall, the prevalence of current alcohol use was higher among 10th-grade (35.7%), 11th-grade (42.7%), and 12th-grade (48.4%) than 9th-grade (29.8%) students; higher among 11th-grade (42.7%) and 12th-grade (48.4%) than 10th-grade (35.7%) students; higher among 12th-grade (48.4%) than 11th-grade (42.7%) students; higher among 10th-grade female (37.1%), 11th-grade female (40.1%), and 12th-grade female (45.4%) than 9th-grade female (30.3%) students; and higher among 12th-grade female (45.4%) than 10th-grade female (37.1%) and 11th-grade female (40.1%) students; higher among 10th-grade male (34.4%), 11th-grade male (45.2%), and 12th-grade male (51.2%) than 9th-grade male (29.3%) students; higher among 11th-grade male (45.2%) and 12th-grade male (51.2%) than 10th-grade male (34.4%) students; and higher among 12th-grade male (51.2%) than 11th-grade male (45.2%) students. The prevalence of current alcohol use ranged from 15.0% to 44.4% across state surveys (median: 36.2%) and from 21.0% to 43.5% across large urban school district surveys (median: 33.0%) (Table 44).
Among students nationwide, the prevalence of current alcohol use did not change significantly during 1991–1999 (50.8%–50.0%) and then decreased during 1999–2011 (50.0%–38.7%). The prevalence of current alcohol use also decreased from 2009 (41.8%) to 2011 (38.7%).
Binge Drinking
Nationwide, 21.9% of students had had five or more drinks of alcohol in a row (i.e., within a couple of hours) on at least 1 day during the 30 days before the survey (i.e., binge drinking) (Table 43). Overall, the prevalence of binge drinking was higher among male (23.8%) than female (19.8%) students; higher among white male (26.1%) and black male (14.5%) than white female (21.7%) and black female (10.3%) students, respectively; and higher among 11th-grade male (27.9%) and 12th-grade male (35.7%) than 11th-grade female (22.6%) and 12th-grade female (27.0%) students, respectively. Overall, the prevalence of binge drinking was higher among white (24.0%) and Hispanic (24.2%) than black (12.4%) students; higher among white female (21.7%) and Hispanic female (22.4%) than black female (10.3%) students; and higher among white male (26.1%) and Hispanic male (25.9%) than black male (14.5%) students. Overall, the prevalence of binge drinking was higher among 10th-grade (18.4%), 11th-grade (25.2%), and 12th-grade (31.5%) than 9th-grade (14.0%) students; higher among 11th-grade (25.2%) and 12th-grade (31.5%) than 10th-grade (18.4%) students; higher among 12th-grade (31.5%) than 11th-grade (25.2%) students; higher among 10th-grade female (17.8%), 11th-grade female (22.6%), and 12th-grade female (27.0%) than 9th-grade female (13.0%) students; higher among 11th-grade female (22.6%) and 12th-grade female (27.0%) than 10th-grade female (17.8%) students; higher among 12th-grade female (27.0%) than 11th-grade female (22.6%) students; higher among 10th-grade male (19.0%), 11th-grade male (27.9%), and 12th-grade male (35.7%) than 9th-grade male (15.0%) students; higher among 11th-grade male (27.9%) and 12th-grade male (35.7%) than 10th-grade male (19.0%) students; and higher among 12th-grade male (35.7%) than 11th-grade male (27.9%) students. The prevalence of binge drinking ranged from 9.1% to 26.5% across state surveys (median: 21.8%) and from 7.4% to 25.2% across large urban school district surveys (median: 17.5%) (Table 44).
Among students nationwide, the prevalence of binge drinking did not change significantly during 1991–1997 (31.3%–33.4%) and then decreased during 1997–2011 (33.4%–21.9%). The prevalence of binge drinking also decreased from 2009 (24.2%) to 2011 (21.9%).
Drank Alcohol on School Property
Nationwide, 5.1% of students had drunk at least one drink of alcohol on school property on at least 1 day during the 30 days before the survey (Table 45). The prevalence of having drunk alcohol on school property was higher among black male (6.5%) than black female (3.8%) students and higher among 12th-grade male (6.4%) than 12th-grade female (3.8%) students. Overall, the prevalence of having drunk alcohol on school property was higher among Hispanic (7.3%) than white (4.0%) and black (5.1%) students; higher among Hispanic female (6.6%) than white female (3.8%) and black female (3.8%) students; and higher among black male (6.5%) and Hispanic male (7.9%) than white male (4.2%) students. The prevalence of having drunk alcohol on school property ranged from 2.0% to 6.4% across state surveys (median: 4.1%) and from 2.6% to 10.7% across large urban school district surveys (median: 5.3%) (Table 46).
During 1993–2011, among students nationwide, a significant linear decrease occurred in the prevalence of having drunk alcohol on school property (5.2%–5.1%). The prevalence of having drunk alcohol on school property did not change significantly from 2009 (4.5%) to 2011 (5.1%).
Someone Gave Alcohol to Them
Among the 38.7% of students nationwide who currently drank alcohol, 40.0% had usually obtained the alcohol they drank by someone giving it to them during the 30 days before the survey (Table 45). Overall, the prevalence of having someone give alcohol to them was higher among female (45.7%) than male (35.0%) students; higher among white female (43.9%), black female (50.6%), and Hispanic female (46.9%) than white male (34.4%), black male (39.1%), and Hispanic male (33.1%) students, respectively; and higher among 9th-grade female (49.4%), 11th-grade female (43.7%), and 12th-grade female (47.3%) than 9th-grade male (29.4%), 11th-grade male (32.9%), and 12th-grade male (36.3%) students, respectively. Overall, the prevalence of having someone give alcohol to them was higher among black (44.9%) than white (38.8%) students. The prevalence of having someone give alcohol to them was higher among 10th-grade male (41.8%) than 9th-grade male (29.4%) and 11th-grade male (32.9%) students. The prevalence of having someone give alcohol to them ranged from 31.2% to 44.2% across state surveys (median: 38.5%) and from 26.5% to 44.8% across large urban school district surveys (median: 36.3%) (Table 46).
Among students nationwide who currently drank alcohol, the prevalence of having someone give alcohol to them did not change significantly during 2007–2011 (41.7%–40.0%) or from 2009 (42.2%) to 2011 (40.0%).
Ever Used Marijuana
Nationwide, 39.9% of students had used marijuana one or more times during their life (i.e., ever used marijuana) (Table 47). Overall, the prevalence of having ever used marijuana was higher among male (42.5%) than female (37.2%) students; higher among white male (40.3%), black male (48.5%), and Hispanic male (45.0%) than white female (35.4%), black female (37.7%), and Hispanic female (39.1%) students, respectively; and higher among 9th-grade male (34.9%) and 11th-grade male (48.7%) than 9th-grade female (26.4%) and 11th-grade female (42.1%) students, respectively. Overall, the prevalence of having ever used marijuana was higher among black (43.0%) and Hispanic (42.1%) than white (37.9%) students and higher among black male (48.5%) and Hispanic male (45.0%) than white male (40.3%) students. Overall, the prevalence of having ever used marijuana was higher among 10th-grade (36.4%), 11th-grade (45.5%), and 12th-grade (48.9%) than 9th-grade (30.8%) students; higher among 11th-grade (45.5%) and 12th-grade (48.9%) than 10th-grade (36.4%) students; higher among 10th-grade female (35.2%), 11th-grade female (42.1%), and 12th-grade female (47.1%) than 9th-grade female (26.4%) students; higher among 11th-grade female (42.1%) and 12th-grade female (47.1%) than 10th-grade female (35.2%) students; higher among 12th-grade female (47.1%) than 11th-grade female (42.1%) students; and higher among 11th-grade male (48.7%) and 12th-grade male (50.8%) than 9th-grade male (34.9%) and 10th-grade male (37.5%) students. The prevalence of having ever used marijuana ranged from 19.6% to 46.0% across state surveys (median: 37.3%) and from 30.1% to 54.1% across large urban school district surveys (median: 40.5%) (Table 48).
Among students nationwide, the prevalence of having ever used marijuana increased during 1991–1999 (31.3%–47.2%) and then decreased during 1999–2011 (47.2%–39.9%). The prevalence of having ever used marijuana increased from 2009 (36.8%) to 2011 (39.9%).
Tried Marijuana Before Age 13 Years
Nationwide, 8.1% of students had tried marijuana for the first time before age 13 years (Table 47). Overall, the prevalence of having tried marijuana before age 13 years was higher among male (10.4%) than female (5.7%) students; higher among white male (8.5%), black male (14.2%), and Hispanic male (11.6%) than white female (4.4%), black female (6.9%), and Hispanic female (7.1%) students, respectively; and higher among 9th-grade male (12.7%), 10th-grade male (10.1%), 11th-grade male (9.6%), and 12th-grade male (8.7%) than 9th-grade female (6.6%), 10th-grade female (4.8%), 11th-grade female (5.6%), and 12th-grade female (5.3%) students, respectively. Overall, the prevalence of having tried marijuana before age 13 years was higher among black (10.5%) and Hispanic (9.4%) than white (6.5%) students; higher among black female (6.9%) and Hispanic female (7.1%) than white female (4.4%) students; and higher among black male (14.2%) and Hispanic male (11.6%) than white male (8.5%) students. Overall, the prevalence of having tried marijuana before age 13 years was higher among 9th-grade (9.7%) than 10th-grade (7.5%), 11th-grade (7.6%), and 12th-grade (7.0%) students; higher among 9th-grade female (6.6%) than 10th-grade female (4.8%) students; and higher among 9th-grade male (12.7%) than 11th-grade male (9.6%) and 12th-grade male (8.7%) students. The prevalence of having tried marijuana before age 13 years ranged from 4.3% to 18.5% across state surveys (median: 7.8%) and from 6.3% to 15.2% across large urban school district surveys (median: 10.1%) (Table 48).
Among students nationwide, the prevalence of having tried marijuana before age 13 years increased during 1991–1999 (7.4%–11.3%) and then decreased during 1999–2011 (11.3%–8.1%). The prevalence of having tried marijuana before age 13 years did not change significantly from 2009 (7.5%) to 2011 (8.1%).
Current Marijuana Use
Nationwide, 23.1% of students had used marijuana one or more times during the 30 days before the survey (i.e., current marijuana use) (Table 49). Overall, the prevalence of current marijuana use was higher among male (25.9%) than female (20.1%) students; higher among white male (24.4%), black male (29.1%), and Hispanic male (27.0%) than white female (18.8%), black female (21.3%), and Hispanic female (21.6%) students, respectively; and higher among 9th-grade male (20.5%), 10th-grade male (24.2%), 11th-grade male (28.9%), and 12th-grade male (31.1%) than 9th-grade female (15.4%), 10th-grade female (18.9%), 11th-grade female (22.0%), and 12th-grade female (24.7%) students, respectively. The prevalence of current marijuana use was higher among black male (29.1%) than white male (24.4%) students. Overall, the prevalence of current marijuana use was higher among 10th-grade (21.6%), 11th-grade (25.5%), and 12th-grade (28.0%) than 9th-grade (18.0%) students; higher among 11th-grade (25.5%) and 12th-grade (28.0%) than 10th-grade (21.6%) students; higher among 10th-grade female (18.9%), 11th-grade female (22.0%), and 12th-grade female (24.7%) than 9th-grade female (15.4%) students; higher among 12th-grade female (24.7%) than 10th-grade female (18.9%) students; higher among 11th-grade male (28.9%) and 12th-grade male (31.1%) than 9th-grade male (20.5%) and 10th-grade male (24.2%) students. The prevalence of current marijuana use ranged from 9.6% to 28.4% across state surveys (median: 21.1%) and from 16.3% to 31.7% across large urban school district surveys (median: 22.1%) (Table 50).
Among students nationwide, the prevalence of current marijuana use increased during 1991–1999 (14.7%–26.7%) and then decreased during 1999–2011 (26.7%–23.1%). The prevalence of current marijuana use increased from 2009 (20.8%) to 2011 (23.1%).
Used Marijuana on School Property
Nationwide, 5.9% of students had used marijuana on school property one or more times during the 30 days before the survey (Table 49). Overall, the prevalence of having used marijuana on school property was higher among male (7.5%) than female (4.1%) students; higher among white male (5.6%), black male (9.3%), and Hispanic male (9.6%) than white female (3.4%), black female (4.1%), and Hispanic female (5.7%) students, respectively; and higher among 9th-grade male (7.0%), 10th-grade male (8.0%), 11th-grade male (7.5%), and 12th-grade male (7.2%) than 9th-grade female (3.7%), 10th-grade female (4.2%), 11th-grade female (4.7%), and 12th-grade female (3.5%) students, respectively. Overall, the prevalence of having used marijuana on school property was higher among black (6.7%) and Hispanic (7.7%) than white (4.5%) students; higher among Hispanic female (5.7%) than white female (3.4%) students; and higher among black male (9.3%) and Hispanic male (9.6%) than white male (5.6%) students. The prevalence of having used marijuana on school property ranged from 2.4% to 9.7% across state surveys (median: 4.7%) and from 4.5% to 11.5% across large urban school district surveys (median: 6.9%) (Table 50).
Among students nationwide, the prevalence of having used marijuana on school property decreased during 1995–2005 (8.8%–4.5%) and then increased during 2005–2011 (4.5%–5.9%). The prevalence of having used marijuana on school property increased from 2009 (4.6%) to 2011 (5.9%).
Ever Used Cocaine
Nationwide, 6.8% of students had used any form of cocaine (e.g., powder, crack,§ or freebase¶) one or more times during their life (i.e., ever used cocaine) (Table 51). Overall, the prevalence of having ever used cocaine was higher among male (7.9%) than female (5.7%) students; higher among white male (7.6%), black male (4.2%), and Hispanic male (11.9%) than white female (5.8%), black female (1.1%), and Hispanic female (8.4%) students, respectively; and higher among 11th-grade male (8.5%) and 12th-grade male (10.1%) than 11th-grade female (6.4%) and 12th-grade female (6.8%) students, respectively. Overall, the prevalence of having ever used cocaine was higher among white (6.7%) and Hispanic (10.2%) than black (2.6%) students; higher among Hispanic (10.2%) than white (6.7%) students; higher among white female (5.8%) and Hispanic female (8.4%) than black female (1.1%) students; higher among Hispanic female (8.4%) than white female (5.8%) students; higher among white male (7.6%) and Hispanic male (11.9%) than black male (4.2%) students; and higher among Hispanic male (11.9%) than white male (7.6%) students. Overall, the prevalence of having ever used cocaine was higher among 11th-grade (7.5%) and 12th-grade (8.5%) than 9th-grade (5.0%) students; higher among 12th-grade (8.5%) than 10th-grade (6.5%) students; higher among 11th-grade female (6.4%) and 12th-grade female (6.8%) than 9th-grade female (4.1%) students; higher among 11th-grade male (8.5%) and 12th-grade male (10.1%) than 9th-grade male (5.8%) students; and higher among 12th-grade male (10.1%) than 10th-grade male (7.4%) students. The prevalence of having ever used cocaine ranged from 4.0% to 11.4% across state surveys (median: 5.9%) and from 1.5% to 9.3% across large urban school district surveys (median: 5.8%) (Table 52).
Among students nationwide, the prevalence of having ever used cocaine increased during 1991–1999 (5.9%–9.5%) and then decreased during 1999–2011 (9.5%–6.8%). The prevalence of having ever used cocaine did not change significantly from 2009 (6.4%) to 2011 (6.8%).
Current Cocaine Use
Nationwide, 3.0% of students had used any form of cocaine (e.g., powder, crack, or freebase) one or more times during the 30 days before the survey (i.e., current cocaine use) (Table 51). Overall, the prevalence of current cocaine use was higher among male (4.1%) than female (1.8%) students; higher among white male (3.3%), black male (2.0%), and Hispanic male (7.5%) than white female (1.6%), black female (0.1%), and Hispanic female (3.2%) students, respectively; and higher among 9th-grade male (3.8%), 10th-grade male (4.2%), 11th-grade male (4.1%), and 12th-grade male (4.2%) than 9th-grade female (1.6%), 10th-grade female (1.7%), 11th-grade female (1.9%), and 12th-grade female (1.9%) students, respectively. Overall, the prevalence of current cocaine use was higher among white (2.5%) and Hispanic (5.4%) than black (1.1%) students; higher among Hispanic (5.4%) than white (2.5%) students; higher among white female (1.6%) and Hispanic female (3.2%) than black female (0.1%) students; higher among Hispanic female (3.2%) than white female (1.6%) students; higher among white male (3.3%) and Hispanic male (7.5%) than black male (2.0%) students; and higher among Hispanic male (7.5%) than white male (3.3%) students. The prevalence of current cocaine use ranged from 1.4% to 5.2% across state surveys (median: 2.7%) and from 0.8% to 4.3% across large urban school district surveys (median: 2.8%) (Table 52).
Among students nationwide, the prevalence of current cocaine use increased during 1991–2001 (1.7%–4.2%) and then decreased during 2001–2011 (4.2%–3.0%). The prevalence of current cocaine use did not change significantly from 2009 (2.8%) to 2011 (3.0%).
Ever Used Inhalants
Nationwide, 11.4% of students had sniffed glue, breathed the contents of aerosol spray cans, or inhaled any paints or sprays to get high one or more times during their life (i.e., ever used inhalants) (Table 53). Overall, the prevalence of having ever used inhalants was higher among female (12.3%) than male (10.5%) students; higher among white female (11.6%) than white male (9.8%) students; and higher among 9th-grade female (14.2%) than 9th-grade male (11.1%) students. Overall, the prevalence of having ever used inhalants was higher among Hispanic (14.4%) than white (10.7%) and black (9.2%) students; higher among white female (11.6%) and Hispanic female (15.7%) than black female (9.1%) students; higher among Hispanic female (15.7%) than white female (11.6%) students; and higher among Hispanic male (13.1%) than white male (9.8%) and black male (9.3%) students. Overall, the prevalence of having ever used inhalants was higher among 9th-grade (12.7%), 10th-grade (11.8%), and 11th-grade (11.1%) than 12th-grade (9.3%) students; higher among 9th-grade female (14.2%) than 12th-grade female (10.1%) students; and higher among 9th-grade male (11.1%) and 10th-grade male (11.3%) than 12th-grade male (8.6%) students. The prevalence of having ever used inhalants ranged from 7.3% to 14.5% across state surveys (median: 10.9%) and from 5.6% to 18.7% across large urban school district surveys (median: 9.9%) (Table 54).
Among students nationwide, the prevalence of having ever used inhalants decreased during 1995–2003 (20.3%–12.1%) and then did not change significantly during 2003–2011 (12.1%–11.4%). The prevalence of having ever used inhalants also did not change significantly from 2009 (11.7%) to 2011 (11.4%).
Ever Used Ecstasy
Nationwide, 8.2% of students had used ecstasy (also called "MDMA") one or more times during their life (i.e., ever used ecstasy) (Table 53). Overall, the prevalence of having ever used ecstasy was higher among male (9.8%) than female (6.5%) students; higher among white male (8.7%), black male (8.7%), and Hispanic male (12.6%) than white female (6.7%), black female (3.3%), and Hispanic female (8.4%) students, respectively; and higher among 9th-grade male (6.5%), 10th-grade male (9.5%), and 11th-grade male (11.0%) than 9th-grade female (3.7%), 10th-grade female (5.8%), and 11th-grade female (7.2%) students, respectively. Overall, the prevalence of having ever used ecstasy was higher among Hispanic (10.6%) than white (7.7%) and black (6.0%) students; higher among white female (6.7%) and Hispanic female (8.4%) than black female (3.3%) students; and higher among Hispanic male (12.6%) than white male (8.7%) and black male (8.7%) students. Overall, the prevalence of having ever used ecstasy was higher among 10th-grade (7.7%), 11th-grade (9.2%), and 12th-grade (11.3%) than 9th-grade (5.2%) students; higher among 12th-grade (11.3%) than 10th-grade (7.7%) and 11th-grade (9.2%) students; higher among 10th-grade female (5.8%), 11th-grade female (7.2%), and 12th-grade female (9.9%) than 9th-grade female (3.7%) students; higher among 12th-grade female (9.9%) than 10th-grade female (5.8%) and 11th-grade female (7.2%) students; higher among 10th-grade male (9.5%), 11th-grade male (11.0%), and 12th-grade male (12.6%) than 9th-grade male (6.5%) students; and higher among 12th-grade male (12.6%) than 10th-grade male (9.5%) students. The prevalence of having ever used ecstasy ranged from 4.5% to 12.2% across state surveys (median: 7.0%) and from 2.7% to 16.4% across large urban school district surveys (median: 8.5%) (Table 54).
Among students nationwide, the prevalence of having ever used ecstasy decreased during 2001–2007 (11.1%–5.8%) and then increased during 2007–2011 (5.8%–8.2%). The prevalence of having ever used ecstasy also increased from 2009 (6.7%) to 2011 (8.2%).
Ever Used Heroin
Nationwide, 2.9% of students had used heroin (also called "smack," "junk," or "China White") one or more times during their life (i.e., ever used heroin) (Table 55). Overall, the prevalence of having ever used heroin was higher among male (3.9%) than female (1.8%) students; higher among white male (3.4%), black male (4.3%), and Hispanic male (4.0%) than white female (1.5%), black female (1.1%), and Hispanic female (2.6%) students, respectively; and higher among 9th-grade male (3.9%), 10th-grade male (3.8%), and 11th-grade male (4.1%) than 9th-grade female (1.8%), 10th-grade female (1.8%), and 11th-grade female (1.6%) students, respectively. The prevalence of having ever used heroin was higher among Hispanic female (2.6%) than black female (1.1%) students. The prevalence of having ever used heroin ranged from 1.3% to 5.2% across state surveys (median: 3.0%) and from 0.8% to 5.3% across large urban school district surveys (median: 2.8%) (Table 56).
Among students nationwide, the prevalence of having ever used heroin did not change significantly during 1999–2011 (2.4%–2.9%) or from 2009 (2.5%) to 2011 (2.9%).
Ever Used Methamphetamines
Nationwide, 3.8% of students had used methamphetamines (also called "speed," "crystal," "crank," or "ice") one or more times during their life (i.e., ever used methamphetamines) (Table 55). Overall, the prevalence of having ever used methamphetamines was higher among male (4.5%) than female (3.0%) students; higher among black male (4.2%) and Hispanic male (5.7%) than black female (1.0%) and Hispanic female (3.4%) students, respectively; and higher among 9th-grade male (3.8%), 10th-grade male (4.7%), and 11th-grade male (4.9%) than 9th-grade female (2.6%), 10th-grade female (2.6%), and 11th-grade female (3.1%) students, respectively. Overall, the prevalence of having ever used methamphetamines was higher among Hispanic (4.6%) than black (2.6%) students and higher among white female (3.1%) and Hispanic female (3.4%) than black female (1.0%) students. The prevalence of having ever used methamphetamines ranged from 2.4% to 6.0% across state surveys (median: 3.6%) and from 1.3% to 6.9% across large urban school district surveys (median: 4.0%) (Table 56).
During 1999–2011, among students nationwide, a significant linear decrease occurred in the prevalence of having ever used methamphetamines (9.1%–3.8%). The prevalence of having ever used methamphetamines did not change significantly from 2009 (4.1%) to 2011 (3.8%).
Ever Used Hallucinogenic Drugs
Nationwide, 8.7% of students had used hallucinogenic drugs (e.g., LSD, acid, PCP, angel dust, mescaline, or mushrooms) one or more times during their life (i.e., ever used hallucinogenic drugs) (Table 57). Overall, the prevalence of having ever used hallucinogenic drugs was higher among male (11.3%) than female (5.9%) students; higher among white male (11.6%), black male (6.0%), and Hispanic male (12.2%) than white female (6.9%), black female (0.7%), and Hispanic female (5.7%) students, respectively; and higher among 9th-grade male (8.7%), 10th-grade male (9.3%), 11th-grade male (13.4%), and 12th-grade male (14.1%) than 9th-grade female (3.9%), 10th-grade female (5.9%), 11th-grade female (5.2%), and 12th-grade female (8.7%) students, respectively. Overall, the prevalence of having ever used hallucinogenic drugs was higher among white (9.3%) and Hispanic (9.1%) than black (3.3%) students; higher among white female (6.9%) and Hispanic female (5.7%) than black female (0.7%) students; and higher among white male (11.6%) and Hispanic male (12.2%) than black male (6.0%) students. Overall, the prevalence of having ever used hallucinogenic drugs was higher among 11th-grade (9.4%) and 12th-grade (11.5%) than 9th-grade (6.3%) students; higher among 12th-grade (11.5%) than 10th-grade (7.7%) students; higher among 10th-grade female (5.9%) than 9th-grade female (3.9%) students; higher among 12th-grade female (8.7%) than 9th-grade female (3.9%), 10th-grade female (5.9%), and 11th-grade female (5.2%) students; and higher among 11th-grade male (13.4%) and 12th-grade male (14.1%) than 9th-grade male (8.7%) and 10th-grade male (9.3%) students.
Among students nationwide, the prevalence of having ever used hallucinogenic drugs decreased during 2001–2007 (13.3%–7.8%) and then did not change significantly during 2007–2011 (7.8%–8.7%). The prevalence of having ever used hallucinogenic drugs also did not change significantly from 2009 (8.0%) to 2011 (8.7%).
Ever Took Steroids Without a Doctor's Prescription
Nationwide, 3.6% of students had taken steroid pills or shots without a doctor's prescription one or more times during their life (i.e., ever took steroids without a doctor's prescription) (Table 57). Overall, the prevalence of having ever taken steroids without a doctor's prescription was higher among male (4.2%) than female (2.9%) students; higher among black male (4.5%) than black female (1.3%) students; and higher among 10th-grade male (4.0%) and 12th-grade male (3.7%) than 10th-grade female (2.3%) and 12th-grade female (1.9%) students, respectively. Overall, the prevalence of having ever taken steroids without a doctor's prescription was higher among Hispanic (4.3%) than black (2.9%) students and higher among white female (2.8%) and Hispanic female (4.3%) than black female (1.3%) students. Overall, the prevalence of having ever taken steroids without a doctor's prescription was higher among 9th-grade (4.2%) than 12th-grade (2.8%) students and higher among 9th-grade female (3.9%) than 12th-grade female (1.9%) students. The prevalence of having ever taken steroids without a doctor's prescription ranged from 1.8% to 6.1% across state surveys (median: 3.4%) and from 1.8% to 5.2% across large urban school district surveys (median: 3.7%) (Table 58).
Among students nationwide, the prevalence of having ever taken steroids without a doctor's prescription increased during 1991–2003 (2.7%–6.1%) and then decreased during 2003–2011 (6.1%–3.6%). The prevalence of having ever taken steroids without a doctor's prescription did not change significantly from 2009 (3.3%) to 2011 (3.6%).
Ever Took Prescription Drugs Without a Doctor's Prescription
Nationwide, 20.7% of students had taken prescription drugs (e.g., Oxycontin, Percocet, Vicodin, codeine, Adderall, Ritalin, or Xanax) without a doctor's prescription one or more times during their life (i.e., ever took prescription drugs without a doctor's prescription) (Table 59). The prevalence of having ever taken prescription drugs without a doctor's prescription was higher among black male (17.5%) than black female (11.9%) students and higher among 12th-grade male (27.9%) than 12th-grade female (23.2%) students. Overall, the prevalence of having ever taken prescription drugs without a doctor's prescription was higher among white (22.9%) than black (14.7%) and Hispanic (19.4%) students; higher among Hispanic (19.4%) than black (14.7%) students; higher among white female (22.2%) and Hispanic female (19.0%) than black female (11.9%) students; and higher among white male (23.6%) than black male (17.5%) students. Overall, the prevalence of having ever taken prescription drugs without a doctor's prescription was higher among 11th-grade (23.3%) and 12th-grade (25.6%) than 9th-grade (16.5%) and 10th-grade (18.2%) students; higher among 11th-grade female (22.2%) and 12th-grade female (23.2%) than 9th-grade female (16.2%) students; higher among 12th-grade female (23.2%) than 10th-grade female (18.1%) students; and higher among 11th-grade male (24.5%) and 12th-grade male (27.9%) than 9th-grade male (16.7%) and 10th-grade male (18.3%) students. The prevalence of having ever taken prescription drugs without a doctor's prescription ranged from 12.4% to 22.1% across state surveys (median: 17.6%) and from 7.3% to 18.3% across large urban school district surveys (median: 12.6%) (Table 60).
Among students nationwide, the prevalence of having ever taken prescription drugs without a doctor's prescription did not change significantly from 2009 (20.2%) to 2011 (20.7%).
Ever Injected Any Illegal Drug
Nationwide, 2.3% of students had used a needle to inject any illegal drug into their body one or more times during their life (i.e., ever injected any illegal drug) (Table 59). Overall, the prevalence of having ever injected any illegal drug was higher among male (2.9%) than female (1.6%) students; higher among white male (2.3%) and black male (3.5%) than white female (1.4%) and black female (1.4%) students, respectively; and higher among 9th-grade male (2.6%) and 11th-grade male (3.6%) than 9th-grade female (1.5%) and 11th-grade female (1.1%) students, respectively. Overall, the prevalence of having ever injected any illegal drug was higher among Hispanic (2.9%) than white (1.9%) students. The prevalence of having ever injected any illegal drug ranged from 1.6% to 4.2% across state surveys (median: 2.5%) and from 1.0% to 13.0% across large urban school district surveys (median: 2.9%) (Table 60).
Among students nationwide, the prevalence of having ever injected any illegal drug did not change significantly during 1995–2011 (2.1%–2.3%) or from 2009 (2.1%) to 2011 (2.3%).
Offered, Sold, or Given an Illegal Drug on School Property
Nationwide, 25.6% of students had been offered, sold, or given an illegal drug by someone on school property during the 12 months before the survey (Table 61). Overall, the prevalence of having been offered, sold, or given an illegal drug on school property was higher among male (29.2%) than female (21.7%) students; higher among white male (26.3%), black male (28.7%), and Hispanic male (35.8%) than white female (18.8%), black female (17.0%), and Hispanic female (30.5%) students, respectively; and higher among 9th-grade male (25.9%), 10th-grade male (30.8%), 11th-grade male (32.5%), and 12th-grade male (28.1%) than 9th-grade female (21.3%), 10th-grade female (24.6%), 11th-grade female (21.3%), and 12th-grade female (19.3%) students, respectively. Overall, the prevalence of having been offered, sold, or given an illegal drug on school property was higher among Hispanic (33.2%) than white (22.7%) and black (22.8%) students; higher among Hispanic female (30.5%) than white female (18.8%) and black female (17.0%) students; and higher among Hispanic male (35.8%) than white male (26.3%) and black male (28.7%) students. Overall, the prevalence of having been offered, sold, or given an illegal drug on school property was higher among 10th-grade (27.8%) and 11th-grade (27.0%) than 9th-grade (23.7%) and 12th-grade (23.8%) students; higher among 10th-grade female (24.6%) than 9th-grade female (21.3%), 11th-grade female (21.3%), and 12th-grade female (19.3%) students; and higher among 10th-grade male (30.8%) and 11th-grade male (32.5%) than 9th-grade male (25.9%) students. The prevalence of having been offered, sold, or given an illegal drug on school property ranged from 11.9% to 34.6% across state surveys (median: 24.3%) and from 14.3% to 39.3% across large urban school district surveys (median: 28.7%) (Table 62).
Among students nationwide, the prevalence of having been offered, sold, or given an illegal drug by someone on school property increased during 1993–1995 (24.0%–32.1%) and then decreased during 1995–2011 (32.1%–25.6%). The prevalence of having been offered, sold, or given an illegal drug on school property increased from 2009 (22.7%) to 2011 (25.6%).
Sexual Behaviors that Contribute to Unintended Pregnancy and Sexually Transmitted Diseases, Including HIV Infection
Ever Had Sexual Intercourse
Nationwide, 47.4% of students had ever had sexual intercourse (Table 63). Overall, the prevalence of having ever had sexual intercourse was higher among male (49.2%) than female (45.6%) students; higher among black male (66.9%) and Hispanic male (53.0%) than black female (53.6%) and Hispanic female (43.9%) students, respectively; and higher among 9th-grade male (37.8%) than 9th-grade female (27.8%) students. Overall, the prevalence of having ever had sexual intercourse was higher among black (60.0%) and Hispanic (48.6%) than white (44.3%) students; higher among black (60.0%) than Hispanic (48.6%) students; higher among black female (53.6%) than white female (44.5%) and Hispanic female (43.9%) students; higher among black male (66.9%) and Hispanic male (53.0%) than white male (44.0%) students; and higher among black male (66.9%) than Hispanic male (53.0%) students. Overall, the prevalence of having ever had sexual intercourse was higher among 10th-grade (43.8%), 11th-grade (53.2%), and 12th-grade (63.1%) than 9th-grade (32.9%) students; higher among 11th-grade (53.2%) and 12th-grade (63.1%) than 10th-grade (43.8%) students; higher among 12th-grade (63.1%) than 11th-grade (53.2%) students; higher among 10th-grade female (43.0%), 11th-grade female (51.9%), and 12th-grade female (63.6%) than 9th-grade female (27.8%) students; higher among 11th-grade female (51.9%) and 12th-grade female (63.6%) than 10th-grade female (43.0%) students; higher among 12th-grade female (63.6%) than 11th-grade female (51.9%) students; higher among 10th-grade male (44.5%), 11th-grade male (54.5%), and 12th-grade male (62.6%) than 9th-grade male (37.8%) students; higher among 11th-grade male (54.5%) and 12th-grade male (62.6%) than 10th-grade male (44.5%) students; and higher among 12th-grade male (62.6%) than 11th-grade male (54.5%) students. The prevalence of having ever had sexual intercourse ranged from 37.0% to 59.0% across state surveys (median: 46.9%) and from 27.8% to 62.2% across large urban school district surveys (median: 50.0%) (Table 64).
Among students nationwide, the prevalence of having ever had sexual intercourse decreased during 1991–2001 (54.1%–45.6%) and then did not change significantly during 2001–2011 (45.6%–47.4%). The prevalence of having ever had sexual intercourse also did not change significantly from 2009 (46.0%) to 2011 (47.4%).
Had First Sexual Intercourse Before Age 13 Years
Nationwide, 6.2% of students had had sexual intercourse for the first time before age 13 years (Table 63). Overall, the prevalence of having had sexual intercourse before age 13 years was higher among male (9.0%) than female (3.4%) students; higher among white male (5.2%), black male (21.1%), and Hispanic male (11.1%) than white female (2.6%), black female (7.0%), and Hispanic female (2.9%) students, respectively; and higher among 9th-grade male (13.3%), 10th-grade male (8.6%), 11th-grade male (6.8%), and 12th-grade male (6.2%) than 9th-grade female (4.1%), 10th-grade female (3.9%), 11th-grade female (3.0%), and 12th-grade female (2.2%) students, respectively. Overall, the prevalence of having had sexual intercourse before age 13 years was higher among black (13.9%) and Hispanic (7.1%) than white (3.9%) students; higher among black (13.9%) than Hispanic (7.1%) students; higher among black female (7.0%) than white female (2.6%) and Hispanic female (2.9%) students; higher among black male (21.2%) and Hispanic male (11.1%) than white male (5.2%) students; and higher among black male (21.2%) than Hispanic male (11.1%) students. Overall, the prevalence of having had sexual intercourse before age 13 years was higher among 9th-grade (8.8%) than 10th-grade (6.3%), 11th-grade (4.9%), and 12th-grade (4.2%) students; higher among 10th-grade (6.3%) than 11th-grade (4.9%) and 12th-grade (4.2%) students; higher among 9th-grade female (4.1%) and 10th-grade female (3.9%) than 12th-grade female (2.2%) students; and higher among 9th-grade male (13.3%) than 10th-grade male (8.6%), 11th-grade male (6.8%), and 12th-grade male (6.2%) students. The prevalence of having had sexual intercourse before age 13 years ranged from 3.6% to 11.8% across state surveys (median: 5.0%) and from 4.9% to 15.6% across large urban school district surveys (median: 8.7%) (Table 64).
Among students nationwide, the prevalence of having had sexual intercourse for the first time before age 13 years decreased during 1991–2005 (10.2%–6.2%) and then did not change significantly during 2005–2011 (6.2%–6.2%). The prevalence of having had sexual intercourse for the first time before age 13 years also did not change significantly from 2009 (5.9%) to 2011 (6.2%).
Had Sexual Intercourse with Four or More Persons During Their Life
Nationwide, 15.3% of students had had sexual intercourse with four or more persons during their life (Table 65). Overall, the prevalence of having had sexual intercourse with four or more persons was higher among male (17.8%) than female (12.6%) students; higher among black male (32.6%) and Hispanic male (20.3%) than black female (17.5%) and Hispanic female (9.0%) students, respectively; and higher among 9th-grade male (12.4%), 10th-grade male (15.1%), and 11th-grade male (19.4%) than 9th-grade female (4.9%), 10th-grade female (9.4%), and 11th-grade female (15.2%) students, respectively. Overall, the prevalence of having had sexual intercourse with four or more persons was higher among black (24.8%) and Hispanic (14.8%) than white (13.1%) students; higher among black (24.8%) than Hispanic (14.8%) students; higher among black female (17.5%) than white female (12.8%) students; higher among white female (12.8%) and black female (17.5%) than Hispanic female (9.0%) students; higher among black male (32.6%) and Hispanic male (20.3%) than white male (13.3%) students; and higher among black male (32.6%) than Hispanic male (20.3%) students. Overall, the prevalence of having had sexual intercourse with four or more persons was higher among 10th-grade (12.3%), 11th-grade (17.3%), and 12th-grade (24.1%) than 9th-grade (8.7%) students; higher among 11th-grade (17.3%) and 12th-grade (24.1%) than 10th-grade (12.3%) students; higher among 12th-grade (24.1%) than 11th-grade (17.3%) students; higher among 10th-grade female (9.4%), 11th-grade female (15.2%), and 12th-grade female (22.8%) than 9th-grade female (4.9%) students; higher among 11th-grade female (15.2%) and 12th-grade female (22.8%) than 10th-grade female (9.4%) students; higher among 12th-grade female (22.8%) than 11th-grade female (15.2%) students; higher among 11th-grade male (19.4%) and 12th-grade male (25.5%) than 9th-grade male (12.4%) and 10th-grade male (15.1%) students; and higher among 12th-grade male (25.5%) than 11th-grade male (19.4%) students. The prevalence of having had sexual intercourse with four or more persons ranged from 8.0% to 22.8% across state surveys (median: 13.8%) and from 7.0% to 27.2% across large urban school district surveys (median: 17.0%) (Table 66).
Among students nationwide, the prevalence of having had sexual intercourse with four or more persons during their life decreased during 1991–2001 (18.7%–14.2%) and then did not change significantly during 2001–2011 (14.2%–15.3%). The prevalence of having had sexual intercourse with four or more persons during their life also did not change significantly from 2009 (13.8%) to 2011 (15.3%).
Currently Sexually Active
Nationwide, 33.7% of students had had sexual intercourse with at least one person during the 3 months before the survey (i.e., currently sexually active) (Table 65). The prevalence of being currently sexually active was higher among white female (35.0%), black male (46.0%), and Hispanic male (35.3%) than white male (30.0%), black female (36.9%), and Hispanic female (31.6%) students, respectively; and higher among 9th-grade male (23.6%) and 12th-grade female (50.7%) than 9th-grade female (19.0%) and 12th-grade male (44.4%) students, respectively. Overall, the prevalence of being currently sexually active was higher among black (41.3%) than white (32.4%) and Hispanic (33.5%) students; higher among black female (36.9%) than Hispanic female (31.6%) students; higher among black male (46.0%) and Hispanic male (35.3%) than white male (30.0%) students; and higher among black male (46.0%) than Hispanic male (35.3%) students. Overall, the prevalence of being currently sexually active was higher among 10th-grade (30.3%), 11th-grade (38.7%), and 12th-grade (47.5%) than 9th-grade (21.3%) students; higher among 11th-grade (38.7%) and 12th-grade (47.5%) than 10th-grade (30.3%) students; higher among 12th-grade (47.5%) than 11th-grade (38.7%) students; higher among 10th-grade female (31.4%), 11th-grade female (38.9%), and 12th-grade female (50.7%) than 9th-grade female (19.0%) students; higher among 11th-grade female (38.9%) and 12th-grade female (50.7%) than 10th-grade female (31.4%) students; higher among 12th-grade female (50.7%) than 11th-grade female (38.9%) students; higher among 10th-grade male (29.1%), 11th-grade male (38.5%), and 12th-grade male (44.4%) than 9th-grade male (23.6%) students; higher among 11th-grade male (38.5%) and 12th-grade male (44.4%) than 10th-grade male (29.1%) students; and higher among 12th-grade male (44.4%) than 11th-grade male (38.5%) students. The prevalence of being currently sexually active ranged from 23.9% to 44.1% across state surveys (median: 33.8%) and from 19.5% to 44.9% across large urban school district surveys (median: 34.6%) (Table 66).
During 1991–2011, among students nationwide, a significant linear decrease occurred in the prevalence of being currently sexually active (37.5%–33.7%). The prevalence of being currently sexually active did not change significantly from 2009 (34.2%) to 2011 (33.7%).
Condom Use
Among the 33.7% of currently sexually active students nationwide, 60.2% reported that either they or their partner had used a condom during last sexual intercourse (Table 67). Overall, the prevalence of having used a condom during last sexual intercourse was higher among male (67.0%) than female (53.6%) students; higher among white male (66.3%), black male (75.4%), and Hispanic male (63.4%) than white female (53.4%), black female (53.8%), and Hispanic female (53.0%) students, respectively; and higher among 9th-grade male (67.0%), 10th-grade male (69.9%), 11th-grade male (67.0%), and 12th-grade male (64.7%) than 9th-grade female (56.3%), 10th-grade female (56.7%), 11th-grade female (55.5%), and 12th-grade female (48.9%) students, respectively. Overall, the prevalence of having used a condom during last sexual intercourse was higher among black (65.3%) than Hispanic (58.4%) students and higher among black male (75.4%) than white male (66.3%) and Hispanic male (63.4%) students. Overall, the prevalence of having used a condom during last sexual intercourse was higher among 10th-grade (63.3%) and 11th-grade (61.1%) than 12th-grade (56.3%) students and higher among 10th-grade female (56.7%) and 11th-grade female (55.5%) than 12th-grade female (48.9%) students. The prevalence of having used a condom during last sexual intercourse ranged from 43.9% to 70.8% across state surveys (median: 59.9%) and from 52.9% to 75.1% across large urban school district surveys (median: 63.2%) (Table 68).
Among currently sexually active students nationwide, the prevalence of condom use increased during 1991–2003 (46.2%–63.0%) then did not change significantly during 2003–2011 (63.0%–60.2%). The prevalence of condom use also did not change significantly from 2009 (61.1%) to 2011 (60.2%).
Birth Control Pill Use
Among the 33.7% of currently sexually active students nationwide, 18.0% reported that either they or their partner had used birth control pills to prevent pregnancy before last sexual intercourse (Table 67). Overall, the prevalence of having used birth control pills before last sexual intercourse was higher among female (22.6%) than male (13.4%) students; higher among white female (30.9%) than white male (16.4%) students; and higher among 10th-grade female (20.8%), 11th-grade female (22.7%), and 12th-grade female (30.0%) than 10th-grade male (8.7%), 11th-grade male (12.3%), and 12th-grade male (19.7%) students, respectively. Overall, the prevalence of having used birth control pills before last sexual intercourse was higher among white (24.0%) than black (10.1%) and Hispanic (10.6%) students; higher among white female (30.9%) than black female (11.3%) and Hispanic female (10.4%) students; and higher among white male (16.4%) than black male (9.2%) and Hispanic male (10.8%) students. Overall, the prevalence of having used birth control pills before last sexual intercourse was higher among 10th-grade (14.9%), 11th-grade (17.5%), and 12th-grade (25.1%) than 9th-grade (9.4%) students; higher among 12th-grade (25.1%) than 10th-grade (14.9%) and 11th-grade (17.5%) students; higher among 10th-grade female (20.8%), 11th-grade female (22.7%), and 12th-grade female (30.0%) than 9th-grade female (8.3%) students; higher among 12th-grade female (30.0%) than 10th-grade female (20.8%) and 11th-grade female (22.7%) students; and higher among 12th-grade male (19.7%) than 9th-grade male (10.4%), 10th-grade male (8.7%), and 11th-grade male (12.3%) students. The prevalence of having used birth control pills before last sexual intercourse ranged from 11.3% to 35.7% across state surveys (median: 21.4%) and from 5.9% to 27.6% across large urban school district surveys (median: 10.5%) (Table 68).
Among students nationwide, the prevalence of having used birth control pills did not change significantly during 1991–2011 (20.8%–18.0%) or from 2009 (19.8%) to 2011 (18.0%).
Depo-Provera, Nuva Ring, Implanon, or Any IUD Use
Among the 33.7% of currently sexually active students nationwide, 5.3% reported that either they or their partner had used Depo-Provera (or any injectable birth control), Nuva Ring (or any birth control ring), Implanon (or any implant), or any IUD to prevent pregnancy before last sexual intercourse (Table 69). Overall, the prevalence of having used Depo-Provera, Nuva Ring, Implanon, or any IUD before last sexual intercourse was higher among female (7.5%) than male (3.2%) students; higher among white female (6.6%), black female (10.5%), and Hispanic female (6.9%) than white male (3.4%), black male (3.0%), and Hispanic male (2.5%) students, respectively; and higher among 9th-grade female (7.7%), 10th-grade female (7.4%), 11th-grade female (7.2%), and 12th-grade female (7.7%) than 9th-grade male (1.1%), 10th-grade male (3.5%), 11th-grade male (3.7%), and 12th-grade male (3.8%) students, respectively. The prevalence of having used Depo-Provera, Nuva Ring, Implanon, or any IUD before last sexual intercourse was higher among 10th-grade male (3.5%), 11th-grade male (3.7%), and 12th-grade male (3.8%) than 9th-grade male (1.1%) students. The prevalence of having used Depo-Provera, Nuva Ring, Implanon, or any IUD before last sexual intercourse ranged from 2.1% to 12.4% across state surveys (median: 5.9%) and from 1.0% to 14.9% across large urban school district surveys (median: 5.1%) (Table 70).
Birth Control Pill, Depo-Provera, Nuva Ring, Implanon, or Any IUD Use
Among the 33.7% of currently sexually active students nationwide, 23.3% reported that either they or their partner had used birth control pills, Depo-Provera, Nuva Ring, Implanon, or any IUD to prevent pregnancy before last sexual intercourse (Table 69). Overall, the prevalence of having used birth control pills, Depo-Provera, Nuva Ring, Implanon, or any IUD before last sexual intercourse was higher among female (30.0%) than male (16.6%) students; higher among white female (37.5%) and black female (21.8%) than white male (19.8%) and black male (12.2%) students, respectively; and higher among 10th-grade female (28.2%), 11th-grade female (29.9%), and 12th-grade female (37.6%) than 10th-grade male (12.2%), 11th-grade male (16.1%), and 12th-grade male (23.5%) students, respectively. Overall, the prevalence of having used birth control pills, Depo-Provera, Nuva Ring, Implanon, or any IUD before last sexual intercourse was higher among white (29.1%) than black (16.6%) and Hispanic (15.1%) students; higher among white female (37.5%) than black female (21.8%) and Hispanic female (17.2%) students; and higher among white male (19.8%) than black male (12.2%) and Hispanic male (13.3%) students. Overall, the prevalence of having used birth control pills, Depo-Provera, Nuva Ring, Implanon, or any IUD before last sexual intercourse was higher among 10th-grade (20.3%), 11th-grade (23.0%), and 12th-grade (31.0%) than 9th-grade (13.5%) students; higher among 12th-grade (31.0%) than 10th-grade (20.3%) and 11th-grade (23.0%) students; higher among 10th-grade female (28.2%), 11th-grade female (29.9%), and 12th-grade female (37.6%) than 9th-grade female (16.0%) students; higher among 12th-grade female (37.6%) than 10th-grade female (28.2%) and 11th-grade female (29.9%) students; and higher among 12th-grade male (23.5%) than 9th-grade male (11.6%), 10th-grade male (12.2%), and 11th-grade male (16.1%) students. The prevalence of having used birth control pills, Depo-Provera, Nuva Ring, Implanon, or any IUD before last sexual intercourse ranged from 15.7% to 42.3% across state surveys (median: 27.7%) and from 7.1% to 36.3% across large urban school district surveys (median: 16.5%) (Table 70).
Condom Use and Birth Control Pill, Depo-Provera, Nuva Ring, Implanon, or Any IUD Use
Among the 33.7% of currently sexually active students nationwide, 9.5% reported that either they or their partner had used both a condom during last sexual intercourse and birth control pills, Depo-Provera, Nuva Ring, Implanon, or any IUD to prevent pregnancy before last sexual intercourse (Table 71). Overall, the prevalence of having used both a condom during last sexual intercourse and birth control pills, Depo-Provera, Nuva Ring, Implanon, or any IUD before last sexual intercourse was higher among female (12.4%) than male (6.6%) students; higher among white female (15.9%) than white male (7.8%) students; and higher among 10th-grade female (14.4%), 11th-grade female (12.6%), and 12th-grade female (13.4%) than 10th-grade male (5.6%), 11th-grade male (7.0%), and 12th-grade male (8.3%) students, respectively. Overall, the prevalence of having used both a condom during last sexual intercourse and birth control pills, Depo-Provera, Nuva Ring, Implanon, or any IUD before last sexual intercourse was higher among white (12.1%) than black (7.3%) and Hispanic (5.3%) students; higher among white female (15.9%) than black female (9.1%) and Hispanic female (6.1%) students; and higher among white male (7.8%) than Hispanic male (4.5%) students. Overall, the prevalence of having used both a condom during last sexual intercourse and birth control pills, Depo-Provera, Nuva Ring, Implanon, or any IUD before last sexual intercourse was higher among 10th-grade (10.0%), 11th-grade (9.8%), and 12th-grade (11.0%), than 9th-grade (5.6%) students; higher among 10th-grade female (14.4%), 11th-grade female (12.6%), and 12th-grade female (13.4%) than 9th-grade female (6.9%) students; and higher among 12th-grade male (8.3%) than 9th-grade male (4.4%) students. The prevalence of having used both a condom during last sexual intercourse and birth control pills, Depo-Provera, Nuva Ring, Implanon, or any IUD before last sexual intercourse ranged from 5.5% to 17.5% across state surveys (median: 10.5%) and from 2.2% to 12.6% across large urban school district surveys (median: 5.9%) (Table 72).
Did Not Use Any Method to Prevent Pregnancy
Among the 33.7% of currently sexually active students nationwide, 12.9% had not used any method to prevent pregnancy during last sexual intercourse (Table 71). Overall, the prevalence of not having used any method to prevent pregnancy was higher among female (15.1%) than male (10.6%) students; higher among white female (11.7%), black female (17.5%), and Hispanic female (22.6%) than white male (8.3%), black male (9.9%), and Hispanic male (14.7%) students, respectively; and higher among 9th-grade female (22.3%) and 12th-grade female (13.3%) than 9th-grade male (13.1%) and 12th-grade male (8.1%) students, respectively. Overall, the prevalence of not having used any method to prevent pregnancy was higher among black (13.3%) and Hispanic (18.5%) than white (10.0%) students; higher among Hispanic (18.5%) than black (13.3%) students; higher among black female (17.5%) and Hispanic female (22.6%) than white female (11.7%) students; and higher among Hispanic male (14.7%) than white male (8.3%) and black male (9.9%) students. Overall, the prevalence of not having used any method to prevent pregnancy was higher among 9th-grade (17.3%) than 11th-grade (12.0%) and 12th-grade (10.9%) students; higher among 9th-grade female (22.3%) than 11th-grade female (12.7%) and 12th-grade female (13.3%) students; and higher among 11th-grade male (11.4%) than 12th-grade male (8.1%) students. The prevalence of not having used any method to prevent pregnancy ranged from 6.3% to 20.0% across state surveys (median: 12.2%) and from 10.3% to 25.0% across large urban school district surveys (median: 15.2%) (Table 72).
During 1991–2011, among currently sexually active students nationwide, a significant linear decrease occurred in the prevalence of not having used any method to prevent pregnancy (16.5%–12.9%). The prevalence of not having used any method to prevent pregnancy did not change significantly from 2009 (11.9%) to 2011 (12.9%).
Drank Alcohol or Used Drugs Before Last Sexual Intercourse
Among the 33.7% of currently sexually active students nationwide, 22.1% had drunk alcohol or used drugs before last sexual intercourse (Table 73). Overall, the prevalence of having drunk alcohol or used drugs before last sexual intercourse was higher among male (26.0%) than female (18.1%) students; higher among white male (28.4%) and Hispanic male (25.6%) than white female (18.7%) and Hispanic female (17.4%) students, respectively; and higher among 10th-grade male (23.8%) and 12th-grade male (31.2%) than 10th-grade female (16.8%) and 12th-grade female (17.9%) students, respectively. Overall, the prevalence of having drunk alcohol or used drugs before last sexual intercourse was higher among white (23.4%) than black (18.1%) students and higher among white male (28.4%) and Hispanic male (25.6%) than black male (19.0%) students. The prevalence of having drunk alcohol or used drugs before last sexual intercourse was higher among 12th-grade male (31.2%) than 10th-grade male (23.8%) and 11th-grade male (23.3%) students. The prevalence of having drunk alcohol or used drugs before last sexual intercourse ranged from 16.0% to 26.7% across state surveys (median: 20.6%) and from 14.6% to 27.0% across large urban school district surveys (median: 21.1%) (Table 74).
Among currently sexually active students nationwide, the prevalence of having drunk alcohol or used drugs before last sexual intercourse increased during 1991–2001 (21.6%–25.6%) and then decreased during 2001–2011 (25.6%–22.1%). The prevalence of having drunk alcohol or used drugs before last sexual intercourse did not change significantly from 2009 (21.6%) to 2011 (22.1%).
Were Taught in School About AIDS or HIV Infection
Nationwide, 84.0% of students had ever been taught in school about AIDS or HIV infection (Table 73). Overall, the prevalence of having been taught in school about AIDS or HIV infection was higher among white (86.0%) and black (87.1%) than Hispanic (77.5%) students; higher among white female (85.3%) and black female (87.9%) than Hispanic female (76.9%) students; and higher among white male (86.6%) and black male (86.2%) than Hispanic male (78.1%) students. Overall, the prevalence of having been taught in school about AIDS or HIV infection was higher among 11th-grade (85.4%) and 12th-grade (86.1%) than 9th-grade (81.1%) students; higher among 10th-grade female (84.8%) and 12th-grade female (85.1%) than 9th-grade female (80.8%) students; and higher among 11th-grade male (86.5%) and 12th-grade male (86.9%) than 9th-grade male (81.5%) students. The prevalence of having been taught in school about AIDS or HIV infection ranged from 74.9% to 91.4% across state surveys (median: 83.7%) and from 72.9% to 87.3% across large urban school district surveys (median: 81.5%) (Table 74).
Among students nationwide, the prevalence of having been taught in school about AIDS or HIV increased during 1991–1997 (83.3%–91.5%) and then decreased during 1997–2011 (91.5%–84.0%). The prevalence of having ever been taught in school about AIDS or HIV infection also decreased from 2009 (87.0%) to 2011 (84.0%).
Tested for HIV
Nationwide, 12.9% of students had been tested for HIV, not counting tests done when donating blood (Table 75). Overall, the prevalence of having been tested for HIV was higher among female (14.6%) than male (11.2%) students; higher among white female (12.6%) than white male (8.7%) students; and higher among 10th-grade female (13.1%), 11th-grade female (16.9%), and 12th-grade female (19.1%) than 10th-grade male (9.7%), 11th-grade male (10.3%), and 12th-grade male (14.6%) students, respectively. Overall, the prevalence of having been tested for HIV was higher among black (24.0%) and Hispanic (12.5%) than white (10.6%) students; higher among black (24.0%) than Hispanic (12.5%) students; higher among black female (24.2%) than white female (12.6%) and Hispanic female (14.0%) students; and higher among black male (23.7%) than white male (8.7%) and Hispanic male (11.0%) students. Overall, the prevalence of having been tested for HIV was higher among 11th-grade (13.5%) and 12th-grade (16.9%) than 9th-grade (10.3%) students; higher among 12th-grade (16.9%) than 10th-grade (11.3%) and 11th-grade (13.5%) students; higher among 11th-grade female (16.9%) and 12th-grade female (19.1%) than 9th-grade female (10.2%) and 10th-grade female (13.1%) students; and higher among 12th-grade male (14.6%) than 9th-grade male (10.3%), 10th-grade male (9.7%), and 11th-grade male (10.3%) students.
Among students nationwide, the prevalence of having been tested for HIV did not change significantly during 2005–2011 (11.9%–12.9%) or from 2009 (12.7%) to 2011 (12.9%).
Dietary Behaviors
Did Not Eat Fruit or Drink 100% Fruit Juices
Nationwide, 4.8% of students had not eaten fruit or drunk 100% fruit juices during the 7 days before the survey (Table 76). Overall, the prevalence of having not eaten fruit or drunk 100% fruit juices was higher among male (5.3%) than female (4.3%) students and higher among white male (5.2%) than white female (3.8%) students. Overall, the prevalence of not having eaten fruit or drunk 100% fruit juices was higher among black (6.5%) than white (4.5%) and Hispanic (4.5%) students and higher among black female (6.3%) than white female (3.8%) and Hispanic female (4.0%) students. The prevalence of having not eaten fruit or drunk 100% fruit juices ranged from 2.8% to 10.3% across state surveys (median: 6.1%) and from 3.8% to 9.7% across large urban school district surveys (median: 6.7%) (Table 77).
Among students nationwide, the prevalence of having not eaten fruit or drunk 100% fruit juices did not change significantly during 1999–2003 (5.4%–6.1%) and then decreased during 2003–2011 (6.1%–4.8%). The prevalence of having not eaten fruit or drunk 100% fruit juices did not change significantly from 2009 (5.1%) to 2011 (4.8%).
Ate Fruit or Drank 100% Fruit Juices One or More Times per Day
Nationwide, 64.0% of students had eaten fruit or drunk 100% fruit juices one or more times per day during the 7 days before the survey (Table 76). Overall, the prevalence of having eaten fruit or drunk 100% fruit juices one or more times per day was higher among male (66.1%) than female (61.6%) students; higher among black male (67.1%) and Hispanic male (68.9%) than black female (60.2%) and Hispanic female (60.3%) students, respectively; and higher among 9th-grade male (66.2%) and 10th-grade male (68.7%) than 9th-grade female (60.3%) and 10th-grade female (63.1%) students, respectively. The prevalence of having eaten fruit or drunk 100% fruit juices one or more times per day was higher among Hispanic male (68.9%) than white male (64.8%) students. Overall, the prevalence of having eaten fruit or drunk 100% fruit juices one or more times per day was higher among 10th-grade (66.0%) than 12th-grade (62.1%) students and higher among 10th-grade male (68.7%) than 12th-grade male (63.1%) students. The prevalence of having eaten fruit or drunk 100% fruit juices one or more times per day ranged from 49.4% to 69.3% across state surveys (median: 60.5%) and from 47.1% to 68.4% across large urban school district surveys (median: 61.8%) (Table 77).
Among students nationwide, the prevalence of having eaten fruit or drunk 100% fruit juices one or more times per day did not change significantly during 1999–2005 (62.6%–59.9%) and then increased during 2005–2011 (59.9%–64.0%). The prevalence of having eaten fruit or drunk 100% fruit juices one or more times per day did not change significantly from 2009 (64.8%) to 2011 (64.0%).
Ate Fruit or Drank 100% Fruit Juices Two or More Times per Day
Nationwide, 34.0% of students had eaten fruit or drunk 100% fruit juices two or more times per day during the 7 days before the survey (Table 78). Overall, the prevalence of having eaten fruit or drunk 100% fruit juices two or more times per day was higher among male (36.5%) than female (31.2%) students; higher among white male (34.8%), black male (40.0%), and Hispanic male (40.0%) than white female (30.6%), black female (34.5%), and Hispanic female (30.9%) students, respectively; and higher among 9th-grade male (39.3%) and 12th-grade male (34.9%) than 9th-grade female (30.7%) and 12th-grade female (29.3%) students, respectively. Overall, the prevalence of having eaten fruit or drunk 100% fruit juices two or more times per day was higher among black (37.2%) than white (32.8%) students and higher among Hispanic male (40.0%) than white male (34.8%) students. Overall, the prevalence of having eaten fruit or drunk 100% fruit juices two or more times per day was higher among 10th-grade (35.4%) than 11th-grade (32.6%) and 12th-grade (32.2%) students; higher among 10th-grade female (33.3%) than 12th-grade female (29.3%) students; and higher among 9th-grade male (39.3%) than 11th-grade male (34.0%) and 12th-grade male (34.9%) students. The prevalence of having eaten fruit or drunk 100% fruit juices two or more times per day ranged from 23.0% to 36.8% across state surveys (median: 30.2%) and from 26.6% to 39.2% across large urban school district surveys (median: 34.3%) (Table 79).
Among students nationwide, the prevalence of having eaten fruits or drunk 100% fruit juices two or more times per day decreased during 1999–2005 (34.8%–30.1%) and then increased during 2005–2011 (30.1%–34.0%). The prevalence of having eaten fruits or drunk 100% fruit juices two or more times per day did not change significantly from 2009 (33.9%) to 2011 (34.0%).
Ate Fruit or Drank 100% Fruit Juices Three or More Times per Day
Nationwide, 22.4% of students had eaten fruit or drunk 100% fruit juices three or more times per day during the 7 days before the survey (Table 78). Overall, the prevalence of having eaten fruit or drunk 100% fruit juices three or more times per day was higher among male (24.8%) than female (19.8%) students; higher among white male (22.3%), black male (30.3%), and Hispanic male (27.6%) than white female (17.4%), black female (25.6%), and Hispanic female (21.8%) students, respectively; and higher among 9th-grade male (27.2%) and 12th-grade male (23.2%) than 9th-grade female (19.4%) and 12th-grade female (18.1%) students, respectively. Overall, the prevalence of having eaten fruit or drunk 100% fruit juices three or more times per day was higher among black (27.9%) and Hispanic (24.8%) than white (20.0%) students; higher among black (27.9%) than Hispanic (24.8%) students; higher among black female (25.6%) and Hispanic female (21.8%) than white female (17.4%) students; higher among black female (25.6%) than Hispanic female (21.8%) students; and higher among black male (30.3%) and Hispanic male (27.6%) than white male (22.3%) students. Overall, the prevalence of having eaten fruit or drunk 100% fruit juices three or more times per day was higher among 10th-grade (24.2%) than 11th-grade (20.7%) and 12th-grade (20.7%) students; higher among 10th-grade female (22.0%) than 12th-grade female (18.1%) students; higher among 9th-grade male (27.2%) than 11th-grade male (21.7%) and 12th-grade male (23.2%) students; and higher among 10th-grade male (26.3%) than 11th-grade male (21.7%) students. The prevalence of having eaten fruit or drunk 100% fruit juices three or more times per day ranged from 13.7% to 25.6% across state surveys (median: 19.3%) and from 19.6% to 29.6% across large urban school district surveys (median: 24.4%) (Table 79).
Among students nationwide, the prevalence of having eaten fruit or drunk 100% fruit juices three or more times per day decreased during 1999–2005 (24.9%–19.8%) and then increased during 2005–2011 (19.8%–22.4%). The prevalence of having eaten fruit or drunk 100% fruit juices three or more times per day did not change significantly from 2009 (22.9%) to 2011 (22.4%).
Did Not Eat Vegetables
Nationwide, 5.7% of students had not eaten vegetables** during the 7 days before the survey (Table 80). Overall, the prevalence of not having eaten vegetables was higher among male (6.9%) than female (4.5%) students; higher among white male (5.5%) than white female (2.4%) students; and higher among 9th-grade male (8.1%), 10th-grade male (5.9%), and 11th-grade male (8.2%) than 9th-grade female (5.0%), 10th-grade female (3.7%), and 11th-grade female (4.6%) students, respectively. Overall, the prevalence of not having eaten vegetables was higher among black (9.9%) and Hispanic (8.2%) than white (4.0%) students; higher among black female (8.6%) and Hispanic female (8.1%) than white female (2.4%) students; and higher among black male (11.1%) and Hispanic male (8.2%) than white male (5.5%) students. Overall, the prevalence of not having eaten vegetables was higher among 9th-grade (6.6%) and 11th-grade (6.4%) than 10th-grade (4.9%) and 12th-grade (4.8%) students; higher among 9th-grade male (8.1%) than 10th-grade male (5.9%) and 12th-grade male (5.2%) students; and higher among 11th-grade male (8.2%) than 12th-grade male (5.2%) students. The prevalence of not having eaten vegetables ranged from 3.0% to 12.2% across state surveys (median: 5.8%) and from 4.9% to 12.5% across large urban school district surveys (median: 8.8%) (Table 81).
Among students nationwide, the prevalence of not having eaten vegetables increased during 1999–2005 (4.2%–6.0%) and then did not change significantly during 2005–2011 (6.0%–5.7%). The prevalence of not having eaten vegetables also did not change significantly from 2009 (6.0%) to 2011 (5.7%).
Ate Vegetables One or More Times per Day
Nationwide, 62.3% of students had eaten vegetables one or more times per day during the 7 days before the survey (Table 80). The prevalence of having eaten vegetables one or more times per day was higher among Hispanic male (58.9%) than Hispanic female (53.8%) students. Overall, the prevalence of having eaten vegetables one or more times per day was higher among white (65.7%) than black (54.3%) and Hispanic (56.4%) students; higher among white female (66.1%) than black female (52.7%) and Hispanic female (53.8%) students; and higher among white male (65.3%) than black male (55.9%) and Hispanic male (58.9%) students. The prevalence of having eaten vegetables one or more times per day ranged from 49.9% to 73.6% across state surveys (median: 61.1%) and from 45.9% to 69.1% across large urban school district surveys (median: 55.1%) (Table 81).
Among students nationwide, the prevalence of having eaten vegetables one or more times per day did not change significantly during 1999–2011 (64.5%–62.3%) or from 2009 (62.7%) to 2011 (62.3%).
Ate Vegetables Two or More Times per Day
Nationwide, 28.3% of students had eaten vegetables two or more times per day during the 7 days before the survey (Table 82). Overall, the prevalence of having eaten vegetables two or more times per day was higher among male (30.2%) than female (26.1%) students; higher among white male (30.9%) and Hispanic male (29.7%) than white female (27.2%) and Hispanic female (23.8%) students, respectively; higher among 9th-grade male (30.6%), 10th-grade male (30.0%), and 12th-grade male (31.4%) than 9th-grade female (26.5%), 10th-grade female (25.3%), and 12th-grade female (24.3%) students, respectively. Overall, the prevalence of having eaten vegetables two or more times per day was higher among white (29.1%) than black (24.9%) students and higher among white female (27.2%) than black female (23.2%) and Hispanic female (23.8%) students. The prevalence of having eaten vegetables two or more times per day was higher among 11th-grade female (28.4%) than 10th-grade female (25.3%) students. The prevalence of having eaten vegetables two or more times per day ranged from 19.0% to 36.8% across state surveys (median: 26.6%) and from 19.3% to 34.9% across large urban school district surveys (median: 25.6%) (Table 83).
Among students nationwide, the prevalence of having eaten vegetables two or more times per day did not change significantly during 1999–2011 (28.5%–28.3%) or from 2009 (27.6%) to 2011 (28.3%).
Ate Vegetables Three or More Times per Day
Nationwide, 15.3% of students had eaten vegetables three or more times per day during the 7 days before the survey (Table 82). Overall, the prevalence of having eaten vegetables three or more times per day was higher among male (16.6%) than female (13.9%) students; higher among white male (15.5%) and Hispanic male (18.1%) than white female (13.3%) and Hispanic female (13.7%) students, respectively; and higher among 9th-grade male (18.3%) and 12th-grade male (16.7%) than 9th-grade female (14.1%) and 12th-grade female (13.3%) students, respectively. The prevalence of having eaten vegetables three or more times per day ranged from 9.0% to 18.7% across state surveys (median: 13.2%) and from 9.1% to 18.5% across large urban school district surveys (median: 14.1%) (Table 83).
Among students nationwide, the prevalence of having eaten vegetables three or more times per day did not change significantly during 1999–2011 (14.0%–15.3%). The prevalence of having eaten vegetables three or more times per day increased from 2009 (13.8%) to 2011 (15.3%).
Did Not Drink Milk
Nationwide, 17.3% of students had not drunk milk during the 7 days before the survey (Table 84). Overall, the prevalence of not having drunk milk was higher among female (23.0%) than male (11.8%) students; higher among white female (19.6%), black female (38.6%), and Hispanic female (21.9%) than white male (9.7%), black male (21.8%), and Hispanic male (12.3%) students, respectively; and higher among 9th-grade female (20.3%), 10th-grade female (21.2%), 11th-grade female (24.4%), and 12th-grade female (26.9%) than 9th-grade male (10.6%), 10th-grade male (11.3%), 11th-grade male (13.4%), and 12th-grade male (12.0%) students, respectively. Overall, the prevalence of not having drunk milk was higher among black (30.4%) than white (14.5%) and Hispanic (16.9%) students; higher among black female (38.6%) than white female (19.6%) and Hispanic female (21.9%) students; higher among black male (21.8%) and Hispanic male (12.3%) than white male (9.7%) students; and higher among black male (21.8%) than Hispanic male (12.3%) students. Overall, the prevalence of not having drunk milk was higher among 11th-grade (18.8%) and 12th-grade (19.3%) than 9th-grade (15.4%) students; higher among 11th-grade (18.8%) than 10th-grade (16.1%) students; higher among 11th-grade female (24.4%) and 12th-grade female (26.9%) than 9th-grade female (20.3%) students; higher among 12th-grade female (26.9%) than 10th-grade female (21.2%) students; and higher among 11th-grade male (13.4%) than 9th-grade male (10.6%) students.
Among students nationwide, the prevalence of not having drunk milk did not change significantly during 1999–2011 (17.0%–17.3%) or from 2009 (17.3%) to 2011 (17.3%).
Drank One or More Glasses per Day of Milk
Nationwide, 44.4% of students had drunk one or more glasses per day of milk during the 7 days before the survey (Table 84). Overall, the prevalence of having drunk one or more glasses per day of milk was higher among male (53.4%) than female (34.8%) students; higher among white male (58.1%), black male (38.5%), and Hispanic male (47.3%) than white female (39.0%), black female (20.0%), and Hispanic female (33.6%) students, respectively; and higher among 9th-grade male (56.9%), 10th-grade male (54.5%), 11th-grade male (52.4%), and 12th-grade male (49.0%) than 9th-grade female (36.5%), 10th-grade female (39.0%), 11th-grade female (32.3%), and 12th-grade female (30.8%) students, respectively. Overall, the prevalence of having drunk one or more glasses per day of milk was higher among white (48.8%) than black (29.0%) and Hispanic (40.7%) students; higher among Hispanic (40.7%) than black (29.0%) students; higher among white female (39.0%) than black female (20.0%) and Hispanic female (33.6%) students; higher among Hispanic female (33.6%) than black female (20.0%) students; higher among white male (58.1%) than black male (38.5%) and Hispanic male (47.3%) students; and higher among Hispanic male (47.3%) than black male (38.5%) students. Overall, the prevalence of having drunk one or more glasses per day of milk was higher among 9th-grade (46.8%) and 10th-grade (47.1%) than 11th-grade (42.5%) and 12th-grade (40.2%) students; higher among 9th-grade female (36.5%) and 10th-grade female (39.0%) than 11th-grade female (32.3%) and 12th-grade female (30.8%) students; higher among 9th-grade male (56.9%) than 11th-grade male (52.4%) and 12th-grade male (49.0%) students; and higher among 10th-grade male (54.5%) than 12th-grade male (49.0%) students.
Among students nationwide, the prevalence of having drunk one or more glasses per day of milk did not change significantly during 1999–2011 (47.1%–44.4%) or from 2009 (43.9%) to 2011 (44.4%).
Drank Two or More Glasses per Day of Milk
Nationwide, 29.9% of students had drunk two or more glasses per day of milk during the 7 days before the survey (Table 85). Overall, the prevalence of having drunk two or more glasses per day of milk was higher among male (37.6%) than female (21.6%) students; higher among white male (42.2%), black male (25.5%), and Hispanic male (32.6%) than white female (24.5%), black female (10.4%), and Hispanic female (20.9%) students, respectively; and higher among 9th-grade male (41.1%), 10th-grade male (39.5%), 11th-grade male (35.7%), and 12th-grade male (33.4%) than 9th-grade female (24.6%), 10th-grade female (24.5%), 11th-grade female (18.8%), and 12th-grade female (17.8%) students, respectively. Overall, the prevalence of having drunk two or more glasses per day of milk was higher among white (33.6%) than black (17.7%) and Hispanic (27.0%) students; higher among Hispanic (27.0%) than black (17.7%) students; higher among white female (24.5%) and Hispanic female (20.9%) than black female (10.4%) students; higher among white male (42.2%) than black male (25.5%) and Hispanic male (32.6%) students; and higher among Hispanic male (32.6%) than black male (25.5%) students. Overall, the prevalence of having drunk two or more glasses per day of milk was higher among 9th-grade (32.9%) and 10th-grade (32.3%) than 11th-grade (27.4%) and 12th-grade (25.8%) students; higher among 9th-grade female (24.6%) and 10th-grade female (24.5%) than 11th-grade female (18.8%) and 12th-grade female (17.8%) students; higher among 9th-grade male (41.1%) than 11th-grade male (35.7%) and 12th-grade male (33.4%) students; and higher among 10th-grade male (39.5%) than 12th-grade male (33.4%) students.
During 1999–2011, among students nationwide, a significant linear decrease occurred in the prevalence of having drunk two or more glasses per day of milk (33.6%–29.9%). The prevalence of having drunk two or more glasses per day of milk did not change significantly from 2009 (28.8%) to 2011 (29.9%).
Drank Three or More Glasses per Day of Milk
Nationwide, 14.9% of students had drunk three or more glasses per day of milk during the 7 days before the survey (Table 85). Overall, the prevalence of having drunk three or more glasses per day of milk was higher among male (20.0%) than female (9.3%) students; higher among white male (22.9%), black male (13.0%), and Hispanic male (16.6%) than white female (9.9%), black female (6.3%), and Hispanic female (9.9%) students, respectively; and higher among 9th-grade male (22.5%), 10th-grade male (21.0%), 11th-grade male (17.2%), and 12th-grade male (18.4%) than 9th-grade female (11.8%), 10th-grade female (11.0%), 11th-grade female (7.4%), and 12th-grade female (6.5%) students, respectively. Overall, the prevalence of having drunk three or more glasses per day of milk was higher among white (16.6%) than black (9.5%) and Hispanic (13.4%) students; higher among Hispanic (13.4%) than black (9.5%) students; higher among white female (9.9%) and Hispanic female (9.9%) than black female (6.3%) students; higher among white male (22.9%) than black male (13.0%) and Hispanic male (16.6%) students; and higher among Hispanic male (16.6%) than black male (13.0%) students. Overall, the prevalence of having drunk three or more glasses per day of milk was higher among 9th-grade (17.2%) and 10th-grade (16.2%) than 11th-grade (12.4%) and 12th-grade (12.6%) students; higher among 9th-grade female (11.8%) and 10th-grade female (11.0%) than 11th-grade female (7.4%) and 12th-grade female (6.5%) students; higher among 9th-grade male (22.5%) than 11th-grade male (17.2%) and 12th-grade male (18.4%) students; and higher among 10th-grade male (21.0%) than 11th-grade male (17.2%) students.
During 1999–2011, among students nationwide, a significant linear decrease occurred in the prevalence of having drunk three or more glasses per day of milk (18.0%–14.9%). The prevalence of having drunk three or more glasses per day of milk did not change significantly from 2009 (14.5%) to 2011 (14.9%).
Did Not Drink Soda or Pop
Nationwide, 20.9% of students had not drunk soda or pop (not counting diet soda or diet pop) during the 7 days before the survey (Table 86). Overall, the prevalence of not having drunk soda or pop was higher among female (23.6%) than male (18.4%) students; higher among white female (25.9%) than white male (17.6%) students; and higher among 9th-grade female (19.3%), 10th-grade female (22.9%), 11th-grade female (26.9%), and 12th-grade female (26.2%) than 9th-grade male (16.0%), 10th-grade male (17.9%), 11th-grade male (20.0%), and 12th-grade male (20.5%) students, respectively. Overall, the prevalence of not having drunk soda or pop was higher among white (21.6%) than black (18.8%) students and higher among white female (25.9%) than black female (18.5%) and Hispanic female (20.8%) students. Overall, the prevalence of not having drunk soda or pop was higher among 10th-grade (20.3%), 11th-grade (23.4%), and 12th-grade (23.3%) than 9th-grade (17.6%) students; higher among 11th-grade (23.4%) and 12th-grade (23.3%) than 10th-grade (20.3%) students; higher among 11th-grade female (26.9%) and 12th-grade female (26.2%) than 9th-grade female (19.3%) students; and higher among 11th-grade male (20.0%) and 12th-grade male (20.5%) than 9th-grade male (16.0%) students. The prevalence of not having drunk soda or pop ranged from 14.3% to 32.9% across state surveys (median: 21.6%) and from 13.4% to 32.2% across large urban school district surveys (median: 20.9%) (Table 87).
Among students nationwide, the prevalence of not having drunk soda or pop did not change significantly during 2007–2011 (18.6%–20.9%) or from 2009 (19.4%) to 2011 (20.9%).
Drank Soda or Pop One or More Times per Day
Nationwide, 27.8% of students had drunk a can, bottle, or glass of soda or pop (not counting diet soda or diet pop) one or more times per day during the 7 days before the survey (Table 86). Overall, the prevalence of having drunk soda or pop one or more times per day was higher among male (31.4%) than female (24.0%) students; higher among white male (34.0%) than white female (23.2%) students; and higher among 9th-grade male (32.8%), 10th-grade male (29.6%), 11th-grade male (31.7%), and 12th-grade male (31.2%) than 9th-grade female (26.4%), 10th-grade female (24.7%), 11th-grade female (21.2%), and 12th-grade female (22.7%) students, respectively. The prevalence of having drunk soda or pop at least one or more times per day was higher among white male (34.0%) than Hispanic male (28.0%) students. The prevalence of having drunk soda or pop at least one time per day was higher among 9th-grade female (26.4%) than 11th-grade female (21.2%) students. The prevalence of having drunk soda or pop one or more times per day ranged from 14.3% to 40.9% across state surveys (median: 26.0%) and from 12.7% to 38.9% across large urban school district surveys (median: 24.6%) (Table 87).
During 2007–2011, among students nationwide, a significant linear decrease occurred in the prevalence of having drunk soda or pop one or more times per day (33.8%–27.8%). The prevalence of having drunk soda or pop one or more times per day did not change significantly from 2009 (29.2%) to 2011 (27.8%).
Drank Soda or Pop Two or More Times per Day
Nationwide, 19.0% of students had drunk a can, bottle, or glass of soda or pop (not counting diet soda or diet pop) two or more times per day during the 7 days before the survey (Table 88). Overall, the prevalence of having drunk soda or pop two or more times per day was higher among male (21.8%) than female (16.1%) students; higher among white male (22.9%) than white female (14.8%) students; and higher among 9th-grade male (22.6%), 11th-grade male (22.1%), and 12th-grade male (22.5%) than 9th-grade female (17.8%), 11th-grade female (13.4%), and 12th-grade female (14.9%) students, respectively. Overall, the prevalence of having drunk soda or pop two or more times per day was higher among black (22.2%) than Hispanic (18.0%) students; higher among black female (21.1%) than white female (14.8%) and Hispanic female (16.8%) students; and higher among white male (22.9%) and black male (19.0%) than Hispanic male (19.0%) students. The prevalence of having drunk soda or pop two or more times per day was higher among 9th-grade female (17.8%) and 10th-grade female (17.6%) than 11th-grade female (13.4%) students. The prevalence of having drunk soda or pop two or more times per day ranged from 8.4% to 31.7% across state surveys (median: 17.5%) and from 8.1% to 31.5% across large urban school district surveys (median: 17.9%) (Table 89).
During 2007–2011, among students nationwide, a significant linear decrease occurred in the prevalence of having drunk soda or pop two or more times per day (24.4%–19.0%). The prevalence of having drunk soda or pop two or more times per day did not change significantly from 2009 (19.7%) to 2011 (19.0%).
Drank Soda or Pop Three or More Times per Day
Nationwide, 11.3% of students had drunk a can, bottle, or glass of soda or pop (not counting diet soda or diet pop) three or more times per day during the 7 days before the survey (Table 88). Overall, the prevalence of having drunk soda or pop three or more times per day was higher among male (13.2%) than female (9.3%) students; higher among white male (13.2%) and Hispanic male (11.8%) than white female (8.1%) and Hispanic female (9.3%) students, respectively; and higher among 9th-grade male (14.2%), 11th-grade male (13.1%), and 12th-grade male (12.9%) than 9th-grade female (10.7%), 11th-grade female (7.5%), and 12th-grade female (8.1%) students, respectively. Overall, the prevalence of having drunk soda or pop three or more times per day was higher among black (14.6%) than white (10.7%) and Hispanic (10.6%) students; higher among black female (13.0%) than white female (8.1%) and Hispanic female (9.3%) students; and higher among black male (16.2%) than Hispanic male (11.8%) students. Overall, the prevalence of having drunk soda or pop three or more times per day was higher among 9th-grade (12.5%) than 11th-grade (10.3%) students and higher among 9th-grade female (10.7%) and 10th-grade female (10.3%) than 11th-grade female (7.5%) students. The prevalence of having drunk soda or pop three or more times per day ranged from 4.5% to 19.5% across state surveys (median: 9.1%) and from 4.7% to 20.4% across large urban school district surveys (median: 11.0%) (Table 89).
During 2007–2011, among students nationwide, a significant linear decrease occurred in the prevalence of having drunk soda or pop three or more times per day (14.4%–11.3%). The prevalence of having drunk soda or pop three or more times per day did not change significantly from 2009 (11.2%) to 2011 (11.3%).
Ate Breakfast on 0 Days
Nationwide, 13.1% of students had eaten breakfast on 0 days during the 7 days before the survey (Table 90). Overall, the prevalence of having eaten breakfast on 0 days was higher among female (13.9%) than male (12.3%) students; higher among white female (12.8%) and black female (19.0%) than white male (11.2%) and black male (12.9%) students, respectively; and higher among 9th-grade female (14.7%) and 10th-grade female (14.5%) than 9th-grade male (11.3%) and 10th-grade male (11.4%) students, respectively. Overall, the prevalence of having eaten breakfast on 0 days was higher among black (16.1%) and Hispanic (14.4%) than white (12.0%) students; higher among black female (19.0%) than white female (12.8%) and Hispanic female (14.6%) students; and higher among Hispanic male (14.1%) than white male (11.2%) students. The prevalence of having eaten breakfast on 0 days was higher among 11th-grade male (14.3%) than 9th-grade male (11.3%) students.
Ate Breakfast on All 7 Days
Nationwide, 37.7% of students had eaten breakfast on all 7 days before the survey (Table 90). Overall, the prevalence of having eaten breakfast on all 7 days was higher among male (41.0%) than female (34.3%) students; higher among white male (42.1%), black male (35.7%), and Hispanic male (42.5%) than white female (37.1%), black female (26.9%), and Hispanic female (31.4%) students, respectively; and higher among 9th-grade male (47.1%) and 10th-grade male (43.2%) than 9th-grade female (32.6%) and 10th-grade female (33.3%) students, respectively. Overall, the prevalence of having eaten breakfast on all 7 days was higher among white (39.7%) and Hispanic (37.1%) than black (31.2%) students; higher among white female (37.1%) than black female (26.9%) and Hispanic female (31.4%) students; and higher among white male (42.1%) and Hispanic male (42.5%) than black male (35.7%) students. Overall, the prevalence of having eaten breakfast on all 7 days was higher among 9th-grade (39.9%), 10th-grade (38.4%), and 11th-grade (37.9%) than 12th-grade (34.2%) students; higher among 11th-grade female (37.9%) than 9th-grade female (32.6%), 10th-grade female (33.3%), and 12th-grade female (33.4%) students; and higher among 9th-grade male (47.1%) and 10th-grade male (43.2%) than 11th-grade male (37.9%) and 12th-grade male (35.0%) students.
Physical Activity
Did Not Participate in at Least 60 Minutes of Physical Activity on Any Day††
Nationwide, 13.8% of students had not participated in at least 60 minutes of any kind of physical activity that increased their heart rate and made them breathe hard some of the time on at least 1 day during the 7 days before the survey (i.e., did not participate in at least 60 minutes of physical activity on any day) (Table 91). Overall, the prevalence of not having participated in at least 60 minutes of physical activity on any day was higher among female (17.7%) than male (10.0%) students; higher among white female (13.7%), black female (26.7%), and Hispanic female (21.3%) than white male (8.5%), black male (12.3%), and Hispanic male (10.7%) students, respectively; and higher among 9th-grade female (13.9%), 10th-grade female (17.9%), 11th-grade female (19.0%), and 12th-grade female (20.6%) than 9th-grade male (8.7%), 10th-grade male (10.0%), 11th-grade male (10.5%), and 12th-grade male (10.8%) students, respectively. Overall, the prevalence of not having participated in at least 60 minutes of physical activity on any day was higher among black (19.6%) and Hispanic (15.9%) than white (11.0%) students; higher among black (19.6%) than Hispanic (15.9%) students; higher among black female (26.7%) and Hispanic female (21.3%) than white female (13.7%) students; higher among black female (26.7%) than Hispanic female (21.3%) students; and higher among black male (12.3%) and Hispanic male (10.7%) than white male (8.5%) students. Overall, the prevalence of not having participated in at least 60 minutes of physical activity on any day was higher among 11th-grade (14.7%) and 12th-grade (15.6%) than 9th-grade (11.2%) students and higher among 10th-grade female (17.9%), 11th-grade female (19.0%), and 12th-grade female (20.6%) than 9th-grade female (13.9%) students. The prevalence of not having participated in at least 60 minutes of physical activity on any day ranged from 9.0% to 20.6% across state surveys (median: 13.8%) and from 15.5% to 27.1% across large urban school district surveys (median: 20.0%) (Table 92).
Physically Active at Least 60 Minutes per Day on 5 or More Days
Nationwide, 49.5% of students had been physically active doing any kind of physical activity that increased their heart rate and made them breathe hard some of the time for a total of at least 60 minutes per day on 5 or more days during the 7 days before the survey (i.e., physically active at least 60 minutes per day on 5 or more days) (Table 91). Overall, the prevalence of having been physically active at least 60 minutes per day on 5 or more days was higher among male (59.9%) than female (38.5%) students; higher among white male (62.1%), black male (57.1%), and Hispanic male (57.1%) than white female (42.6%), black female (31.9%), and Hispanic female (33.0%) students, respectively; and higher among 9th-grade male (61.0%), 10th-grade male (62.3%), 11th-grade male (58.5%), and 12th-grade male (57.3%) than 9th-grade female (44.5%), 10th-grade female (40.3%), 11th-grade female (35.7%), and 12th-grade female (32.0%) students, respectively. Overall, the prevalence of having been physically active at least 60 minutes per day on 5 or more days was higher among white (52.7%) than black (44.4%) and Hispanic (45.4%) students; higher among white female (42.6%) than black female (31.9%) and Hispanic female (33.0%) students; and higher among white male (62.1%) than Hispanic male (57.1%) students. Overall, the prevalence of having been physically active at least 60 minutes per day on 5 or more days was higher among 9th-grade (52.9%) and 10th-grade (51.8%) than 11th-grade (47.3%) and 12th-grade (44.8%) students and higher among 9th-grade female (44.5%) and 10th-grade female (40.3%) than 11th-grade female (35.7%) and 12th-grade female (32.0%) students. The prevalence of having been physically active at least 60 minutes per day on 5 or more days ranged from 37.9% to 54.7% across state surveys (median: 46.9%) and from 26.7% to 45.7% across large urban school district surveys (median: 37.1%) (Table 92).
Physically Active at Least 60 Minutes per Day on All 7 Days
Nationwide, 28.7% of students had been physically active doing any kind of physical activity that increased their heart rate and made them breathe hard some of the time for a total of least 60 minutes per day on each of the 7 days before the survey (i.e., physically active at least 60 minutes on all 7 days) (Table 93). Overall, the prevalence of having been physically active at least 60 minutes on all 7 days was higher among male (38.3%) than female (18.5%) students; higher among white male (40.4%), black male (35.2%), and Hispanic male (35.6%) than white female (19.7%), black female (16.9%), and Hispanic female (16.9%) students, respectively; and higher among 9th-grade male (38.8%), 10th-grade male (42.6%), 11th-grade male (36.2%), and 12th-grade male (34.9%) than 9th-grade female (22.2%), 10th-grade female (18.1%), 11th-grade female (18.0%), and 12th-grade female (14.9%) students, respectively. Overall, the prevalence of having been physically active at least 60 minutes on all 7 days was higher among white (30.4%) than black (26.0%) and Hispanic (26.5%) students and higher among white male (40.4%) than black male (35.2%) and Hispanic male (35.6%) students. Overall, the prevalence of having been physically active at least 60 minutes on all 7 days was higher among 9th-grade (30.7%) and 10th-grade (30.8%) than 11th-grade (27.3%) and 12th-grade (25.1%) students; higher among 9th-grade female (22.2%) than 10th-grade female (18.1%), 11th-grade female (18.0%), and 12th-grade female (14.9%) students; higher among 10th-grade female (18.1%) and 11th-grade female (18.0%) than 12th-grade female (14.9%) students; higher among 9th-grade male (38.8%) than 12th-grade male (34.9%) students; and higher among 10th-grade male (42.6%) than 11th-grade male (36.2%) and 12th-grade male (34.9%) students. The prevalence of having been physically active at least 60 minutes on all 7 days ranged from 20.8% to 33.1% across state surveys (median: 25.8%) and from 13.4% to 25.9% across large urban school district surveys (median: 19.9%) (Table 94).
Participated in Muscle Strengthening Activities on 3 or More Days
Nationwide, 55.6% of students had participated in muscle strengthening activities (e.g., push-ups, sit-ups, or weightlifting) on 3 or more days during the 7 days before the survey (Table 93). Overall, the prevalence of having participated in muscle strengthening activities on 3 or more days was higher among male (66.7%) than female (43.8%) students; higher among white male (65.5%), black male (71.5%), and Hispanic male (67.6%) than white female (45.3%), black female (37.3%), and Hispanic female (44.7%) students, respectively; and higher among 9th-grade male (68.6%), 10th-grade male (68.8%), 11th-grade male (64.9%), and 12th-grade male (63.8%) than 9th-grade female (49.8%), 10th-grade female (43.3%), 11th-grade female (41.3%), and 12th-grade female (39.8%) students, respectively. The prevalence of having participated in muscle strengthening activities on 3 or more days was higher among white female (45.3%) than black female (37.3%) students and higher among black male (71.5%) than white male (65.5%) students. Overall, the prevalence of having participated in muscle strengthening activities on 3 or more days was higher among 9th-grade (59.3%) than 11th-grade (53.4%) and 12th-grade (52.2%) students; higher among 9th-grade female (49.8%) than 10th-grade female (43.3%), 11th-grade female (41.3%), and 12th-grade female (39.8%) students; and higher among 9th-grade male (68.6%) and 10th-grade male (68.8%) than 12th-grade male (63.8%) students.
During 1991–2011, among students nationwide, a significant linear increase occurred in the prevalence of having participated in muscle strengthening activities on 3 or more days (47.8%–55.6%).
Used Computers 3 or More Hours per Day
Nationwide, 31.1% of students played video or computer games or used a computer for something that was not school work for 3 or more hours per day on an average school day (i.e., used computers 3 or more hours per day) (Table 95). Overall, the prevalence of using computers 3 or more hours per day was higher among male (35.3%) than female (26.6%) students; higher among white male (33.3%), black male (41.1%), and Hispanic male (36.3%) than white female (22.6%), black female (35.2%), and Hispanic female (28.3%) students, respectively; and higher among 9th-grade male (35.5%), 10th-grade male (36.1%), 11th-grade male (36.7%), and 12th-grade male (32.4%) than 9th-grade female (29.5%), 10th-grade female (26.7%), 11th-grade female (24.6%), and 12th-grade female (25.0%) students, respectively. Overall, the prevalence of using computers 3 or more hours per day was higher among black (38.1%) and Hispanic (32.4%) than white (28.1%) students; higher among black (38.1%) than Hispanic (32.4%) students; higher among black female (35.2%) and Hispanic female (28.3%) than white female (22.6%) students; higher among black female (35.2%) than Hispanic female (28.3%) students; and higher among black male (41.1%) than white male (33.3%) and Hispanic male (36.3%) students. Overall, the prevalence of using computers 3 or more hours per day was higher among 9th-grade (32.5%) and 10th-grade (31.6%) than 12th-grade (28.8%) students; higher among 9th-grade female (29.5%) than 11th-grade female (24.6%) and 12th-grade female (25.0%) students; and higher among 11th-grade male (36.7%) than 12th-grade male (32.4%) students. The prevalence of using computers 3 or more hours per day ranged from 18.7% to 37.3% across state surveys (median: 28.8%) and from 28.2% to 43.9% across large urban school district surveys (median: 34.6%) (Table 96).
Among students nationwide, the prevalence of using computers 3 or more hours per day did not change significantly during 2003–2005 (22.1–21.1%) and then increased during 2005–2011 (21.1%–31.1%). The prevalence of having used computers 3 or more hours per day also increased from 2009 (24.9%) to 2011 (31.1%).
Watched Television 3 or More Hours per Day
Nationwide, 32.4% of students watched television 3 or more hours per day on an average school day (Table 95). The prevalence of watching television 3 or more hours per day was higher among white male (27.3%) than white female (23.9%) students. Overall, the prevalence of watching television 3 or more hours per day was higher among black (54.6%) and Hispanic (37.8%) than white (25.6%) students; higher among black (54.6%) than Hispanic (37.8%) students; higher among black female (54.9%) and Hispanic female (37.2%) than white female (23.9%) students; higher among black female (54.9%) than Hispanic female (37.2%) students; higher among black male (54.4%) and Hispanic male (38.4%) than white male (27.3%) students; and higher among black male (54.4%) than Hispanic male (38.4%) students. Overall, the prevalence of watching television 3 or more hours per day was higher among 9th-grade (33.9%) than 12th-grade (30.4%) students and higher among 10th-grade male (35.3%) than 12th-grade male (30.9%) students. The prevalence of watching television 3 or more hours per day ranged from 19.3% to 42.9% across state surveys (median: 29.5%) and from 22.7% to 56.4% across large urban school district surveys (median: 40.6%) (Table 96).
During 1999–2011, a significant linear decrease occurred in the prevalence of watching television 3 or more hours per day (42.8%–32.4%). The prevalence of watching television 3 or more hours per day did not change significantly from 2009 (32.8%) to 2011 (32.4%).
Attended Physical Education Classes
Nationwide, 51.8% of students went to physical education (PE) classes on 1 or more days in an average week when they were in school (i.e., attended PE classes) (Table 97). Overall, the prevalence of attending PE classes was higher among male (56.7%) than female (46.7%) students; higher among white male (56.3%), black male (58.0%), and Hispanic male (58.1%) than white female (47.4%), black female (40.7%), and Hispanic female (48.6%) students, respectively; and higher among 9th-grade male (70.8%), 10th-grade male (59.2%), 11th-grade male (49.2%), and 12th-grade male (44.7%) than 9th-grade female (65.3%), 10th-grade female (49.8%), 11th-grade female (36.3%), and 12th-grade female (32.1%) students, respectively. Overall, the prevalence of attending PE classes was higher among 9th-grade (68.1%) than 10th-grade (54.6%), 11th-grade (42.9%), and 12th-grade (38.5%) students; higher among 10th-grade (54.6%) than 11th-grade (42.9%) and 12th-grade (38.5%) students; higher among 11th-grade (42.9%) than 12th-grade (38.5%) students; higher among 9th-grade female (65.3%) than 10th-grade female (49.8%), 11th-grade female (36.3%), and 12th-grade female (32.1%) students; higher among 10th-grade female (49.8%) than 11th-grade female (36.3%) and 12th-grade female (32.1%) students; higher among 11th-grade female (36.3%) than 12th-grade female (32.1%) students; higher among 9th-grade male (70.8%) than 10th-grade male (59.2%), 11th-grade male (49.2%), and 12th-grade male (44.7%) students; higher among 10th-grade male (59.2%) than 11th-grade male (49.2%) and 12th-grade male (44.7%) students; and higher among 11th-grade male (49.2%) than 12th-grade male (44.7%) students. The prevalence of attending PE classes ranged from 32.8% to 91.3% across state surveys (median: 46.2%) and from 31.7% to 79.5% across large urban school district surveys (median: 47.0%) (Table 98).
Among students nationwide, the prevalence of attending PE classes did not change significantly during 1991–2011 (48.9%–51.8%) or from 2009 (56.4%) to 2011 (51.8%).
Attended Physical Education Classes Daily
Nationwide, 31.5% of students went to physical education (PE) classes 5 days in an average week when they were in school (i.e., attended PE classes daily) (Table 97). Overall, the prevalence of attending PE classes daily was higher among male (35.5%) than female (27.2%) students; higher among white male (37.0%), black male (33.2%), and Hispanic male (34.1%) than white female (28.8%), black female (22.1%), and Hispanic female (25.7%) students, respectively; and higher among 9th-grade male (44.0%), 10th-grade male (36.7%), 11th-grade male (31.6%), and 12th-grade male (27.9%) than 9th-grade female (38.6%), 10th-grade female (29.3%), 11th-grade female (18.4%), and 12th-grade female (20.4%) students, respectively. Overall, the prevalence of attending PE classes daily was higher among 9th-grade (41.3%) than 10th-grade (33.1%), 11th-grade (25.1%), and 12th-grade (24.2%) students; higher among 10th-grade (33.1%) than 11th-grade (25.1%) and 12th-grade (24.2%) students; higher among 9th-grade female (38.6%) than 10th-grade female (29.3%), 11th-grade female (18.4%), and 12th-grade female (20.4%) students; higher among 10th-grade female (29.3%) than 11th-grade female (18.4%) and 12th-grade female (20.4%) students; higher among 9th-grade male (44.0%) than 10th-grade male (36.7%), 11th-grade male (31.6%), and 12th-grade male (27.9%) students; and higher among 10th-grade male (36.7%) than 12th-grade male (27.9%) students. The prevalence of attending PE classes daily ranged from 6.3% to 71.2% across state surveys (median: 24.2%) and from 9.0% to 50.5% across large urban school district surveys (median: 23.0%) (Table 98).
Among students nationwide, the prevalence of attending PE classes daily decreased during 1991–1995 (41.6%–25.4%) and then did not change significantly during 1995–2011 (25.4%–31.5%). The prevalence of attending PE classes daily also did not change significantly from 2009 (33.3%) to 2011 (31.5%).
Played on at Least One Sports Team
Nationwide, 58.4% of students had played on at least one sports team (run by their school or community groups) during the 12 months before the survey (Table 99). Overall, the prevalence of having played on at least one sports team was higher among male (64.0%) than female (52.6%) students; higher among white male (64.7%), black male (67.3%), and Hispanic male (63.0%) than white female (57.1%), black female (46.9%), and Hispanic female (44.6%) students, respectively; and higher among 9th-grade male (65.6%), 10th-grade male (68.2%), 11th-grade male (60.9%), and 12th-grade male (60.2%) than 9th-grade female (57.1%), 10th-grade female (56.1%), 11th-grade female (51.3%), and 12th-grade female (44.5%) students, respectively. Overall, the prevalence of having played on at least one sports team was higher among white (60.9%) than Hispanic (54.1%) students; higher among white female (57.1%) than black female (46.9%) and Hispanic female (44.6%) students; and higher among black male (67.3%) than Hispanic male (63.0%) students. Overall, the prevalence of having played on at least one sports team was higher among 9th-grade (61.4%) and 10th-grade (62.3%) than 11th-grade (56.2%) and 12th-grade (52.5%) students; higher among 11th-grade (56.2%) than 12th-grade (52.5%) students; higher among 9th-grade female (57.1%) than 11th-grade female (51.3%) and 12th-grade female (44.5%) students; higher among 10th-grade female (56.1%) and 11th-grade female (51.3%) than 12th-grade female (44.5%) students; and higher among 9th-grade male (65.6%) and 10th-grade male (68.2%) than 11th-grade male (60.9%) and 12th-grade male (60.2%) students. The prevalence of having played on at least one sports team ranged from 46.3% to 64.1% across state surveys (median: 56.0%) and from 42.8% to 57.3% across large urban school district surveys (median: 49.0%) (Table 100).
During 1999–2011, among students nationwide, a significant linear increase occurred in the prevalence of having played on at least one sports team (55.1%–58.4%). The prevalence of having played on at least one sports team did not change significantly from 2009 (58.3%) to 2011 (58.4%).
Obesity, Overweight, and Weight Control
Obese
Nationwide, 13.0% of students were obese (Table 101). Overall, the prevalence of obesity was higher among male (16.1%) than female (9.8%) students; higher among white male (15.0%) and Hispanic male (19.2%) than white female (7.7%) and Hispanic female (8.6%) students, respectively; and higher among 9th-grade male (15.8%), 10th-grade male (15.5%), 11th-grade male (17.7%), and 12th-grade male (15.1%) than 9th-grade female (11.4%), 10th-grade female (9.8%), 11th-grade female (8.0%), and 12th-grade female (9.8%) students, respectively. Overall, the prevalence of obesity was higher among black (18.2%) and Hispanic (14.1%) than white (11.5%) students; higher among black (18.2%) than Hispanic (14.1%) students; higher among black female (18.6%) than white female (7.7%) and Hispanic female (8.6%) students; and higher among Hispanic male (19.2%) than white male (15.0%) students. The prevalence of obesity was higher among 9th-grade female (11.4%) than 11th-grade female (8.0%) students. The prevalence of obesity ranged from 7.3% to 17.0% across state surveys (median: 12.0%) and from 7.4% to 18.9% across large urban school district surveys (median: 13.3%) (Table 102).
During 1999–2011, a significant linear increase occurred in the prevalence of obesity (10.6%–13.0%). The prevalence of obesity did not change significantly from 2009 (11.8%) to 2011 (13.0%).
Overweight
Nationwide, 15.2% of students were overweight (Table 101). The prevalence of overweight was higher among black female (19.6%) than black male (12.8%) students. Overall, the prevalence of overweight was higher among Hispanic (17.4%) than white (14.2%) students; higher among black female (19.6%) and Hispanic female (18.0%) than white female (13.8%) students; and higher among Hispanic male (16.9%) than black male (12.8%) students. Overall, the prevalence of overweight was higher among 9th-grade (17.3%) than 10th-grade (14.4%), 11th-grade (14.3%), and 12th-grade (14.7%) students and higher among 9th-grade male (18.2%) than 11th-grade male (13.4%) and 12th-grade male (14.0%) students. The prevalence of overweight ranged from 10.7% to 19.5% across state surveys (median: 14.7%) and from 11.6% to 22.7% across large urban school district surveys (median: 16.8%) (Table 102).
During 1999–2011, a significant linear increase occurred in the prevalence of overweight (14.2%–15.2%). The prevalence of overweight did not change significantly from 2009 (15.6%) to 2011 (15.2%).
Described Themselves as Overweight
Nationwide, 29.2% of students described themselves as slightly or very overweight (Table 103). Overall, the prevalence of describing themselves as overweight was higher among female (34.8%) than male (23.9%) students; higher among white female (33.7%), black female (35.4%), and Hispanic female (36.3%) than white male (23.7%), black male (18.2%), and Hispanic male (27.4%) students, respectively; and higher among 9th-grade female (33.4%), 10th-grade female (34.3%), 11th-grade female (35.3%), and 12th-grade female (36.4%) than 9th-grade male (23.5%), 10th-grade male (23.0%), 11th-grade male (23.6%), and 12th-grade male (25.4%) students, respectively. Overall, the prevalence of describing themselves as overweight was higher among Hispanic (31.7%) than white (28.5%) and black (26.8%) students; higher among white male (23.7%) than black male (18.2%) students; and higher among Hispanic male (27.4%) than white male (23.7%) and black male (18.2%) students. The prevalence of describing themselves as overweight ranged from 24.1% to 32.7% across state surveys (median: 28.6%) and from 19.0% to 33.8% across large urban school district surveys (median: 26.0%) (Table 104).
Among students nationwide, the prevalence of describing themselves as slightly or very overweight decreased during 1991–1997 (31.8%–27.3%) and then did not change significantly during 1997–2011 (27.3%–29.2%). The prevalence of describing themselves as slightly or very overweight also did not change significantly from 2009 (27.7%) to 2011 (29.2%).
Were Trying to Lose Weight
Nationwide, 46.0% of students were trying to lose weight (Table 103). Overall, the prevalence of trying to lose weight was higher among female (61.2%) than male (31.6%) students; higher among white female (61.4%), black female (55.2%), and Hispanic female (66.4%) than white male (29.2%), black male (26.6%), and Hispanic male (39.6%) students, respectively; and higher among 9th-grade female (59.2%), 10th-grade female (61.6%), 11th-grade female (61.6%), and 12th-grade female (63.0%) than 9th-grade male (33.3%), 10th-grade male (30.4%), 11th-grade male (30.7%), and 12th-grade male (31.2%) students, respectively. Overall, the prevalence of trying to lose weight was higher among white (44.8%) than black (40.9%) students; higher among Hispanic (52.6%) than white (44.8%) and black (40.9%) students; higher among white female (61.4%) than black female (55.2%) students; higher among Hispanic female (66.4%) than white female (61.4%) and black female (55.2%) students; and higher among Hispanic male (39.6%) than white male (29.2%) and black male (26.6%) students. The prevalence of trying to lose weight ranged from 39.6% to 49.3% across state surveys (median: 44.9%) and from 33.7% to 52.1% across large urban school district surveys (median: 43.5%) (Table 104).
During 1991–2011, among students nationwide, a significant linear increase occurred in the prevalence of trying to lose weight (41.8%–46.0%). The prevalence of trying to lose weight did not change significantly from 2009 (44.4%) to 2011 (46.0%).
Did Not Eat for ≥24 Hours to Lose Weight or to Keep from Gaining Weight
Nationwide, 12.2% of students had not eaten for 24 or more hours to lose weight or to keep from gaining weight during the 30 days before the survey (Table 105). Overall, the prevalence of having not eaten for 24 or more hours to lose weight or to keep from gaining weight was higher among female (17.4%) than male (7.2%) students; higher among white female (17.5%), black female (15.1%), and Hispanic female (18.8%) than white male (6.7%), black male (8.0%), and Hispanic male (7.8%) students, respectively; and higher among 9th-grade female (18.8%), 10th-grade female (17.4%), 11th-grade female (17.3%), and 12th-grade female (15.6%) than 9th-grade male (6.3%), 10th-grade male (6.8%), 11th-grade male (8.6%), and 12th-grade male (7.1%) students, respectively. The prevalence of having not eaten for 24 or more hours to lose weight or to keep from gaining weight was higher among 9th-grade female (18.8%) than 12th-grade female (15.6%) students and higher among 11th-grade male (8.6%) than 9th-grade male (6.3%) students. The prevalence of having not eaten for 24 or more hours to lose weight or to keep from gaining weight ranged from 8.4% to 17.7% across state surveys (median: 13.1%) and from 9.0% to 17.5% across large urban school district surveys (median: 12.8%) (Table 106).
During 1999–2011, among students nationwide, a significant linear decrease occurred in the prevalence of having not eaten for 24 hours or more to lose weight or to keep from gaining weight (12.6%–12.2%). The prevalence of having not eaten for 24 hours or more to lose weight or to keep from gaining weight increased from 2009 (10.6%) to 2011 (12.2%).
Took Diet Pills, Powders, or Liquids to Lose Weight or to Keep from Gaining Weight
Nationwide, 5.1% of students had taken diet pills, powders, or liquids without a doctor's advice to lose weight or to keep from gaining weight during the 30 days before the survey (Table 105). Overall, the prevalence of having taken diet pills, powders, or liquids without a doctor's advice to lose weight or to keep from gaining weight was higher among female (5.9%) than male (4.2%) students; higher among white female (5.8%) and Hispanic female (7.8%) than white male (3.7%) and Hispanic male (5.0%) students, respectively; and higher among 9th-grade female (5.5%) and 12th-grade female (6.8%) than 9th-grade male (3.6%) and 12th-grade male (4.0%) students, respectively. Overall, the prevalence of having taken diet pills, powders, or liquids without a doctor's advice to lose weight or to keep from gaining weight was higher among Hispanic (6.4%) than white (4.7%) and black (4.2%) students and higher among white female (5.8%) and Hispanic female (7.8%) than black female (4.1%) students. Overall, the prevalence of having taken diet pills, powders, or liquids without a doctor's advice to lose weight or to keep from gaining weight was higher among 11th-grade (5.9%) than 9th-grade (4.6%) and 10th-grade (4.3%) students; higher among 11th-grade female (6.8%) and 12th-grade female (6.8%) than 10th-grade female (4.5%) students; and higher among 11th-grade male (5.1%) than 9th-grade male (3.6%) students. The prevalence of having taken diet pills, powders, or liquids without a doctor's advice to lose weight or to keep from gaining weight ranged from 4.0% to 9.6% across state surveys (median: 5.6%) and from 3.4% to 7.9% across large urban school district surveys (median: 5.7%) (Table 106).
Among students nationwide, the prevalence of having taken diet pills, powders, or liquids without a doctor's advice to lose weight or to keep from gaining weight increased during 1999–2001 (7.6%–9.2%) and then decreased during 2001–2011 (9.2%–5.1%). The prevalence of having taken diet pills, powders, or liquids without a doctor's advice to lose weight or to keep from gaining weight did not change significantly from 2009 (5.0%) to 2011 (5.1%).
Vomited or Took Laxatives to Lose Weight or to Keep from Gaining Weight
Nationwide, 4.3% of students had vomited or taken laxatives to lose weight or to keep from gaining weight during the 30 days before the survey (Table 107). Overall, the prevalence of having vomited or taken laxatives to lose weight or to keep from gaining weight was higher among female (6.0%) than male (2.5%) students; higher among white female (6.5%) and Hispanic female (7.2%) than white male (1.8%) and Hispanic male (3.3%) students, respectively; and higher among 9th-grade female (5.9%), 10th-grade female (5.9%), 11th-grade female (5.8%), and 12th-grade female (6.4%) than 9th-grade male (2.4%), 10th-grade male (2.3%), 11th-grade male (2.9%), and 12th-grade male (2.5%) students, respectively. Overall, the prevalence of having vomited or taken laxatives to lose weight or to keep from gaining weight was higher among white (4.1%) and Hispanic (5.2%) than black (3.0%) students; higher among white female (6.5%) and Hispanic female (7.2%) than black female (2.9%) students; and higher among Hispanic male (3.3%) than white male (1.8%) students. The prevalence of having vomited or taken laxatives to lose weight or to keep from gaining weight ranged from 2.9% to 8.4% across state surveys (median: 5.0%) and from 3.0% to 6.5% across large urban school district surveys (median: 5.0%) (Table 108).
Among students nationwide, the prevalence of having vomited or taken laxatives to lose weight or to keep from gaining weight did not change significantly during 1995–2003 (4.8%–6.0%) and then decreased during 2003–2011 (6.0%–4.3%). The prevalence of having vomited or taken laxatives to lose weight or to keep from gaining weight did not change significantly from 2009 (4.0%) to 2011 (4.3%).
Other Health-Related Topics
Ever Had Asthma
Nationwide, 23.0% of students had ever been told by a doctor or nurse that they had asthma (i.e., ever had asthma) (Table 109). The prevalence of having ever had asthma was higher among black male (29.9%) than black female (23.5%) students. Overall, the prevalence of having ever had asthma was higher among black (26.8%) than white (22.8%) and Hispanic (20.3%) students and higher among black male (29.9%) than white male (22.8%) and Hispanic male (20.8%) students. The prevalence of having ever had asthma ranged from 16.0% to 28.7% across state surveys (median: 22.3%) and from 16.4% to 29.5% across large urban school district surveys (median: 21.5%) (Table 110).
During 2003–2011, among students nationwide, a significant linear increase occurred in the prevalence of having ever had asthma (18.9%–23.0%). The prevalence of having ever had asthma did not change significantly from 2009 (22.0%) to 2011 (23.0%).
Current Asthma
Nationwide, 11.9% of students had ever had and still had asthma (i.e., current asthma) (Table 109). Overall, the prevalence of current asthma was higher among female (13.5%) than male (10.4%) students; higher among white female (14.5%) than white male (10.5%) students; and higher among 11th-grade female (13.9%) and 12th-grade female (13.4%) than 11th-grade male (9.3%) and 12th-grade male (9.6%) students, respectively. Overall, the prevalence of current asthma was higher among white (12.4%) and black (13.5%) than Hispanic (9.1%) students; higher among white female (14.5%) than Hispanic female (9.8%) students; and higher among black male (13.9%) than white male (10.5%) and Hispanic male (8.4%) students. The prevalence of current asthma was higher among 10th-grade male (11.2%) than 11th-grade male (9.3%) students. The prevalence of current asthma ranged from 7.5% to 14.4% across state surveys (median: 11.1%) and from 6.4% to 16.3% across large urban school district surveys (median: 9.1%) (Table 110).
Among students nationwide, the prevalence of current asthma did not change significantly during 2007–2011 (10.9%–11.9%) or from 2009 (10.8%) to 2011 (11.9%).
Routine Sunscreen Use
Nationwide, 10.8% of students most of the time or always wore sunscreen with an SPF of 15 or higher when outside for more than 1 hour on a sunny day (i.e., routine sunscreen use)(Table 111). Overall, the prevalence of routine sunscreen use was higher among female (14.4%) than male (7.3%) students; higher among white female (17.4%), black female (6.3%), and Hispanic female (9.2%) than white male (8.8%), black male (3.2%), and Hispanic male (4.4%) students, respectively; and higher among 9th-grade female (14.6%), 10th-grade female (13.4%), 11th-grade female (13.7%), and 12th-grade female (15.9%) than 9th-grade male (7.8%), 10th-grade male (7.5%), 11th-grade male (7.4%), and 12th-grade male (6.1%) students, respectively. Overall, the prevalence of routine sunscreen use was higher among white (13.0%) than black (4.8%) and Hispanic (6.7%) students; higher among Hispanic (6.7%) than black (4.8%) students; higher among white female (17.4%) than black female (6.3%) and Hispanic female (9.2%) students; higher among Hispanic female (9.2%) than black female (6.3%) students; and higher among white male (8.8%) than black male (3.2%) and Hispanic male (4.4%) students.
During 1999–2011, among students nationwide, a significant linear decrease occurred in the prevalence of routine sunscreen use (13.3%–10.8%). The prevalence of routine sunscreen use did not change significantly from 2009 (9.3%) to 2011 (10.8%).
Indoor Tanning Device Use
Nationwide, 13.3% of students had used an indoor tanning device, such as a sunlamp, sunbed, or tanning booth, one or more times during the 12 months before the survey (i.e., indoor tanning device use) (Table 111). Overall, the prevalence of indoor tanning device use was higher among female (20.9%) than male (6.2%) students; higher among white female (29.3%) and Hispanic female (9.6%) than white male (6.2%) and Hispanic male (5.7%) students, respectively; and higher among 9th-grade female (11.7%), 10th-grade female (15.7%), 11th-grade female (26.5%), and 12th-grade female (31.8%) than 9th-grade male (4.5%), 10th-grade male (4.9%), 11th-grade male (6.8%), and 12th-grade male (8.5%) students, respectively. Overall, the prevalence of indoor tanning device use was higher among white (17.4%) than black (3.9%) and Hispanic (7.6%) students; higher among Hispanic (7.6%) than black (3.9%) students; higher among white female (29.3%) than black female (3.3%) and Hispanic female (9.6%) students; and higher among Hispanic female (9.6%) than black female (3.3%) students. Overall, the prevalence of indoor tanning device use was higher among 11th-grade (16.4%) and 12th-grade (19.7%) than 9th-grade (8.1%) and 10th-grade (10.1%) students; higher among 12th-grade (19.7%) than 11th-grade (16.4%) students; higher among 10th-grade female (15.7%), 11th-grade female (26.5%), and 12th-grade female (31.8%) than 9th-grade female (11.7%) students; higher among 11th-grade female (26.5%) and 12th-grade female (31.8%) than 10th-grade female (15.7%) students; higher among 12th-grade female (31.8%) than 11th-grade female (26.5%) students; and higher among 12th-grade male (8.5%) than 9th-grade male (4.5%) and 10th-grade male (4.9%) students.
Among students nationwide, the prevalence of indoor tanning device use did not change significantly from 2009 (15.6%) to 2011 (13.3%).
Eight or More Hours of Sleep
Nationwide, 31.4% of students got 8 or more hours of sleep on an average school night (Table 112). Overall, the prevalence of getting 8 or more hours of sleep was higher among male (33.6%) than female (29.1%) students; higher among white male (35.0%) and Hispanic male (33.7%) than white female (30.2%) and Hispanic female (27.7%) students, respectively; and higher among 9th-grade male (43.1%), 10th-grade male (35.9%), and 11th-grade male (28.7%) than 9th-grade female (36.8%), 10th-grade female (30.8%), and 11th-grade female (24.5%) students, respectively. Overall, the prevalence of getting 8 or more hours of sleep was higher among white (32.7%) than black (27.9%) students and higher among white male (35.0%) and Hispanic male (33.7%) than black male (27.9%) students. Overall, the prevalence of getting 8 or more hours of sleep was higher among 9th-grade (40.0%) than 10th-grade (33.4%), 11th-grade (26.7%), and 12th-grade (23.8%) students; higher among 10th-grade (33.4%) than 11th-grade (26.7%) and 12th-grade (23.8%) students; higher among 11th-grade (26.7%) than 12th-grade (23.8%) students; higher among 9th-grade female (36.8%) than 10th-grade female (30.8%), 11th-grade female (24.5%), and 12th-grade female (22.8%) students; higher among 10th-grade female (30.8%) than 11th-grade female (24.5%) and 12th-grade female (22.8%) students; higher among 9th-grade male (43.1%) than 10th-grade male (35.9%), 11th-grade male (28.7%), and 12th-grade male (24.8%) students; higher among 10th-grade male (35.9%) than 11th-grade male (28.7%) and 12th-grade male (24.8%) students; and higher among 11th-grade male (28.7%) than 12th-grade male (24.8%) students.
Among students nationwide, the prevalence of getting 8 or more hours of sleep did not change significantly during 2007–2011 (31.1%–31.4%) or from 2009 (30.9%) to 2011 (31.4%).
Discussion
YRBSS is the largest public health surveillance system in the United States monitoring a broad range of health-risk behaviors among high school students. In addition to describing the prevalence of health-risk behaviors, YRBSS data are used widely to compare health-risk behavior prevalence among students overall and by sex, race/ethnicity, grade, and age; assess trends in health-risk behaviors over time; monitor progress toward achieving national health objectives; provide comparable state and local data; and evaluate and improve health-related policies and programs.
Compare Health-Risk Behavior Prevalence Among Student Subpopulations
Variations in health-risk behaviors among subpopulations of high school students as defined by sex and race/ethnicity can be identified with YRBSS data. For example, male high school students were more likely than female high school students to have engaged in certain behaviors related to unintentional injury (e.g., rarely or never worn a seatbelt and drove when drinking alcohol); violence (e.g., carried a weapon and been in a physical fight); tobacco use (e.g., currently smoked cigarettes, currently smoked cigars, and currently used smokeless tobacco); alcohol and other drug use (e.g., binge drank and ever used marijuana, cocaine, ecstasy, heroin, methamphetamines, and hallucinogenic drugs); and sexual behaviors related to unintentional pregnancy and STDs, including HIV infection (e.g., ever had sexual intercourse and had sexual intercourse with four or more persons during their life). Female high school students were more likely than male high school students to have been bullied on school property, electronically bullied, forced to have sexual intercourse, engaged in suicide-related behaviors (e.g., felt sad or hopeless and attempted suicide), been physically inactive, engaged in unhealthy weight control behaviors, and used an indoor tanning device.
Variations by race/ethnicity also were observed. For example, white high school students were most likely to have texted or e-mailed while driving, been bullied on school property, been electronically bullied, used tobacco (e.g., smoked cigarettes daily and currently used smokeless tobacco), and to have used an indoor tanning device. Black high school students were most likely to have engaged in risky sexual behaviors (e.g., ever had sexual intercourse and had sexual intercourse for the first time before age 13 years), been physically inactive, watched television for 3 or more hours per day, and to be obese. Hispanic high school students were most likely to have ridden with a driver who had been drinking alcohol; felt sad or hopeless; had their first drink of alcohol before age 13 years; ever used cocaine, inhalants, and ecstasy; and to have not used any method to prevent pregnancy during last sexual intercourse.
However, this analysis could not isolate the effects of these demographic characteristics from the effects of socioeconomic status (SES) or culture on health-risk behaviors. In a national study, the likelihood of behavioral cardiovascular disease risks, including obesity, sedentary behaviors, and tobacco exposure, increased among adolescents aged 12–17 years as the SES based on poverty-income ratio decreased (13). Additional research is needed to assess the effect of specific educational, socioeconomic, cultural, and racial/ethnic factors on the prevalence of health-risk behaviors among high school students.
Assess Trends in Health-Risk Behaviors Over Time
Long-term trends in health-risk behaviors can be assessed using YRBSS data. Since 1991, substantial progress has been made in decreasing the prevalence of many health-risk behaviors among high school students nationwide, including never or rarely wearing a seatbelt, riding with a driver who had been drinking alcohol, current frequent cigarette use, and being currently sexually active. However, the percentage of high school students who are obese increased during 1999–2011, and the percentage who drank three or more glasses per day of milk and who routinely used sunscreen decreased during this same period. In addition, among students who currently smoke cigarettes, the percentage who tried to quit smoking cigarettes decreased during 2001–2011. Emerging behavior patterns can be detected by examining temporal changes during 2009–2011. For example, encouraging changes during 2009–2011 include a decrease in the percentage of students who currently used alcohol and binge drank and an increase in the percentage of students who ate vegetables three or more times per day. Concerning changes during 2009–2011 include a decrease in the percentage of students who were taught in school about AIDS or HIV infection and an increase in the percentage of students who attempted suicide and currently used marijuana.
Monitor Progress Toward Achieving National Health Objectives
The national YRBS is the primary source of data to measure 20 Healthy People 2020 objectives, including one leading health indicator (14). The Healthy People 2020 objectives provide a comprehensive agenda for improving the health of all persons in the United States during the second decade of the 21st century. This report provides the Healthy People 2020 target and data from the 2011 national YRBS for all 20 objectives (Table 113). The data indicate that as of 2011 two of the 20 Healthy People 2020 objectives have been achieved. Healthy People 2020 objective C-20.3 is to reduce the proportion of adolescents in grades 9 through 12 who report using artificial sources of ultraviolet light for tanning to below 14.0%. In 2011, 13.3% of high school students nationally had used an indoor tanning device during the 12 months before the survey. Healthy People 2020 Objective SA-1 is to reduce the proportion of adolescents who report that they rode, during the previous 30 days, with a driver who had been drinking alcohol to below 25.5%. In 2011, 24.1% of high school students nationally had ridden in a car or other vehicle driven by someone who had been drinking alcohol during the 30 days before the survey. Although the data indicate the Healthy People 2020 objective PA-3.1 to increase the proportion of adolescents who meet current federal physical activity guidelines for aerobic physical activity has been met, the 2011 YRBS prevalence estimate for aerobic physical activity is not comparable to the baseline prevalence upon which the target was set because of a change in the context of the question starting with the 2011 national YRBS questionnaire.§§
To obtain certain Healthy People 2020 objectives, substantial progress still must be made. For example, Healthy People 2020 objective PA-8.3.3 is to increase the proportion of adolescents in grades 9 –12 who use a computer or play computer games outside of school (for nonschool work) for no more than 2 hours a day to 82.6%. As of 2011, only 68.9% of high school students nationally met this objective. To reach many of the Healthy People 2020 goals, additional support is needed for coordinated, comprehensive school health programs and other interventions that address health-risk behaviors.
Provide Comparable State and Large Urban School District Data
Because all state and large urban school district surveys share similar sampling, questionnaires, data collection, and data-processing procedures, it is possible to compare state and large urban school district YRBS data. The prevalence of some health-risk behaviors varied substantially among states and large urban school districts. Across state surveys, a range of 25 or more percentage points or a fivefold variation or greater was identified for the following health-risk behaviors:
- rarely or never wore a bicycle helmet (minimum: 52.7%; maximum: 95.1%);
- ever smoked cigarettes (minimum: 23.1%; maximum: 59.5%);
- current frequent cigarette use (minimum: 2.1%; maximum: 11.6%);
- smoked more than 10 cigarettes/day (minimum: 3.5%; maximum: 18.2%);
- bought cigarettes in a store or gas station (minimum: 3.0%; maximum: 25.5%);
- used smokeless tobacco on school property (minimum: 2.3%; maximum: 11.6%);
- ever drank alcohol (minimum: 35.1%; maximum: 75.6%);
- current alcohol use (minimum: 15.0%; maximum: 44.4%);
- ever used marijuana (minimum: 19.6%; maximum: 46.0%);
- condom use (minimum: 43.9%; maximum: 70.8%);
- Depo-Provera, Nuva Ring, Implanon, or any IUD use (minimum: 2.1%; maximum: 12.4%);
- birth control pill, Depo-Provera, Nuva Ring, Implanon, or any IUD use (minimum: 15.7%; maximum: 42.3%);
- drank soda or pop one or more times/day (minimum: 14.3%; maximum: 40.9%);
- attended PE classes (minimum: 32.8%; maximum: 91.3%); and
- attended PE classes daily (minimum: 6.3%; maximum: 71.2%).
Across large urban school district surveys, a range of 25 or more percentage points or a fivefold variation or greater was identified for the following health-risk behaviors:
- rarely or never wore a bicycle helmet (minimum: 59.3%; maximum: 94.3%);
- rarely or never wore a seat belt (minimum: 4.1%; maximum: 25.8%);
- current frequent cigarette use (minimum: 0.9%; maximum: 5.3%);
- smoked more than 10 cigarettes/day (minimum: 1.9%; maximum: 12.9%);
- current smokeless tobacco use (minimum: 1.4%; maximum: 7.5%);
- ever used cocaine (minimum: 1.5%; maximum: 9.3%);
- current cocaine use (minimum: 0.8%; maximum: 4.3%);
- ever used ecstasy (minimum: 2.7%; maximum: 16.4%);
- ever used heroin (minimum: 0.8%; maximum: 5.3%);
- ever used methamphetamines (minimum: 1.3%; maximum: 6.9%);
- ever injected any illegal drug (minimum: 1.0%; maximum: 13.0%);
- ever had sexual intercourse (minimum: 27.8%; maximum: 62.2%);
- currently sexually active (minimum: 19.5%; maximum: 44.9%);
- Depo-Provera, Nuva Ring, Implanon, or any IUD use (minimum: 1.0%; maximum: 14.9%);
- birth control pill, Depo-Provera, Nuva Ring, Implanon, or any IUD use (minimum: 7.1%; maximum: 36.3%);
- condom use and birth control pill, Depo-Provera, Nuva Ring, Implanon, or any IUD use (minimum: 2.2%; maximum: 12.6%);
- drank soda or pop one or more times/day (minimum: 12.7%; maximum: 38.9%);
- watched television 3 or more hours/day (minimum: 22.7%; maximum: 56.4%);
- attended PE classes (minimum: 31.7%; maximum: 79.5%); and
- attended PE classes daily (minimum: 9.0%; maximum: 50.5%).
These variations might occur, in part, because of differences in state and local laws and policies, enforcement practices, access to illegal drugs, availability of effective school and community interventions, prevailing behavioral and social norms, demographic characteristics of the population, and adult practices. Longitudinal research is needed to better understand the effect of these factors on the development and prevalence of health-risk behaviors.
Evaluate and Improve Health-Related Policies and Programs
CDC and other federal agencies use national YRBS data to evaluate components of CDC's Performance Plan in compliance with the Government Performance and Results Act (15) and to evaluate the contribution of HIV prevention and chronic disease prevention efforts toward helping reduce health-risk behaviors among youth. State and local agencies and nongovernmental organizations use YRBS data to improve health-related policies and programs. For example, YRBS data were used in Massachusetts to develop a fact sheet on student obesity, physical activity, and eating behaviors. This fact sheet was used to build support for legislation limiting competitive foods in schools and for best practice guidelines on school physical education and physical activity programs. In New York City, YRBS data were cited by the New York City Commissioner of Health in testimony before the City Council to support a smoking ban in all New York City public parks and beaches. The law took effect in May 2011, and prohibits smoking in 1,700 city parks and along 14 miles of the city's public beaches. In Wisconsin, the Department of Public Instruction and the Department of Health Services developed a joint report on sexual behaviors based on YRBS data. This report is used to identify high-risk populations in the state. In South Dakota, YRBS data were used to identify underage alcohol use and binge drinking among youth as priority health risk behaviors in a grant application. As a result, the South Dakota Department of Human Services/Social Services received the Strategic Prevention Framework State Incentive Grant to address this issue.
Limitations
The findings in this report are subject to at least four limitations. First, these data apply only to youth who attend school and, therefore, are not representative of all persons in this age group. Nationwide, in 2009, of persons aged 16–17 years, approximately 4% were not enrolled in a high school program and had not completed high school (16). Second, the extent of underreporting or overreporting of behaviors cannot be determined, although the survey questions demonstrate good test-retest reliability (8). Third, BMI is calculated on the basis of self-reported height and weight, and, therefore, tends to underestimate the prevalence of obesity and overweight (17). Fourth, not all states and large urban school districts include all of the standard questions on their YRBS questionnaire. For example, five states (Georgia, Louisiana, Maryland, Utah, and Virginia) do not ask any questions on sexual risk behaviors.
Conclusion
The results of this report indicate a need for continued monitoring of health-risk behaviors among high school students nationally and at the state and local levels. In 2011, a total of 43 states and 21 large urban school districts collected YRBS data representative of high school students in their jurisdiction. YRBSS provides ongoing, systematic monitoring of youth risk behaviors at the national, state, and local levels. During the preceding 20 years, analysis and interpretation of YRBSS data have been instrumental in planning, implementation, and evaluation of public health and school-based policies and practices. Additional support for YRBSS will ensure data on priority risk behaviors are available to enhance and inform future efforts to protect and promote the health of youth.
References
- CDC, NCHS. Mortality data file for 2008 with all state identifiers [CD-ROM]. 2011.
- CDC. Vital signs: teen pregnancy — United States, 1991–2009. MMWR 2011;60(No. 13):414–20.
- CDC, NCHHSTP. Sexually transmitted disease morbidity for selected STDs by age, race/ethnicity and gender, 1996–2009, CDC WONDER Online Database, June 2011. Available at http://wonder.cdc.gov/std-std-race-age.html. Accessed April 5, 2012.
- CDC. HIV surveillance report, 2009; vol. 21. Available at http://www.cdc.gov/hiv/topics/surveillance/resources/reports. Accessed April 5, 2012.
- Brener ND, Kann L, Kinchen S, et al. Methodology of the Youth Risk Behavior Surveillance System. MMWR 2004;53(No RR-12).
- MDR National Education Database Master Extract, Shelton, CT: Market Data Retrieval, Inc.: 2010.
- US Department of Education, National Center for Education Statistics. Common Core of Data Public Elementary/Secondary School Universe Survey. Washington, DC: US Department of Education, National Center for Education Statistics. Available at http://nces.ed.gov/ccd. Accessed April 5, 2012.
- Brener ND, Kann L, McManus T, Kinchen SA, Sundberg EC, Ross JG. Reliability of the 1999 Youth Risk Behavior Survey questionnaire. J Adolesc Health 2002;31:336–42.
- Kuczmarski RJ, Ogden CL, Grummer-Strawn LM, et al. CDC growth charts: United States. In: Advance Data from Vital and Health Statistics, no. 314. Hyattsville, MD: National Center for Health Statistics; 2000.
- SAS Institute, Inc. SAS,(r) version 9.2 [software and documentation].Cary, NC: SAS Institute; 2008.
- Research Triangle Institute. SUDAAN,(r) version 10 [software and documentation]. Research Triangle Park, NC: Research Triangle Institute; 2008.
- Hinkle DE, Wiersma W, Jurs SG. Applied statistics for the behavioral sciences. 5th ed. Boston, MA: Houghton Mifflin Co.; 2003.
- Ali MK, McKeever Bullard K, Beckles GL, Stevens MR, Barker L, Narayan V, Imperatore G. Household income and cardiovascular disease risks in U.S. children and young adults. Diabetes Care 2011;34:1998–2004.
- U.S. Department of Health and Human Services. Office of Disease Prevention and Health Promotion. Healthy People 2020. Washington, DC. Available at http://www.healthypeople.gov. Accessed April 5, 2012.
- CDC. FY 2012 Online Performance Appendix. Atlanta, GA: US Department of Health and Human Services, CDC; 2011. Available at http://www.cdc.gov/fmo/topic/Performance/performance_docs/FY2012_CDC_Online_Performance_Appendix.pdf. Accessed April 5, 2012.
- Chapman C, Laird J, Ifill N, KewalRamani A (2011). Trends in high school dropout and completion rates in the United States: 1972-2009 (NCES 2012-006). Washington, DC: National Center for Education Statistics, US Department of Education. Available at http://nces.ed.gov/pubs2012/2012006.pdf. Accessed April 5, 2012.
- Brener ND, McManus T, Galuska DA, Lowry R, Wechsler H. Reliability and validity of self-reported height and weight among high school students. J Adolesc Health 2003;32:281–7.
State and Large Urban School District Youth Risk Behavior Survey Coordinators
States: Alabama, Elainer Jones, MEd, Department of Education; Alaska, Wendy S. Hamilton, Department of Health and Social Services; Arizona, Jean Ajamie, Department of Education; Arkansas, Kathleen Courtney, MS, Department of Education; Colorado, Amy Dillon, MEd, Department of Education; Connecticut, Diane Aye, PhD, Department of Public Health; Delaware, John B. Ray, MS, Department of Education; Florida, Meredith Jagger, MS, Department of Health; Georgia, Suparna Bagchi, DrPH, Department of Health; Hawaii, Katherine Sakuda, MEd, Department of Education; Idaho, Patricia Stewart, Department of Education; Illinois, Glenn Steinhausen, PhD, State Board of Education; Indiana, Joseph A. Haddix, MPH, Department of Health; Iowa, Sara A. Peterson, MA, Department of Education; Kansas, Mark Thompson, PhD, State Department of Education; Kentucky, Stephanie Bunge, MEd, Department of Education; Louisiana, Raegan Carter, MPH, Department of Education; Maine, Jean Zimmerman, MS, Department of Education; Maryland, Richard D. Scott, DMin, Department of Education; Massachusetts, Chiniqua Milligan, MPH, Department of Elementary and Secondary Education; Michigan, Kimberly Kovalchick, MPH, Department of Education; Mississippi, Shalonda Matthews, MS, Department of Education; Montana, Susan Court, Office of Public Instruction; Nebraska, Julane Hill, Department of Education; New Hampshire, Mary Bubnis, MEd, Department of Education; New Jersey, Gregory Kocher, MS, Department of Education; New Mexico, Kristine M. Meurer, PhD, Public Education Department; New York, Martha R. Morrissey, MA, Department of Education; North Carolina, Sherry Lehman, MEd, Department of Public Instruction; North Dakota, Gail Schauer, MS, Department of Public Instruction; Ohio, Angela Norton, MA, Department of Health; Oklahoma, Thad Burk, MPH, Department of Health; Rhode Island, Bruce Cryan, MS, Department of Health; South Carolina, Delores Pluto, PhD, Department of Education; South Dakota, Amy Beshara, Department of Education; Tennessee, Mark A. Bloodworth, EdS, Department of Education; Texas, Jennifer Haussler Garing, MS, Department of State Health Services; Utah, Michael Friedrichs, MS, Department of Health; Vermont, Jessie Brosseau, MPH, Department of Health; Virginia, Shanee Harmon, MS, Department of Health; West Virginia, Rick Deem, MS, Department of Education; Wisconsin, Emily S. Holder, MA, Department of Public Instruction; Wyoming, Shannon Cranmore, Department of Education.
Large Urban School Districts: Boston, MA, Barbara Huscher Cohen, MEd, Boston Public Schools; Broward County, FL, Sebrina James, MS, Broward County Public Schools; Charlotte, NC, Nancy A. Langenfeld, MS, Charlotte-Mecklenburg Schools; Chicago, IL, Blair Harvey-Gintoft, MA, Chicago Public Schools; Dallas, TX, Angelica Duran Harkins, LMSW, Dallas Independent School District; Detroit, MI, Arlene Richardson, EdD, Detroit Public Schools; District of Columbia, Julie Christine Ost, MPH, Office of the State Superintendent of Education; Duval County, FL, Kathleen Bowles, MAT, Duval County Public Schools; Houston, TX, Rose Haggerty, MEd, Houston Independent School District; Los Angeles, CA, Timothy Kordic, MA, Los Angeles Unified School District; Memphis, TN, Carla Shirley, PhD, Memphis City Schools; Miami-Dade County, FL, Rodolfo Abella, PhD, Miami-Dade County Public Schools; Milwaukee, WI, Brett A. Fuller, MAE, Milwaukee Public Schools; New York City, NY, Kinjia Hinterland, MPH, New York City Department of Health and Mental Hygiene; Orange County, FL, Brenda Christopher-Muench, Orange County Public Schools; Palm Beach, FL, Danette Fitzgerald, MS, School District of Palm Beach County; Philadelphia, PA, Bettyann Creighton, MEd, School District of Philadelphia; San Bernardino, CA, Charlene D. Long, San Bernardino City Unified School District; San Diego, CA, Marge Kleinsmith-Hildebrand, MS, San Diego Unified School District; San Francisco, CA, Kim Levine, MHA, San Francisco Unified School District; Seattle, WA, Lisa Sharp, Seattle Public Schools.
Figure. State and Large Urban School District Youth Risk Behavior Surveys – United States, 2011
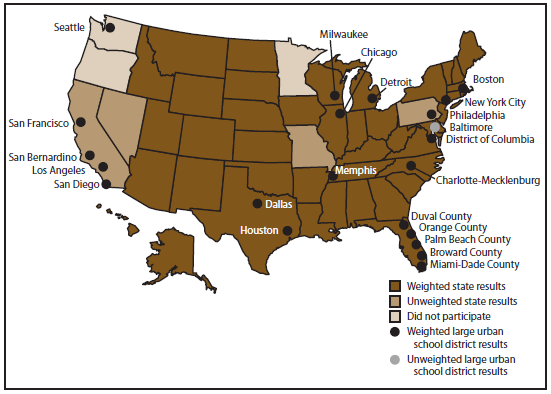
* A questionnaire that fails quality control has <20 remaining responses after editing or has the same answer to ≥15 questions in a row.
† Overall response rate = (number of participating schools/number of eligible sampled schools) x (number of usable questionnaires/number of eligible students sampled).
§ Pellet-sized pieces of highly purified cocaine.
¶ A process in which cocaine is dissolved in ether or sodium hydroxide and the precipitate is filtered off.
** Green salad, potatoes (excluding French fries, fried potatoes, or potato chips), carrots, or other vegetables.
†† Because of changes in question context starting in 2011, national YRBS prevalence estimates derived from the 60 minutes of physical activity question in 2011 are not comparable to those reported in 2009 or earlier. On the 2005–2009 national YRBS questionnaire, physical activity was assessed with three questions (in the following order) that asked the number of days students participated in 1) at least 20 minutes of vigorous physical activity; 2) at least 30 minutes of moderate physical activity; and 3) at least 60 minutes of aerobic (moderate and vigorous) physical activity. On the 2011 national YRBS questionnaire, only the 60 minutes of aerobic physical activity question was included.
§§ On the 2005–2009 national YRBS questionnaire, physical activity was assessed with three questions (in the following order) that asked the number of days students participated in 1) at least 20 minutes of vigorous physical activity; 2) at least 30 minutes of moderate physical activity; and 3) at least 60 minutes of aerobic (moderate and vigorous) physical activity. On the 2011 national YRBS questionnaire, only the 60 minutes of aerobic physical activity question was included.
Alternate Text: United States map showing data from the 43 state and 21 large urban district surveys with weighted data for the 2011 YRBSS cycle.
|
TABLE 2. (Continued) Sample sizes, response rates, and demographic characteristics*— United States and selected U.S. sites, Youth Risk Behavior Surveys, 2011 |
||||||||||||||
|---|---|---|---|---|---|---|---|---|---|---|---|---|---|---|
|
Site |
Student sample size |
Response rate (%) |
Sex (%) |
Grade (%) |
Race/Ethnicity (%) |
|||||||||
|
School |
Student |
Overall |
Female |
Male |
9 |
10 |
11 |
12 |
White† |
Black† |
Hispanic |
Other§ |
||
|
Large urban school district surveys |
||||||||||||||
|
Boston, MA |
1,013 |
95 |
72 |
68 |
48.9 |
51.1 |
27.0 |
23.9 |
23.7 |
25.1 |
13.1 |
36.9 |
39.2 |
10.8 |
|
Broward County, FL |
1,681 |
100 |
80 |
80 |
49.1 |
50.9 |
25.0 |
25.8 |
24.1 |
24.8 |
30.2 |
38.5 |
24.8 |
6.5 |
|
Charlotte-Mecklenburg, NC |
1,555 |
100 |
85 |
85 |
49.7 |
50.3 |
31.6 |
26.5 |
22.0 |
19.3 |
33.6 |
44.4 |
13.6 |
8.4 |
|
Chicago, IL |
1,907 |
84 |
82 |
69 |
52.1 |
47.9 |
28.7 |
28.6 |
21.6 |
20.6 |
9.0 |
46.1 |
40.4 |
4.5 |
|
Dallas, TX |
1,152 |
100 |
61 |
61 |
50.4 |
49.6 |
31.9 |
24.6 |
22.4 |
20.9 |
3.7 |
25.1 |
68.2 |
3.0 |
|
Detroit, MI |
2,237 |
100 |
86 |
86 |
52.7 |
47.3 |
25.4 |
28.2 |
22.4 |
23.3 |
0.2 |
95.9 |
2.1 |
1.8 |
|
District of Columbia |
1,396 |
100 |
74 |
74 |
51.3 |
48.7 |
31.1 |
25.1 |
23.0 |
20.3 |
10.6 |
64.6 |
10.6 |
14.2 |
|
Duval County, FL |
3,336 |
100 |
76 |
76 |
50.2 |
49.8 |
28.3 |
27.2 |
22.8 |
21.3 |
41.1 |
46.1 |
7.5 |
5.3 |
|
Houston, TX |
2,182 |
100 |
86 |
86 |
49.3 |
50.7 |
29.8 |
25.2 |
22.8 |
22.1 |
8.8 |
29.5 |
57.0 |
4.7 |
|
Los Angeles, CA |
1,767 |
100 |
86 |
86 |
48.0 |
52.0 |
35.0 |
25.8 |
21.5 |
17.1 |
8.6 |
11.1 |
73.6 |
6.7 |
|
Memphis, TN |
1,466 |
100 |
71 |
71 |
50.2 |
49.8 |
27.3 |
25.6 |
24.2 |
22.8 |
6.8 |
86.6 |
3.1 |
3.5 |
|
Miami-Dade County, FL |
2,302 |
98 |
76 |
75 |
50.2 |
49.8 |
27.2 |
26.0 |
22.8 |
23.6 |
9.4 |
24.6 |
64.1 |
1.8 |
|
Milwaukee, WI |
1,862 |
100 |
71 |
71 |
49.0 |
51.0 |
31.5 |
23.3 |
25.2 |
19.0 |
11.9 |
62.1 |
19.9 |
6.1 |
|
New York City, NY |
11,570 |
93 |
79 |
73 |
50.0 |
50.0 |
29.7 |
27.2 |
22.1 |
20.5 |
14.1 |
34.6 |
35.4 |
15.9 |
|
Orange County, FL |
1,524 |
95 |
84 |
80 |
49.9 |
50.1 |
27.0 |
26.1 |
24.0 |
22.7 |
41.8 |
20.4 |
31.7 |
6.1 |
|
Palm Beach County, FL |
2,198 |
96 |
78 |
75 |
49.7 |
50.3 |
26.4 |
25.9 |
23.4 |
23.9 |
40.7 |
27.9 |
24.9 |
6.4 |
|
Philadelphia, PA |
1,539 |
94 |
78 |
73 |
50.9 |
49.1 |
28.1 |
26.5 |
22.8 |
22.4 |
13.1 |
61.1 |
16.3 |
9.5 |
|
San Bernardino, CA |
1,430 |
100 |
80 |
80 |
49.6 |
50.4 |
28.3 |
26.9 |
23.7 |
21.0 |
10.7 |
15.8 |
68.8 |
4.6 |
|
San Diego, CA |
1,529 |
100 |
86 |
86 |
48.7 |
51.3 |
27.7 |
26.1 |
23.7 |
22.4 |
23.7 |
11.9 |
42.6 |
21.8 |
|
San Francisco, CA |
2,220 |
95 |
77 |
74 |
49.3 |
50.7 |
25.3 |
26.0 |
24.4 |
23.4 |
8.5 |
9.9 |
21.1 |
60.5 |
|
Seattle, WA |
1,896 |
100 |
84 |
84 |
47.9 |
52.1 |
28.8 |
25.7 |
22.7 |
21.9 |
40.0 |
22.5 |
6.3 |
31.2 |
|
* Weighted population estimates for the United States and each site. † Non-Hispanic. § American Indian or Alaska Native, Asian, Native Hawaiian or other Pacific Islander, and multiple race (non-Hispanic). |
||||||||||||||
|
TABLE 4. (Continued) Percentage of high school students who rarely or never wore a bicycle helmet* and who rarely or never wore a seat belt,† by sex — selected U.S. sites, Youth Risk Behavior Survey, 2011 |
||||||||||||
|---|---|---|---|---|---|---|---|---|---|---|---|---|
|
Site |
Rarely or never wore a bicycle helmet |
Rarely or never wore a seat belt |
||||||||||
|
Female |
Male |
Total |
Female |
Male |
Total |
|||||||
|
% |
CI§ |
% |
CI |
% |
CI |
% |
CI |
% |
CI |
% |
CI |
|
|
Large urban school district surveys |
||||||||||||
|
Boston, MA |
90.6 |
(85.3–94.1) |
92.4 |
(87.1–95.6) |
91.6 |
(87.8–94.4) |
18.0 |
(14.6–21.9) |
29.5 |
(24.9–34.5) |
23.8 |
(21.2–26.6) |
|
Broward County, FL |
87.3 |
(84.0–90.1) |
90.8 |
(88.1–93.0) |
89.3 |
(87.0–91.2) |
6.4 |
(4.8–8.5) |
10.2 |
(8.2–12.6) |
8.4 |
(7.2–9.8) |
|
Charlotte-Mecklenburg, NC |
— |
— |
— |
— |
— |
— |
8.8 |
(6.3–12.1) |
13.5 |
(11.1–16.4) |
11.3 |
(9.2–13.7) |
|
Chicago, IL |
93.9 |
(90.1–96.3) |
95.8 |
(93.6–97.2) |
94.3 |
(92.0–96.0) |
11.1 |
(8.5–14.3) |
16.6 |
(13.7–19.8) |
13.9 |
(11.6–16.6) |
|
Dallas, TX |
93.4 |
(90.1–95.7) |
93.9 |
(90.3–96.2) |
93.7 |
(91.3–95.5) |
6.1 |
(3.8–9.8) |
8.9 |
(6.1–12.8) |
7.6 |
(5.4–10.6) |
|
Detroit, MI |
72.1 |
(65.4–78.0) |
91.0 |
(86.7–94.0) |
82.3 |
(78.1–85.8) |
8.3 |
(6.7–10.3) |
18.2 |
(14.4–22.7) |
13.2 |
(11.1–15.5) |
|
District of Columbia |
— |
— |
— |
— |
— |
— |
8.3 |
(6.5–10.6) |
13.1 |
(10.2–16.8) |
10.9 |
(8.9–13.3) |
|
Duval County, FL |
87.9 |
(85.3–90.1) |
91.2 |
(88.9–93.1) |
89.7 |
(88.0–91.2) |
10.3 |
(8.6–12.3) |
15.2 |
(13.0–17.7) |
12.9 |
(11.4–14.5) |
|
Houston, TX |
88.1 |
(83.7–91.4) |
91.3 |
(88.8–93.3) |
89.9 |
(87.3–92.0) |
9.0 |
(7.0–11.4) |
11.2 |
(9.3–13.5) |
10.1 |
(8.5–11.9) |
|
Los Angeles, CA |
86.9 |
(81.2–91.1) |
87.3 |
(81.1–91.6) |
86.8 |
(81.5–90.8) |
4.6 |
(3.1–6.8) |
6.7 |
(3.8–11.5) |
5.9 |
(4.4–7.9) |
|
Memphis, TN |
92.0 |
(88.7–94.4) |
91.1 |
(88.0–93.5) |
91.5 |
(89.4–93.2) |
5.7 |
(4.0–8.0) |
8.9 |
(7.0–11.4) |
7.3 |
(6.0–8.8) |
|
Miami-Dade County, FL |
89.8 |
(87.1–92.1) |
90.8 |
(87.4–93.4) |
90.4 |
(88.1–92.3) |
9.4 |
(7.4–11.8) |
14.5 |
(11.9–17.5) |
12.0 |
(10.2–14.0) |
|
Milwaukee, WI |
— |
— |
— |
— |
— |
— |
21.6 |
(18.5–25.0) |
26.4 |
(22.6–30.5) |
24.0 |
(21.4–26.8) |
|
New York City, NY |
86.0 |
(82.5–88.8) |
89.0 |
(86.9–90.8) |
87.6 |
(85.0–89.7) |
— |
— |
— |
— |
— |
— |
|
Orange County, FL |
87.5 |
(83.0–91.0) |
89.1 |
(85.5–91.8) |
88.4 |
(85.4–90.8) |
5.6 |
(4.0–7.8) |
8.9 |
(7.2–11.1) |
7.2 |
(6.0–8.8) |
|
Palm Beach County, FL |
86.3 |
(83.7–88.5) |
91.6 |
(88.8–93.7) |
89.2 |
(87.1–91.0) |
6.9 |
(5.3–9.1) |
10.0 |
(7.7–12.9) |
8.4 |
(6.8–10.5) |
|
Philadelphia, PA |
90.3 |
(86.2–93.2) |
93.5 |
(90.7–95.6) |
92.1 |
(89.4–94.1) |
23.8 |
(20.5–27.4) |
27.6 |
(23.6–32.0) |
25.8 |
(22.8–29.0) |
|
San Bernardino, CA |
87.6 |
(84.0–90.4) |
92.1 |
(88.4–94.7) |
90.2 |
(87.8–92.1) |
6.2 |
(4.6–8.4) |
5.1 |
(3.4–7.5) |
5.6 |
(4.3–7.3) |
|
San Diego, CA |
73.6 |
(67.8–78.8) |
79.1 |
(73.2–84.1) |
76.8 |
(71.8–81.1) |
3.3 |
(2.1–5.1) |
4.9 |
(3.4–7.0) |
4.1 |
(3.0–5.6) |
|
San Francisco, CA |
52.4 |
(46.3–58.5) |
64.2 |
(58.5–69.5) |
59.3 |
(54.8–63.5) |
11.9 |
(8.5–16.3) |
11.8 |
(8.9–15.3) |
12.2 |
(9.6–15.5) |
|
Seattle, WA |
— |
— |
— |
— |
— |
— |
— |
— |
— |
— |
— |
— |
|
Median |
87.6 |
91.1 |
89.7 |
8.3 |
11.8 |
10.9 |
||||||
|
Range |
52.4–93.9 |
64.2–95.8 |
59.3–94.3 |
3.3–23.8 |
4.9–29.5 |
4.1–25.8 |
||||||
|
* Among students who had ridden a bicycle during the 12 months before the survey. † When riding in a car driven by someone else. § 95% confidence interval. ¶ Not available. |
||||||||||||
|
TABLE 6. (Continued) Percentage of high school students who rode in a car or other vehicle driven by someone who had been drinking alcohol* and who drove a car or other vehicle when they had been drinking alcohol,* by sex — selected U.S. sites, Youth Risk Behavior Survey, 2011 |
||||||||||||
|---|---|---|---|---|---|---|---|---|---|---|---|---|
|
Site |
Rode with a driver who had been drinking alcohol |
Drove when drinking alcohol |
||||||||||
|
Female |
Male |
Total |
Female |
Male |
Total |
|||||||
|
% |
CI† |
% |
CI |
% |
CI |
% |
CI |
% |
CI |
% |
CI |
|
|
Large urban school district surveys |
||||||||||||
|
Boston, MA |
22.7 |
(18.8–27.2) |
21.4 |
(17.1–26.5) |
22.0 |
(19.2–25.0) |
4.9 |
(2.8–8.5) |
6.1 |
(4.0–9.2) |
5.5 |
(4.1–7.4) |
|
Broward County, FL |
23.8 |
(20.7–27.1) |
24.8 |
(21.9–27.9) |
24.4 |
(22.1–27.0) |
5.2 |
(3.9–7.0) |
11.3 |
(8.9–14.3) |
8.5 |
(7.0–10.4) |
|
Charlotte-Mecklenburg, NC |
23.1 |
(20.2–26.2) |
23.9 |
(20.3–27.9) |
23.8 |
(21.5–26.1) |
5.5 |
(4.0–7.4) |
10.5 |
(8.5–13.0) |
8.1 |
(6.7–9.9) |
|
Chicago, IL |
33.1 |
(29.6–36.9) |
33.3 |
(30.0–36.7) |
33.2 |
(30.7–35.7) |
4.8 |
(3.2–7.1) |
10.7 |
(8.8–12.9) |
7.6 |
(6.3–9.2) |
|
Dallas, TX |
32.2 |
(27.5–37.3) |
36.2 |
(32.3–40.3) |
34.2 |
(31.1–37.4) |
6.9 |
(4.8–9.9) |
9.9 |
(7.3–13.4) |
8.3 |
(6.4–10.7) |
|
Detroit, MI |
25.3 |
(21.9–29.0) |
26.9 |
(23.2–30.9) |
26.2 |
(23.4–29.1) |
2.9 |
(1.9–4.3) |
4.7 |
(3.0–7.3) |
3.9 |
(2.9–5.2) |
|
District of Columbia |
23.6 |
(20.6–26.9) |
22.2 |
(18.9–25.8) |
22.8 |
(20.8–24.9) |
2.9 |
(1.9–4.3) |
7.5 |
(5.5–10.2) |
5.4 |
(4.1–7.2) |
|
Duval County, FL |
28.4 |
(25.8–31.1) |
27.6 |
(25.3–30.1) |
28.2 |
(26.4–30.1) |
8.4 |
(6.8–10.2) |
9.1 |
(7.5–11.1) |
8.9 |
(7.7–10.2) |
|
Houston, TX |
31.9 |
(28.5–35.5) |
31.4 |
(28.0–35.0) |
31.7 |
(29.2–34.3) |
6.2 |
(4.9–7.9) |
9.5 |
(7.4–12.1) |
8.0 |
(6.6–9.6) |
|
Los Angeles, CA |
23.0 |
(19.8–26.4) |
25.1 |
(22.3–28.3) |
24.3 |
(21.6–27.2) |
2.6 |
(1.7–4.2) |
8.5 |
(5.4–13.1) |
5.9 |
(4.1–8.5) |
|
Memphis, TN |
21.2 |
(18.2–24.5) |
21.3 |
(18.1–24.9) |
21.3 |
(18.9–24.0) |
2.4 |
(1.5–3.7) |
3.4 |
(2.1–5.5) |
2.9 |
(2.0–4.3) |
|
Miami-Dade County, FL |
28.4 |
(25.0–32.0) |
24.1 |
(20.5–28.1) |
26.2 |
(23.6–29.0) |
6.4 |
(5.0–8.1) |
9.0 |
(6.6–12.0) |
7.7 |
(6.3–9.3) |
|
Milwaukee, WI |
24.1 |
(21.0–27.5) |
21.8 |
(18.4–25.6) |
23.2 |
(20.7–25.9) |
3.1 |
(2.1–4.4) |
5.7 |
(4.2–7.8) |
4.5 |
(3.5–5.8) |
|
New York City, NY |
— |
— |
— |
— |
— |
— |
1.9 |
(1.3–2.6) |
3.6 |
(3.0–4.5) |
2.9 |
(2.3–3.5) |
|
Orange County, FL |
24.2 |
(20.2–28.6) |
24.1 |
(21.0–27.6) |
24.1 |
(21.3–27.1) |
5.9 |
(4.2–8.2) |
10.1 |
(7.7–13.2) |
8.0 |
(6.4–9.9) |
|
Palm Beach County, FL |
31.4 |
(28.4–34.5) |
25.9 |
(23.1–29.0) |
28.7 |
(26.5–31.0) |
9.9 |
(7.8–12.6) |
13.7 |
(11.2–16.6) |
11.9 |
(10.0–14.1) |
|
Philadelphia, PA |
23.3 |
(20.3–26.5) |
21.4 |
(18.2–24.8) |
22.2 |
(19.8–24.7) |
3.9 |
(2.8–5.5) |
5.3 |
(3.6–7.7) |
4.7 |
(3.6–6.0) |
|
San Bernardino, CA |
30.1 |
(26.2–34.3) |
29.8 |
(25.3–34.7) |
29.9 |
(26.8–33.2) |
4.5 |
(3.0–6.5) |
8.7 |
(6.7–11.2) |
6.6 |
(5.2–8.2) |
|
San Diego, CA |
24.0 |
(20.0–28.5) |
23.8 |
(20.4–27.6) |
24.0 |
(21.1–27.0) |
5.0 |
(3.5–7.1) |
8.7 |
(6.7–11.1) |
6.8 |
(5.5–8.5) |
|
San Francisco, CA |
17.9 |
(15.3–20.7) |
16.9 |
(14.2–20.2) |
17.6 |
(15.6–19.9) |
3.5 |
(2.3–5.3) |
5.0 |
(3.4–7.5) |
4.5 |
(3.2–6.1) |
|
Seattle, WA |
19.8 |
(16.6–23.4) |
22.1 |
(18.4–26.2) |
21.1 |
(18.4–24.1) |
4.3 |
(3.1–6.0) |
8.8 |
(6.7–11.3) |
6.9 |
(5.6–8.5) |
|
Median |
24.0 |
24.1 |
24.2 |
4.8 |
8.7 |
6.8 |
||||||
|
Range |
17.9–33.1 |
16.9–36.2 |
17.6–34.2 |
1.9–9.9 |
3.4–13.7 |
2.9–11.9 |
||||||
|
* One or more times during the 30 days before the survey. † 95% confidence interval. § Not available. |
||||||||||||
|
TABLE 9. (Continued) Percentage of high school students who carried a weapon*,† and who carried a gun,† by sex — selected U.S. sites, Youth Risk Behavior Survey, 2011 |
||||||||||||
|---|---|---|---|---|---|---|---|---|---|---|---|---|
|
Site |
Carried a weapon |
Carried a gun |
||||||||||
|
Female |
Male |
Total |
Female |
Male |
Total |
|||||||
|
% |
CI§ |
% |
CI |
% |
CI |
% |
CI |
% |
CI |
% |
CI |
|
|
Large urban school district surveys |
||||||||||||
|
Boston, MA |
9.3 |
(6.5–13.3) |
21.5 |
(17.1–26.7) |
15.4 |
(12.0–19.6) |
0.9 |
(0.3–2.4) |
5.8 |
(3.4–9.7) |
3.3 |
(2.0–5.6) |
|
Broward County, FL |
5.3 |
(3.8–7.4) |
17.0 |
(14.3–20.1) |
11.4 |
(9.6–13.6) |
1.5 |
(0.6–3.4) |
6.0 |
(4.0–8.9) |
3.9 |
(2.5–5.9) |
|
Charlotte-Mecklenburg, NC |
7.5 |
(5.8–9.7) |
24.4 |
(21.4–27.6) |
15.9 |
(13.8–18.3) |
1.7 |
(1.0–2.8) |
8.9 |
(6.8–11.7) |
5.4 |
(4.1–7.0) |
|
Chicago, IL |
12.5 |
(9.4–16.4) |
21.1 |
(17.9–24.6) |
16.5 |
(13.8–19.7) |
2.0 |
(1.3–3.1) |
9.5 |
(7.8–11.6) |
5.8 |
(4.6–7.2) |
|
Dallas, TX |
6.8 |
(5.0–9.1) |
22.4 |
(17.6–27.9) |
14.4 |
(11.6–17.7) |
1.0 |
(0.5–2.2) |
9.1 |
(6.8–12.1) |
5.0 |
(3.6–6.8) |
|
Detroit, MI |
8.0 |
(6.2–10.4) |
18.2 |
(14.6–22.5) |
13.2 |
(11.3–15.5) |
1.4 |
(0.8–2.4) |
7.3 |
(5.1–10.3) |
4.4 |
(3.3–5.9) |
|
District of Columbia |
13.8 |
(11.1–17.1) |
23.8 |
(20.2–27.8) |
18.9 |
(16.3–21.7) |
2.3 |
(1.3–4.1) |
12.5 |
(9.9–15.6) |
7.5 |
(5.8–9.7) |
|
Duval County, FL |
11.1 |
(9.5–13.0) |
26.5 |
(24.1–29.1) |
18.8 |
(17.1–20.6) |
3.2 |
(2.4–4.4) |
11.1 |
(9.4–13.0) |
7.1 |
(6.1–8.3) |
|
Houston, TX |
6.2 |
(4.8–8.0) |
21.5 |
(18.8–24.4) |
13.9 |
(12.2–15.9) |
1.2 |
(0.7–2.1) |
9.1 |
(7.1–11.7) |
5.3 |
(4.2–6.7) |
|
Los Angeles, CA |
5.7 |
(4.1–8.0) |
18.5 |
(15.0–22.5) |
12.5 |
(10.3–15.1) |
1.6 |
(0.8–2.9) |
6.7 |
(4.2–10.5) |
4.4 |
(3.0–6.5) |
|
Memphis, TN |
6.5 |
(4.9–8.7) |
16.5 |
(14.2–19.0) |
11.4 |
(9.9–13.1) |
1.3 |
(0.7–2.4) |
9.6 |
(7.8–11.9) |
5.5 |
(4.4–6.7) |
|
Miami-Dade County, FL |
6.4 |
(4.8–8.6) |
15.9 |
(13.2–19.1) |
11.1 |
(9.2–13.4) |
2.0 |
(1.2–3.4) |
7.5 |
(5.7–10.0) |
4.8 |
(3.6–6.3) |
|
Milwaukee, WI |
8.0 |
(6.0–10.8) |
21.7 |
(18.6–25.1) |
14.9 |
(12.8–17.4) |
1.4 |
(0.6–3.1) |
12.7 |
(10.1–15.9) |
7.1 |
(5.6–9.1) |
|
New York City, NY |
5.5 |
(4.5–6.7) |
12.5 |
(11.2–14.0) |
9.1 |
(8.2–10.1) |
0.7 |
(0.5–1.1) |
3.8 |
(3.1–4.7) |
2.3 |
(1.9–2.8) |
|
Orange County, FL |
7.5 |
(5.5–10.3) |
20.2 |
(17.1–23.7) |
13.8 |
(11.9–15.9) |
2.0 |
(1.3–3.2) |
6.9 |
(5.0–9.6) |
4.4 |
(3.4–5.8) |
|
Palm Beach County, FL |
7.9 |
(6.3–9.9) |
20.4 |
(17.4–23.6) |
14.2 |
(12.4–16.2) |
3.0 |
(2.0–4.5) |
7.0 |
(5.3–9.3) |
5.1 |
(4.0–6.5) |
|
Philadelphia, PA |
10.2 |
(8.1–12.7) |
20.7 |
(17.3–24.6) |
15.6 |
(13.5–17.9) |
1.5 |
(0.7–2.9) |
9.0 |
(6.9–11.6) |
5.4 |
(4.3–6.7) |
|
San Bernardino, CA |
6.4 |
(4.8–8.5) |
19.8 |
(15.9–24.3) |
13.1 |
(10.9–15.5) |
0.9 |
(0.4–1.8) |
7.4 |
(5.2–10.6) |
4.2 |
(3.0–5.8) |
|
San Diego, CA |
6.2 |
(4.4–8.6) |
17.9 |
(15.4–20.8) |
12.2 |
(10.6–14.1) |
0.8 |
(0.4–1.9) |
6.6 |
(4.6–9.4) |
3.9 |
(2.7–5.4) |
|
San Francisco, CA |
6.7 |
(5.1–8.8) |
14.8 |
(12.2–17.7) |
11.4 |
(9.4–13.6) |
1.9 |
(1.1–3.1) |
6.0 |
(4.2–8.6) |
4.3 |
(3.2–5.8) |
|
Seattle, WA |
— |
— |
— |
— |
— |
— |
2.1 |
(1.4–3.3) |
7.9 |
(6.1–10.3) |
5.3 |
(4.2–6.7) |
|
Median |
7.1 |
20.3 |
13.8 |
1.5 |
7.5 |
5.0 |
||||||
|
Range |
5.3–13.8 |
12.5–26.5 |
9.1–18.9 |
0.7–3.2 |
3.8–12.7 |
2.3–7.5 |
||||||
|
* For example, a gun, knife, or club. † On at least 1 day during the 30 days before the survey. § 95% confidence interval. ¶ Not available. |
||||||||||||
| TABLE 11. (Continued) Percentage of high school students who carried a weapon on school property*,† and who were threatened or injured with a weapon on school property,†,§ by sex — selected U.S. sites, Youth Risk Behavior Survey, 2011 |
||||||||||||
|---|---|---|---|---|---|---|---|---|---|---|---|---|
| Site |
Carried a weapon on school property |
Threatened or injured with a weapon on school property |
||||||||||
| Female |
Male |
Total |
Female |
Male |
Total |
|||||||
| % |
CI¶ |
% |
CI |
% |
CI |
% |
CI |
% |
CI |
% |
CI |
|
Large urban school district surveys |
||||||||||||
Boston, MA |
4.7 |
(2.7–8.1) |
8.1 |
(5.6–11.6) |
6.4 |
(4.5–9.1) |
6.3 |
(4.7–8.5) |
10.1 |
(7.0–14.3) |
8.2 |
(6.3–10.7) |
Broward County, FL |
2.2 |
(1.2–4.0) |
4.6 |
(3.1–6.7) |
3.5 |
(2.4–5.0) |
6.0 |
(4.5–8.0) |
8.0 |
(6.1–10.3) |
7.1 |
(5.8–8.6) |
Charlotte-Mecklenburg, NC |
2.5 |
(1.6–4.0) |
5.3 |
(3.9–7.2) |
4.0 |
(3.0–5.3) |
5.3 |
(3.8–7.4) |
13.9 |
(11.0–17.4) |
10.2 |
(8.2–12.6) |
Chicago, IL |
4.4 |
(3.0–6.4) |
5.0 |
(3.7–6.8) |
4.7 |
(3.6–6.1) |
8.1 |
(6.4–10.4) |
13.6 |
(11.2–16.4) |
11.1 |
(9.4–13.1) |
Dallas, TX |
1.9 |
(1.0–3.6) |
5.5 |
(3.5–8.6) |
3.7 |
(2.5–5.4) |
4.6 |
(2.8–7.6) |
9.7 |
(7.0–13.2) |
7.1 |
(5.6–9.0) |
Detroit, MI |
2.7 |
(1.9–4.0) |
4.9 |
(3.2–7.4) |
4.2 |
(3.2–5.5) |
6.9 |
(5.4–8.8) |
8.3 |
(6.2–11.0) |
7.8 |
(6.5–9.3) |
District of Columbia |
3.1 |
(2.0–4.8) |
8.2 |
(5.7–11.5) |
5.5 |
(4.0–7.6) |
5.8 |
(4.1–8.0) |
11.1 |
(8.4–14.5) |
8.7 |
(7.0–10.7) |
Duval County, FL |
5.2 |
(4.2–6.5) |
7.8 |
(6.3–9.5) |
6.5 |
(5.6–7.6) |
8.8 |
(7.3–10.6) |
12.2 |
(10.6–13.9) |
10.7 |
(9.4–12.1) |
Houston, TX |
2.1 |
(1.3–3.2) |
6.0 |
(4.5–8.1) |
4.1 |
(3.3–5.0) |
5.0 |
(3.5–7.1) |
11.1 |
(9.0–13.5) |
8.2 |
(6.8–9.9) |
Los Angeles, CA |
1.9 |
(1.0–3.5) |
7.0 |
(4.6–10.5) |
4.8 |
(3.3–6.8) |
4.5 |
(3.0–6.7) |
10.4 |
(7.1–15.0) |
7.9 |
(6.0–10.2) |
Memphis, TN |
1.7 |
(0.9–3.1) |
2.5 |
(1.5–4.0) |
2.1 |
(1.4–3.1) |
7.3 |
(5.5–9.5) |
8.9 |
(7.1–11.2) |
8.2 |
(6.6–10.1) |
Miami-Dade County, FL |
2.4 |
(1.6–3.6) |
5.2 |
(3.7–7.1) |
3.7 |
(2.8–4.9) |
6.2 |
(4.9–7.9) |
8.7 |
(6.9–10.9) |
7.5 |
(6.3–8.9) |
Milwaukee, WI |
3.8 |
(2.5–5.9) |
5.3 |
(3.4–8.1) |
4.6 |
(3.4–6.2) |
6.8 |
(5.1–9.1) |
10.0 |
(7.7–12.9) |
8.7 |
(6.9–10.8) |
New York City, NY |
1.8 |
(1.3–2.5) |
5.3 |
(4.4–6.3) |
3.6 |
(3.1–4.3) |
4.8 |
(4.0–5.8) |
8.3 |
(7.2–9.4) |
6.7 |
(5.9–7.6) |
Orange County, FL |
2.4 |
(1.5–3.7) |
5.2 |
(3.5–7.7) |
3.8 |
(2.8–5.0) |
5.6 |
(4.2–7.3) |
8.7 |
(6.2–12.1) |
7.1 |
(5.6–9.0) |
Palm Beach County, FL |
3.0 |
(1.9–4.6) |
7.0 |
(5.1–9.6) |
5.1 |
(3.8–6.8) |
6.9 |
(5.4–8.9) |
10.5 |
(8.6–12.8) |
8.9 |
(7.6–10.4) |
Philadelphia, PA |
2.7 |
(1.7–4.2) |
4.3 |
(3.0–6.1) |
3.7 |
(2.8–4.9) |
7.9 |
(5.9–10.4) |
9.0 |
(7.1–11.3) |
8.8 |
(7.3–10.5) |
San Bernardino, CA |
3.2 |
(2.1–4.8) |
6.5 |
(4.6–9.0) |
4.8 |
(3.7–6.2) |
7.6 |
(5.8–10.0) |
12.1 |
(9.7–15.0) |
9.9 |
(8.3–11.7) |
San Diego, CA |
2.4 |
(1.4–4.1) |
6.5 |
(4.7–9.0) |
4.5 |
(3.3–6.0) |
4.6 |
(3.3–6.3) |
8.5 |
(6.5–11.2) |
6.7 |
(5.3–8.4) |
San Francisco, CA |
2.8 |
(1.8–4.3) |
8.0 |
(6.1–10.4) |
5.8 |
(4.4–7.6) |
4.3 |
(3.0–6.1) |
8.6 |
(6.5–11.2) |
7.1 |
(5.7–8.7) |
Seattle, WA |
4.3 |
(3.2–5.9) |
11.1 |
(8.8–13.9) |
8.1 |
(6.6–9.8) |
4.5 |
(3.2–6.1) |
8.3 |
(6.7–10.3) |
6.9 |
(5.6–8.5) |
Median |
2.7 |
5.5 |
4.5 |
6.0 |
9.7 |
8.2 |
||||||
Range |
1.7–5.2 |
2.5–11.1 |
2.1–8.1 |
4.3–8.8 |
8.0–13.9 |
6.7–11.1 |
||||||
* On at least 1 day during the 30 days before the survey. † For example, a gun, knife, or club. § One or more times during the 12 months before the survey. ¶ 95% confidence interval. ** Not available. |
||||||||||||
| TABLE 13. (Continued) Percentage of high school students who were in a physical fight* and who were injured in a physical fight,*,† by sex — selected U.S. sites, Youth Risk Behavior Survey, 2011 |
||||||||||||
|---|---|---|---|---|---|---|---|---|---|---|---|---|
| Site |
In a physical fight |
Injured in a physical fight |
||||||||||
| Female |
Male |
Total |
Female |
Male |
Total |
|||||||
| % |
CI§ |
% |
CI |
% |
CI |
% |
CI |
% |
CI |
% |
CI |
|
Large urban school district surveys |
||||||||||||
Boston, MA |
24.2 |
(18.9–30.4) |
32.1 |
(27.4–37.3) |
28.2 |
(23.6–33.3) |
3.4 |
(2.4–4.7) |
5.2 |
(3.3–8.1) |
4.3 |
(3.2–5.8) |
Broward County, FL |
21.5 |
(18.1–25.4) |
36.0 |
(32.3–40.0) |
28.9 |
(26.2–31.8) |
3.1 |
(2.0–4.9) |
5.1 |
(3.8–6.7) |
4.2 |
(3.3–5.4) |
Charlotte-Mecklenburg, NC |
24.5 |
(21.7–27.6) |
38.3 |
(34.3–42.6) |
31.5 |
(28.5–34.6) |
2.4 |
(1.5–3.9) |
5.3 |
(3.7–7.5) |
3.9 |
(2.8–5.4) |
Chicago, IL |
36.5 |
(32.1–41.1) |
42.5 |
(38.1–46.9) |
39.3 |
(35.5–43.3) |
5.5 |
(4.3–6.9) |
7.6 |
(5.1–11.0) |
6.5 |
(5.0–8.5) |
Dallas, TX |
32.5 |
(28.5–36.7) |
42.2 |
(36.6–48.1) |
37.2 |
(33.6–40.9) |
2.5 |
(1.5–4.2) |
4.8 |
(2.9–8.0) |
3.6 |
(2.5–5.3) |
Detroit, MI |
29.3 |
(26.0–32.9) |
40.5 |
(36.3–44.9) |
34.7 |
(31.7–37.8) |
4.1 |
(2.8–5.9) |
6.0 |
(4.3–8.2) |
5.2 |
(4.1–6.5) |
District of Columbia |
33.5 |
(29.4–37.9) |
42.2 |
(38.1–46.4) |
37.9 |
(34.6–41.4) |
— |
— |
— |
— |
— |
— |
Duval County, FL |
27.2 |
(24.5–30.0) |
37.3 |
(34.5–40.2) |
32.3 |
(30.1–34.6) |
3.7 |
(2.7–4.9) |
7.0 |
(5.7–8.5) |
5.5 |
(4.6–6.5) |
Houston, TX |
27.5 |
(23.6–31.8) |
41.7 |
(38.0–45.5) |
34.7 |
(31.5–38.0) |
4.0 |
(2.8–5.8) |
7.5 |
(5.9–9.5) |
5.9 |
(4.8–7.1) |
Los Angeles, CA |
21.1 |
(19.0–23.4) |
36.3 |
(32.1–40.7) |
29.0 |
(26.5–31.7) |
2.7 |
(1.6–4.6) |
5.3 |
(3.2–8.7) |
4.1 |
(2.9–5.9) |
Memphis, TN |
29.9 |
(26.2–34.0) |
41.0 |
(36.5–45.7) |
35.4 |
(32.2–38.8) |
3.3 |
(2.0–5.3) |
6.3 |
(4.2–9.2) |
4.8 |
(3.5–6.5) |
Miami-Dade County, FL |
24.3 |
(21.1–27.8) |
36.8 |
(32.4–41.4) |
30.5 |
(27.2–34.0) |
3.1 |
(2.4–4.2) |
6.2 |
(4.7–8.2) |
4.6 |
(3.7–5.7) |
Milwaukee, WI |
39.1 |
(35.0–43.4) |
42.9 |
(38.9–46.9) |
41.0 |
(37.7–44.5) |
5.0 |
(3.5–7.0) |
6.9 |
(5.2–8.9) |
6.0 |
(4.8–7.6) |
New York City, NY |
23.8 |
(21.3–26.4) |
33.1 |
(31.3–34.9) |
28.6 |
(26.8–30.4) |
— |
— |
— |
— |
— |
— |
Orange County, FL |
19.2 |
(16.0–22.7) |
36.3 |
(31.8–41.1) |
27.6 |
(24.7–30.7) |
2.3 |
(1.3–3.8) |
4.8 |
(3.3–6.9) |
3.5 |
(2.6–4.7) |
Palm Beach County, FL |
20.8 |
(17.8–24.1) |
33.5 |
(29.9–37.2) |
27.2 |
(24.5–30.1) |
4.3 |
(3.0–6.0) |
6.5 |
(4.8–8.7) |
5.6 |
(4.5–6.9) |
Philadelphia, PA |
38.4 |
(34.0–43.0) |
45.8 |
(40.8–50.8) |
42.2 |
(38.7–45.8) |
6.3 |
(4.8–8.3) |
7.6 |
(5.6–10.3) |
7.2 |
(5.7–9.0) |
San Bernardino, CA |
27.5 |
(23.4–32.0) |
42.3 |
(37.6–47.1) |
34.9 |
(31.2–38.9) |
1.9 |
(1.1–3.1) |
6.4 |
(4.4–9.4) |
4.2 |
(3.0–5.8) |
San Diego, CA |
23.5 |
(20.1–27.3) |
34.2 |
(30.1–38.5) |
29.0 |
(26.0–32.2) |
2.3 |
(1.4–3.6) |
5.3 |
(3.8–7.3) |
3.8 |
(2.9–5.1) |
San Francisco, CA |
13.1 |
(10.9–15.7) |
23.3 |
(20.3–26.7) |
18.7 |
(16.6–21.0) |
2.0 |
(1.2–3.3) |
4.5 |
(3.0–6.6) |
3.7 |
(2.7–5.0) |
Seattle, WA |
— |
— |
— |
— |
— |
— |
— |
— |
— |
— |
— |
— |
Median |
25.8 |
37.8 |
31.9 |
3.2 |
6.1 |
4.4 |
||||||
Range |
13.1–39.1 |
23.3–45.8 |
18.7–42.2 |
1.9–6.3 |
4.5–7.6 |
3.5–7.2 |
||||||
* One or more times during the 12 months before the survey. † Injuries had to be treated by a doctor or nurse. § 95% confidence interval. ¶ Not available. |
||||||||||||
| TABLE 15. (Continued) Percentage of high school students who were in a physical fight on school property* and who were bullied on school property,† by sex — selected U.S. sites, Youth Risk Behavior Survey, 2011 |
||||||||||||
|---|---|---|---|---|---|---|---|---|---|---|---|---|
| Site |
In a physical fight on school property |
Bullied on school property |
||||||||||
| Female |
Male |
Total |
Female |
Male |
Total |
|||||||
| % |
CI§ |
% |
CI |
% |
CI |
% |
CI |
% |
CI |
% |
CI |
|
Large urban school district surveys |
||||||||||||
Boston, MA |
7.0 |
(4.6–10.5) |
10.4 |
(7.6–13.9) |
8.7 |
(6.6–11.4) |
17.7 |
(14.8–21.0) |
10.4 |
(7.2–14.6) |
13.9 |
(11.7–16.5) |
Broward County, FL |
7.3 |
(5.3–9.9) |
12.0 |
(9.9–14.4) |
9.8 |
(8.3–11.4) |
14.9 |
(12.2–18.1) |
11.7 |
(9.5–14.3) |
13.2 |
(11.3–15.4) |
Charlotte-Mecklenburg, NC |
8.1 |
(6.4–10.1) |
15.1 |
(12.1–18.7) |
11.7 |
(9.7–13.9) |
18.5 |
(15.3–22.2) |
18.8 |
(16.1–21.9) |
18.8 |
(16.5–21.2) |
Chicago, IL |
14.4 |
(11.6–17.8) |
20.7 |
(16.9–25.1) |
17.7 |
(14.8–20.9) |
13.3 |
(10.2–17.0) |
12.2 |
(10.0–14.9) |
12.8 |
(10.8–15.1) |
Dallas, TX |
12.8 |
(9.7–16.7) |
20.0 |
(15.7–25.1) |
16.3 |
(13.3–19.8) |
15.4 |
(11.8–19.9) |
10.1 |
(7.6–13.4) |
12.9 |
(10.4–15.9) |
Detroit, MI |
12.1 |
(9.9–14.8) |
19.4 |
(16.4–22.8) |
15.6 |
(13.6–17.7) |
23.6 |
(19.9–27.8) |
15.0 |
(12.3–18.1) |
19.5 |
(16.9–22.5) |
District of Columbia |
12.9 |
(10.4–16.1) |
18.3 |
(14.5–22.9) |
15.8 |
(13.0–19.2) |
7.2 |
(5.4–9.7) |
12.1 |
(9.0–16.0) |
9.7 |
(7.7–12.1) |
Duval County, FL |
11.2 |
(9.5–13.1) |
15.9 |
(13.8–18.3) |
13.7 |
(12.2–15.4) |
18.4 |
(16.4–20.5) |
16.8 |
(14.9–19.0) |
17.6 |
(16.2–19.2) |
Houston, TX |
11.5 |
(9.1–14.4) |
17.2 |
(14.6–20.1) |
14.5 |
(12.5–16.7) |
11.5 |
(9.6–13.7) |
12.4 |
(10.2–15.0) |
12.0 |
(10.4–13.8) |
Los Angeles, CA |
7.6 |
(5.8–9.8) |
17.2 |
(14.2–20.7) |
12.8 |
(10.8–15.1) |
16.7 |
(13.4–20.8) |
14.0 |
(10.2–18.7) |
15.3 |
(12.0–19.4) |
Memphis, TN |
11.9 |
(9.7–14.5) |
16.9 |
(13.6–20.9) |
14.4 |
(12.1–17.0) |
10.6 |
(8.6–13.1) |
10.2 |
(8.1–12.9) |
10.5 |
(8.9–12.5) |
Miami-Dade County, FL |
8.3 |
(6.7–10.4) |
16.1 |
(13.1–19.6) |
12.1 |
(10.1–14.4) |
11.3 |
(9.4–13.5) |
9.9 |
(7.9–12.2) |
10.6 |
(9.2–12.3) |
Milwaukee, WI |
15.4 |
(13.0–18.2) |
20.1 |
(16.6–24.1) |
17.8 |
(15.4–20.5) |
13.5 |
(11.1–16.3) |
11.0 |
(8.6–14.1) |
12.2 |
(10.4–14.3) |
New York City, NY |
— |
— |
— |
— |
— |
— |
11.8 |
(9.9–14.0) |
11.5 |
(10.2–13.0) |
11.7 |
(10.5–13.0) |
Orange County, FL |
7.0 |
(5.2–9.4) |
12.9 |
(10.5–15.8) |
10.0 |
(8.4–11.8) |
15.9 |
(12.9–19.5) |
12.5 |
(10.1–15.3) |
14.2 |
(12.3–16.4) |
Palm Beach County, FL |
7.3 |
(5.7–9.4) |
11.5 |
(9.3–14.1) |
9.6 |
(8.0–11.4) |
16.6 |
(14.5–18.9) |
14.4 |
(12.0–17.2) |
15.5 |
(13.8–17.4) |
Philadelphia, PA |
16.9 |
(14.0–20.3) |
20.7 |
(17.4–24.5) |
18.9 |
(16.4–21.8) |
12.6 |
(10.1–15.6) |
14.8 |
(11.9–18.1) |
13.8 |
(11.9–15.9) |
San Bernardino, CA |
11.4 |
(9.1–14.2) |
21.2 |
(18.0–24.8) |
16.4 |
(14.2–18.9) |
15.6 |
(12.4–19.4) |
13.0 |
(10.6–15.7) |
14.3 |
(12.1–16.8) |
San Diego, CA |
8.3 |
(6.3–11.0) |
13.3 |
(10.6–16.6) |
10.9 |
(9.1–13.1) |
17.6 |
(13.9–21.9) |
13.8 |
(11.4–16.5) |
15.6 |
(13.2–18.3) |
San Francisco, CA |
5.2 |
(3.7–7.4) |
9.3 |
(7.0–12.1) |
7.6 |
(6.3–9.3) |
9.2 |
(7.4–11.4) |
11.4 |
(9.3–13.8) |
10.6 |
(9.0–12.4) |
Seattle, WA |
8.0 |
(6.2–10.4) |
15.2 |
(12.9–17.7) |
12.1 |
(10.4–14.1) |
14.0 |
(11.9–16.5) |
14.1 |
(11.9–16.5) |
14.2 |
(12.7–15.9) |
Median |
9.7 |
16.5 |
13.2 |
14.9 |
12.4 |
13.8 |
||||||
Range |
5.2–16.9 |
9.3–21.2 |
7.6–18.9 |
7.2–23.6 |
9.9–18.8 |
9.7–19.5 |
||||||
* One or more times during the 12 months before the survey. † During the 12 months before the survey. § 95% confidence interval. ¶ Not available. |
||||||||||||
|
TABLE 17. (Continued) Percentage of high school students who were electronically bullied,*,† and who did not go to school because they felt unsafe at school or on their way to or from school§ by sex — selected U.S. sites, Youth Risk Behavior Survey, 2011 |
||||||||||||
|---|---|---|---|---|---|---|---|---|---|---|---|---|
|
Site |
Electronically bullied |
Did not go to school because of safety concerns |
||||||||||
|
Female |
Male |
Total |
Female |
Male |
Total |
|||||||
|
% |
CI¶ |
% |
CI |
% |
CI |
% |
CI |
% |
CI |
% |
CI |
|
|
Large urban school district surveys |
||||||||||||
|
Boston, MA |
14.9 |
(11.1–19.8) |
6.5 |
(3.7–11.0) |
10.8 |
(8.6–13.4) |
8.4 |
(6.2–11.3) |
8.4 |
(5.5–12.6) |
8.4 |
(6.3–11.1) |
|
Broward County, FL |
13.6 |
(11.3–16.2) |
8.4 |
(6.6–10.8) |
11.0 |
(9.4–12.8) |
8.3 |
(6.4–10.6) |
7.6 |
(5.9–9.7) |
8.0 |
(6.6–9.8) |
|
Charlotte-Mecklenburg, NC |
20.1 |
(16.7–24.0) |
11.6 |
(9.2–14.4) |
16.1 |
(13.9–18.7) |
7.5 |
(5.4–10.4) |
8.3 |
(6.1–11.3) |
8.4 |
(6.5–10.9) |
|
Chicago, IL |
14.5 |
(12.4–17.0) |
8.3 |
(6.4–10.6) |
11.5 |
(9.9–13.3) |
11.4 |
(8.8–14.6) |
9.8 |
(7.4–12.9) |
10.8 |
(8.8–13.2) |
|
Dallas, TX |
12.4 |
(9.6–15.9) |
5.7 |
(3.7–8.5) |
9.3 |
(7.2–11.9) |
7.4 |
(5.3–10.2) |
7.7 |
(5.4–10.9) |
7.5 |
(5.8–9.7) |
|
Detroit, MI |
9.0 |
(6.9–11.6) |
8.9 |
(6.8–11.5) |
9.1 |
(7.6–10.9) |
25.3 |
(21.6–29.3) |
14.9 |
(11.8–18.6) |
20.9 |
(18.3–23.7) |
|
District of Columbia |
11.5 |
(8.8–14.8) |
9.1 |
(6.7–12.2) |
10.6 |
(8.7–12.8) |
6.4 |
(4.6–8.8) |
8.7 |
(6.6–11.4) |
7.7 |
(6.3–9.4) |
|
Duval County, FL |
— |
— |
— |
— |
— |
— |
11.4 |
(9.5–13.5) |
10.5 |
(8.8–12.4) |
11.0 |
(9.7–12.6) |
|
Houston, TX |
13.2 |
(10.9–16.0) |
9.6 |
(7.7–11.8) |
11.4 |
(9.8–13.2) |
11.2 |
(8.9–13.9) |
12.2 |
(9.8–15.0) |
11.8 |
(9.9–14.0) |
|
Los Angeles, CA |
16.0 |
(13.5–18.8) |
9.5 |
(7.1–12.5) |
12.8 |
(10.8–15.2) |
7.8 |
(5.9–10.2) |
7.7 |
(5.6–10.5) |
7.9 |
(6.1–10.2) |
|
Memphis, TN |
10.9 |
(8.7–13.6) |
5.4 |
(3.8–7.6) |
8.2 |
(6.7–10.1) |
7.7 |
(5.9–10.0) |
6.2 |
(4.5–8.7) |
7.0 |
(5.6–8.8) |
|
Miami-Dade County, FL |
13.4 |
(10.8–16.5) |
8.8 |
(7.2–10.8) |
11.0 |
(9.8–12.4) |
6.9 |
(5.5–8.7) |
7.0 |
(5.4–9.0) |
7.0 |
(5.8–8.4) |
|
Milwaukee, WI |
12.7 |
(10.9–14.6) |
8.4 |
(6.4–11.0) |
10.5 |
(9.2–12.1) |
11.7 |
(9.5–14.5) |
8.2 |
(6.2–10.8) |
10.2 |
(8.4–12.5) |
|
New York City, NY |
12.8 |
(11.1–14.7) |
8.9 |
(7.9–9.9) |
11.0 |
(10.1–11.9) |
8.2 |
(7.0–9.6) |
8.5 |
(7.2–10.0) |
8.4 |
(7.5–9.4) |
|
Orange County, FL |
16.7 |
(13.9–20.1) |
7.6 |
(5.8–10.0) |
12.2 |
(10.5–14.2) |
7.6 |
(5.8–9.9) |
6.5 |
(4.5–9.2) |
7.0 |
(5.5–8.8) |
|
Palm Beach County, FL |
18.7 |
(16.1–21.5) |
9.2 |
(7.4–11.3) |
13.9 |
(12.4–15.6) |
7.4 |
(5.8–9.3) |
8.5 |
(6.8–10.6) |
8.2 |
(6.8–9.7) |
|
Philadelphia, PA |
11.5 |
(9.5–13.9) |
7.4 |
(5.5–10.0) |
9.5 |
(8.0–11.3) |
9.9 |
(8.1–12.1) |
8.1 |
(6.2–10.5) |
9.3 |
(7.9–11.1) |
|
San Bernardino, CA |
12.4 |
(9.8–15.4) |
8.3 |
(6.3–10.8) |
10.4 |
(8.7–12.4) |
10.1 |
(8.1–12.5) |
10.1 |
(7.5–13.6) |
10.1 |
(8.3–12.4) |
|
San Diego, CA |
16.2 |
(13.1–20.0) |
8.6 |
(6.7–10.9) |
12.4 |
(10.4–14.6) |
6.8 |
(4.8–9.4) |
5.4 |
(3.9–7.4) |
6.1 |
(4.8–7.7) |
|
San Francisco, CA |
11.5 |
(9.4–13.9) |
11.0 |
(8.8–13.6) |
11.4 |
(9.8–13.3) |
5.1 |
(3.6–7.1) |
5.8 |
(4.4–7.7) |
6.1 |
(4.9–7.5) |
|
Seattle, WA |
10.8 |
(8.8–13.2) |
9.2 |
(7.7–11.1) |
10.1 |
(8.7–11.6) |
5.2 |
(3.5–7.6) |
4.2 |
(3.0–5.7) |
5.1 |
(4.0–6.6) |
|
Median |
13.0 |
8.7 |
11.0 |
7.8 |
8.2 |
8.2 |
||||||
|
Range |
9.0–20.1 |
5.4–11.6 |
8.2–16.1 |
5.1–25.3 |
4.2–14.9 |
5.1–20.9 |
||||||
|
* During the 12 months before the survey. † Including being bullied through e-mail, chat rooms, instant messaging, Web sites, or texting. § On at least 1 day during the 30 days before the survey. ¶ 95% confidence interval. ** Not available. |
||||||||||||
|
TABLE 20. (Continued) Percentage of high school students who experienced dating violence* and who were ever physically forced to have sexual intercourse,† by sex — selected U.S. sites, Youth Risk Behavior Survey, 2011 |
||||||||||||
|---|---|---|---|---|---|---|---|---|---|---|---|---|
|
Site |
Dating violence |
Forced to have sexual intercourse |
||||||||||
|
Female |
Male |
Total |
Female |
Male |
Total |
|||||||
|
% |
CI§ |
% |
CI |
% |
CI |
% |
CI |
% |
CI |
% |
CI |
|
|
Large urban school district surveys |
||||||||||||
|
Boston, MA |
12.6 |
(8.6–18.1) |
14.7 |
(10.7–20.0) |
13.7 |
(10.4–17.8) |
15.8 |
(12.1–20.4) |
9.2 |
(6.4–13.1) |
12.6 |
(10.0–15.7) |
|
Broward County, FL |
7.3 |
(5.7–9.4) |
12.2 |
(9.7–15.4) |
9.9 |
(8.3–11.8) |
7.4 |
(5.7–9.7) |
5.5 |
(4.1–7.3) |
6.5 |
(5.4–7.9) |
|
Charlotte-Mecklenburg, NC |
12.7 |
(10.5–15.4) |
14.1 |
(10.8–18.1) |
13.6 |
(11.4–16.2) |
13.2 |
(10.4–16.6) |
7.0 |
(5.0–9.7) |
10.3 |
(8.5–12.4) |
|
Chicago, IL |
15.3 |
(12.8–18.2) |
16.8 |
(14.4–19.6) |
16.3 |
(14.4–18.4) |
10.9 |
(8.5–13.7) |
7.5 |
(5.6–9.9) |
9.3 |
(7.7–11.2) |
|
Dallas, TX |
13.9 |
(10.3–18.5) |
12.9 |
(10.1–16.4) |
13.4 |
(10.8–16.3) |
11.2 |
(8.8–14.1) |
6.4 |
(4.4–9.2) |
8.8 |
(7.2–10.6) |
|
Detroit, MI |
29.0 |
(25.3–33.0) |
18.6 |
(15.7–21.8) |
24.2 |
(21.9–26.7) |
11.3 |
(9.3–13.6) |
7.4 |
(5.5–9.9) |
9.7 |
(8.3–11.4) |
|
District of Columbia |
13.6 |
(10.8–17.0) |
15.5 |
(12.7–18.7) |
14.7 |
(12.7–17.0) |
12.7 |
(10.3–15.7) |
6.3 |
(4.5–8.6) |
9.7 |
(8.0–11.7) |
|
Duval County, FL |
15.1 |
(13.2–17.2) |
15.9 |
(13.8–18.1) |
15.5 |
(14.1–17.1) |
14.0 |
(12.2–16.2) |
9.6 |
(7.9–11.5) |
11.9 |
(10.6–13.4) |
|
Houston, TX |
12.6 |
(10.5–15.1) |
16.1 |
(13.7–18.8) |
14.3 |
(12.6–16.3) |
9.3 |
(7.6–11.4) |
7.7 |
(6.0–9.8) |
8.5 |
(7.2–10.0) |
|
Los Angeles, CA |
11.0 |
(8.9–13.7) |
10.9 |
(7.7–15.2) |
11.1 |
(9.0–13.8) |
9.5 |
(7.4–12.0) |
5.8 |
(4.0–8.2) |
7.7 |
(6.1–9.8) |
|
Memphis, TN |
10.8 |
(8.6–13.5) |
9.7 |
(7.5–12.5) |
10.4 |
(8.9–12.2) |
8.8 |
(7.0–11.0) |
5.5 |
(3.8–8.0) |
7.2 |
(5.9–8.7) |
|
Miami-Dade County, FL |
10.3 |
(8.2–12.8) |
10.9 |
(9.2–12.9) |
10.7 |
(9.4–12.2) |
7.5 |
(5.9–9.3) |
7.0 |
(5.3–9.2) |
7.3 |
(6.1–8.7) |
|
Milwaukee, WI |
13.3 |
(10.7–16.5) |
13.2 |
(11.1–15.6) |
13.2 |
(11.4–15.2) |
— |
— |
— |
— |
— |
— |
|
New York City, NY |
9.6 |
(8.7–10.7) |
11.0 |
(9.7–12.5) |
10.4 |
(9.6–11.3) |
7.7 |
(6.8–8.7) |
5.2 |
(4.4–6.2) |
6.5 |
(5.8–7.2) |
|
Orange County, FL |
8.1 |
(6.2–10.5) |
9.5 |
(7.1–12.5) |
8.9 |
(7.3–10.8) |
9.0 |
(6.6–12.2) |
5.1 |
(3.5–7.4) |
7.0 |
(5.6–8.7) |
|
Palm Beach County, FL |
9.2 |
(7.5–11.3) |
12.0 |
(9.7–14.7) |
10.7 |
(8.9–12.7) |
10.0 |
(8.1–12.3) |
7.0 |
(5.1–9.5) |
8.5 |
(7.1–10.2) |
|
Philadelphia, PA |
16.4 |
(13.9–19.2) |
13.5 |
(10.5–17.1) |
15.2 |
(13.2–17.4) |
11.6 |
(9.8–13.7) |
9.2 |
(6.8–12.3) |
10.7 |
(8.8–12.9) |
|
San Bernardino, CA |
9.3 |
(7.3–11.9) |
9.3 |
(7.2–11.7) |
9.3 |
(7.8–11.1) |
9.0 |
(6.7–12.1) |
5.3 |
(3.5–7.8) |
7.1 |
(5.7–8.8) |
|
San Diego, CA |
11.2 |
(8.8–14.2) |
11.9 |
(9.7–14.6) |
11.6 |
(9.8–13.6) |
7.9 |
(6.3–9.9) |
5.9 |
(4.3–8.2) |
6.9 |
(5.7–8.3) |
|
San Francisco, CA |
6.4 |
(4.8–8.4) |
8.1 |
(6.4–10.3) |
7.6 |
(6.3–9.0) |
6.9 |
(4.9–9.4) |
7.0 |
(5.0–9.6) |
7.1 |
(5.6–9.1) |
|
Seattle, WA |
10.2 |
(8.0–12.9) |
12.2 |
(10.0–14.8) |
11.4 |
(9.8–13.2) |
6.3 |
(4.8–8.2) |
6.6 |
(5.0–8.6) |
6.7 |
(5.5–8.1) |
|
Median |
11.2 |
12.2 |
11.6 |
9.4 |
6.8 |
8.1 |
||||||
|
Range |
6.4–29.0 |
8.1–18.6 |
7.6–24.2 |
6.3–15.8 |
5.1–9.6 |
6.5–12.6 |
||||||
|
* Hit, slapped, or physically hurt on purpose by their boyfriend or girlfriend during the 12 months before the survey. † When they did not want to. § 95% confidence interval. ¶ Not available. |
||||||||||||
| TABLE 22. (Continued) Percentage of high school students who felt sad or hopeless,*,† by sex — selected U.S. sites, Youth Risk Behavior Survey, 2011 |
||||||
|---|---|---|---|---|---|---|
| Site |
Female |
Male |
Total |
|||
| % |
CI§ |
% |
CI |
% |
CI |
|
Large urban school district surveys |
||||||
Boston, MA |
31.9 |
(26.9–37.2) |
18.1 |
(13.5–23.8) |
24.8 |
(20.8–29.2) |
Broward County, FL |
34.7 |
(31.3–38.2) |
18.7 |
(16.1–21.6) |
26.7 |
(24.5–29.0) |
Charlotte-Mecklenburg, NC |
36.6 |
(32.2–41.3) |
22.6 |
(19.7–25.8) |
29.9 |
(26.8–33.1) |
Chicago, IL |
38.7 |
(34.5–43.2) |
21.1 |
(18.3–24.3) |
30.3 |
(27.2–33.6) |
Dallas, TX |
41.3 |
(36.3–46.6) |
23.7 |
(20.4–27.4) |
32.8 |
(29.7–36.0) |
Detroit, MI |
33.8 |
(30.3–37.5) |
22.1 |
(18.5–26.2) |
28.2 |
(25.7–31.0) |
District of Columbia |
28.1 |
(24.5–31.9) |
21.0 |
(17.4–25.1) |
24.9 |
(22.2–27.7) |
Duval County, FL |
34.1 |
(31.5–36.9) |
20.9 |
(18.8–23.2) |
27.6 |
(25.7–29.5) |
Houston, TX |
35.4 |
(31.3–39.7) |
25.7 |
(22.9–28.7) |
30.5 |
(27.9–33.3) |
Los Angeles, CA |
36.5 |
(31.8–41.5) |
19.2 |
(16.4–22.4) |
27.6 |
(24.7–30.8) |
Memphis, TN |
32.3 |
(29.0–35.7) |
15.6 |
(12.9–18.8) |
24.0 |
(21.5–26.5) |
Miami-Dade County, FL |
32.6 |
(29.7–35.7) |
18.1 |
(15.5–21.0) |
25.4 |
(23.6–27.4) |
Milwaukee, WI |
34.4 |
(30.2–38.9) |
21.2 |
(18.2–24.7) |
27.7 |
(24.8–30.9) |
New York City, NY |
33.0 |
(31.0–35.0) |
20.8 |
(19.5–22.2) |
26.9 |
(25.6–28.2) |
Orange County, FL |
39.1 |
(34.6–43.7) |
19.5 |
(16.6–22.7) |
29.3 |
(26.3–32.5) |
Palm Beach County, FL |
32.6 |
(29.6–35.8) |
18.0 |
(15.7–20.6) |
25.3 |
(23.2–27.4) |
Philadelphia, PA |
39.0 |
(35.5–42.6) |
23.7 |
(20.3–27.4) |
31.5 |
(29.3–33.9) |
San Bernardino, CA |
39.3 |
(35.4–43.4) |
23.1 |
(20.2–26.2) |
31.2 |
(28.3–34.2) |
San Diego, CA |
33.0 |
(29.2–37.0) |
18.5 |
(15.8–21.5) |
25.6 |
(23.0–28.3) |
San Francisco, CA |
31.4 |
(28.0–35.0) |
20.0 |
(17.1–23.2) |
25.9 |
(23.6–28.3) |
Seattle, WA |
25.2 |
(22.0–28.7) |
18.1 |
(15.5–21.1) |
21.7 |
(19.3–24.3) |
Median |
34.1 |
20.8 |
27.6 |
|||
Range |
25.2–41.3 |
15.6–25.7 |
21.7–32.8 |
|||
* Almost every day for 2 or more weeks in a row so that they stopped doing some usual activities. † During the 12 months before the survey. § 95% confidence interval. ¶ Not available. |
||||||
| TABLE 24. (Continued) Percentage of high school students who seriously considered attempting suicide* and who made a plan about how they would attempt suicide,* by sex — selected U.S. sites, Youth Risk Behavior Survey, 2011 |
||||||||||||
|---|---|---|---|---|---|---|---|---|---|---|---|---|
| Site |
Seriously considered attempting suicide |
Made a suicide plan |
||||||||||
| Female |
Male |
Total |
Female |
Male |
Total |
|||||||
| % |
CI† |
% |
CI |
% |
CI |
% |
CI |
% |
CI |
% |
CI |
|
Large urban school district surveys |
||||||||||||
Boston, MA |
17.5 |
(13.1–23.0) |
9.0 |
(6.4–12.4) |
13.2 |
(10.6–16.3) |
10.3 |
(7.6–13.8) |
8.4 |
(5.3–12.9) |
9.3 |
(7.4–11.7) |
Broward County, FL |
14.4 |
(11.3–18.2) |
10.2 |
(8.4–12.4) |
12.3 |
(10.3–14.6) |
12.3 |
(9.7–15.5) |
7.9 |
(6.1–10.1) |
10.1 |
(8.4–12.0) |
Charlotte-Mecklenburg, NC |
16.7 |
(13.3–20.7) |
12.0 |
(9.8–14.5) |
14.5 |
(12.4–17.0) |
13.8 |
(11.1–17.0) |
11.2 |
(8.7–14.4) |
12.9 |
(10.8–15.3) |
Chicago, IL |
19.8 |
(17.4–22.4) |
10.8 |
(9.1–12.7) |
15.5 |
(14.2–17.0) |
16.1 |
(13.6–18.9) |
11.5 |
(9.4–14.0) |
13.9 |
(12.4–15.6) |
Dallas, TX |
17.0 |
(13.0–22.0) |
8.9 |
(6.4–12.2) |
13.1 |
(10.9–15.6) |
13.6 |
(10.8–16.9) |
7.8 |
(5.5–11.1) |
10.7 |
(8.6–13.3) |
Detroit, MI |
19.6 |
(16.7–22.9) |
10.8 |
(8.6–13.5) |
15.7 |
(13.6–18.0) |
15.6 |
(13.1–18.6) |
10.6 |
(8.2–13.6) |
13.2 |
(11.3–15.4) |
District of Columbia |
12.4 |
(10.1–15.0) |
9.3 |
(7.1–12.1) |
11.1 |
(9.6–12.9) |
11.2 |
(9.0–13.8) |
10.7 |
(7.8–14.4) |
11.2 |
(9.1–13.7) |
Duval County, FL |
18.1 |
(15.9–20.5) |
11.6 |
(9.9–13.5) |
14.9 |
(13.5–16.4) |
16.6 |
(14.6–18.8) |
12.8 |
(11.1–14.7) |
14.7 |
(13.4–16.1) |
Houston, TX |
15.9 |
(13.2–19.0) |
12.5 |
(10.6–14.6) |
14.2 |
(12.6–15.8) |
15.6 |
(13.0–18.5) |
12.7 |
(10.8–14.9) |
14.1 |
(12.6–15.8) |
Los Angeles, CA |
19.3 |
(17.1–21.6) |
9.5 |
(6.0–14.7) |
14.3 |
(12.2–16.8) |
16.9 |
(14.3–19.8) |
10.4 |
(8.2–13.0) |
13.6 |
(11.8–15.7) |
Memphis, TN |
17.9 |
(14.9–21.3) |
7.9 |
(5.9–10.6) |
12.9 |
(11.1–15.1) |
12.1 |
(9.9–14.7) |
5.0 |
(3.6–7.0) |
8.6 |
(7.1–10.3) |
Miami-Dade County, FL |
13.4 |
(11.1–16.1) |
7.7 |
(6.0–9.8) |
10.7 |
(9.2–12.3) |
11.0 |
(9.2–13.1) |
6.9 |
(5.6–8.6) |
9.1 |
(7.9–10.5) |
Milwaukee, WI |
16.3 |
(14.0–18.9) |
9.0 |
(7.2–11.1) |
12.6 |
(11.1–14.4) |
13.4 |
(11.6–15.5) |
10.2 |
(8.1–12.8) |
11.8 |
(10.4–13.3) |
New York City, NY |
14.9 |
(13.6–16.2) |
8.1 |
(7.3–8.9) |
11.6 |
(10.9–12.2) |
— |
— |
— |
— |
— |
— |
Orange County, FL |
20.0 |
(17.0–23.4) |
9.0 |
(6.7–12.0) |
14.5 |
(12.5–16.7) |
13.7 |
(10.8–17.2) |
7.6 |
(5.4–10.7) |
10.6 |
(8.7–12.9) |
Palm Beach County, FL |
15.4 |
(13.3–17.7) |
10.4 |
(8.5–12.7) |
12.9 |
(11.4–14.6) |
12.0 |
(10.0–14.4) |
9.3 |
(7.5–11.3) |
10.6 |
(9.3–12.1) |
Philadelphia, PA |
17.0 |
(14.8–19.5) |
11.0 |
(8.7–13.8) |
14.1 |
(12.4–15.9) |
12.4 |
(10.6–14.5) |
9.3 |
(7.1–12.0) |
10.9 |
(9.3–12.8) |
San Bernardino, CA |
19.0 |
(16.3–22.0) |
10.7 |
(8.4–13.4) |
14.9 |
(12.9–17.1) |
13.8 |
(11.6–16.4) |
8.9 |
(7.0–11.4) |
11.4 |
(9.8–13.1) |
San Diego, CA |
16.3 |
(12.9–20.4) |
10.4 |
(8.2–13.0) |
13.3 |
(11.1–15.8) |
15.1 |
(11.9–18.9) |
7.9 |
(6.0–10.5) |
11.5 |
(9.5–13.8) |
San Francisco, CA |
14.5 |
(12.2–17.2) |
10.5 |
(8.6–12.8) |
12.9 |
(11.3–14.7) |
16.9 |
(14.4–19.7) |
12.0 |
(9.9–14.5) |
14.9 |
(13.1–16.9) |
Seattle, WA |
12.1 |
(10.0–14.6) |
10.4 |
(8.4–12.8) |
11.4 |
(9.8–13.2) |
12.4 |
(10.3–14.8) |
11.6 |
(9.6–13.9) |
12.1 |
(10.8–13.6) |
Median |
16.7 |
10.4 |
13.2 |
13.6 |
9.7 |
11.4 |
||||||
Range |
12.1–20.0 |
7.7–12.5 |
10.7–15.7 |
10.3–16.9 |
5.0–12.8 |
8.6–14.9 |
||||||
* During the 12 months before the survey. † 95% confidence interval. § Not available. |
||||||||||||
| TABLE 26. (Continued) Percentage of high school students who attempted suicide* and whose suicide attempt resulted in an injury, poisoning, or overdose that had to be treated by a doctor or nurse,† by sex — selected U.S. sites, Youth Risk Behavior Survey, 2011 |
||||||||||||
|---|---|---|---|---|---|---|---|---|---|---|---|---|
| Site |
Attempted suicide |
Suicide attempt treated by a doctor or nurse |
||||||||||
| Female |
Male |
Total |
Female |
Male |
Total |
|||||||
| % |
CI§ |
% |
CI |
% |
CI |
% |
CI |
% |
CI |
% |
CI |
|
Large urban school district surveys |
||||||||||||
Boston, MA |
9.7 |
(7.0–13.4) |
7.6 |
(5.3–10.8) |
8.6 |
(6.8–10.8) |
2.9 |
(1.5–5.4) |
4.3 |
(2.6–6.9) |
3.6 |
(2.4–5.2) |
Broward County, FL |
7.5 |
(5.6–10.0) |
4.4 |
(3.0–6.4) |
6.0 |
(4.8–7.4) |
2.1 |
(1.2–3.6) |
2.3 |
(1.3–4.1) |
2.2 |
(1.5–3.2) |
Charlotte-Mecklenburg, NC |
12.8 |
(10.3–15.9) |
16.7 |
(13.1–20.9) |
15.3 |
(12.7–18.4) |
— |
— |
— |
— |
— |
— |
Chicago, IL |
16.0 |
(12.4–20.4) |
15.3 |
(12.4–18.7) |
15.8 |
(12.9–19.3) |
5.6 |
(3.9–8.0) |
5.6 |
(3.3–9.1) |
5.6 |
(3.9–7.9) |
Dallas, TX |
11.4 |
(8.4–15.3) |
6.6 |
(4.6–9.5) |
9.1 |
(7.2–11.5) |
4.1 |
(2.4–6.9) |
2.5 |
(1.5–4.3) |
3.3 |
(2.2–4.9) |
Detroit, MI |
14.0 |
(11.5–16.9) |
9.6 |
(7.0–13.1) |
12.3 |
(10.3–14.7) |
5.4 |
(3.7–7.8) |
4.0 |
(2.5–6.4) |
5.0 |
(3.8–6.6) |
District of Columbia |
10.6 |
(8.2–13.6) |
12.5 |
(9.3–16.6) |
11.5 |
(9.5–13.9) |
4.7 |
(3.2–6.8) |
5.0 |
(3.2–7.7) |
4.8 |
(3.5–6.4) |
Duval County, FL |
12.9 |
(11.1–14.9) |
12.1 |
(9.9–14.6) |
12.7 |
(11.3–14.3) |
4.5 |
(3.4–6.0) |
5.2 |
(3.9–6.8) |
4.9 |
(4.0–6.0) |
Houston, TX |
10.6 |
(8.6–13.2) |
11.4 |
(9.2–14.0) |
11.1 |
(9.6–12.8) |
3.0 |
(1.9–4.6) |
3.9 |
(2.8–5.5) |
3.6 |
(2.8–4.6) |
Los Angeles, CA |
12.8 |
(10.4–15.7) |
8.5 |
(5.7–12.5) |
10.8 |
(9.2–12.8) |
4.0 |
(2.8–5.7) |
4.2 |
(2.6–6.9) |
4.1 |
(3.0–5.6) |
Memphis, TN |
10.6 |
(8.3–13.6) |
4.1 |
(2.7–6.4) |
7.6 |
(6.1–9.4) |
2.6 |
(1.5–4.2) |
0.3 |
(0.1–1.3) |
1.6 |
(0.9–2.6) |
Miami-Dade County, FL |
7.9 |
(6.0–10.2) |
5.6 |
(4.0–7.8) |
6.8 |
(5.5–8.4) |
2.7 |
(1.7–4.1) |
2.9 |
(1.8–4.8) |
2.9 |
(2.0–4.1) |
Milwaukee, WI |
14.2 |
(11.7–17.2) |
11.6 |
(8.8–15.2) |
13.1 |
(10.8–15.8) |
4.4 |
(3.3–5.9) |
3.7 |
(2.3–5.8) |
4.0 |
(3.0–5.3) |
New York City, NY |
9.4 |
(8.1–10.8) |
7.0 |
(6.0–8.0) |
8.4 |
(7.5–9.3) |
2.8 |
(2.3–3.5) |
1.9 |
(1.5–2.5) |
2.5 |
(2.1–2.9) |
Orange County, FL |
11.2 |
(8.4–14.7) |
4.9 |
(3.3–7.2) |
8.1 |
(6.5–10.1) |
3.1 |
(1.9–5.0) |
1.2 |
(0.5–2.9) |
2.2 |
(1.5–3.3) |
Palm Beach County, FL |
8.8 |
(6.9–11.1) |
7.9 |
(5.7–10.8) |
8.5 |
(7.0–10.4) |
2.9 |
(1.9–4.4) |
3.6 |
(2.3–5.7) |
3.3 |
(2.4–4.6) |
Philadelphia, PA |
13.0 |
(10.7–15.7) |
8.8 |
(6.7–11.5) |
11.2 |
(9.4–13.3) |
3.7 |
(2.3–5.8) |
3.2 |
(1.9–5.2) |
3.6 |
(2.6–5.2) |
San Bernardino, CA |
11.5 |
(9.3–14.2) |
6.6 |
(4.7–9.3) |
9.2 |
(7.5–11.1) |
3.2 |
(2.0–5.1) |
1.7 |
(0.9–3.2) |
2.5 |
(1.7–3.5) |
San Diego, CA |
11.2 |
(8.5–14.5) |
6.9 |
(4.8–9.7) |
9.1 |
(7.5–11.1) |
3.2 |
(1.9–5.4) |
2.7 |
(1.7–4.2) |
3.0 |
(2.1–4.2) |
San Francisco, CA |
8.1 |
(6.3–10.4) |
9.7 |
(7.4–12.6) |
9.4 |
(7.7–11.4) |
3.0 |
(1.8–4.8) |
4.4 |
(3.1–6.4) |
3.8 |
(2.8–5.3) |
Seattle, WA |
6.5 |
(4.9–8.6) |
8.0 |
(6.0–10.6) |
7.3 |
(5.9–8.9) |
2.4 |
(1.5–3.9) |
3.0 |
(1.9–4.6) |
2.7 |
(2.0–3.7) |
Median |
11.2 |
8.0 |
9.2 |
3.1 |
3.4 |
3.4 |
||||||
Range |
6.5–16.0 |
4.1–16.7 |
6.0–15.8 |
2.1–5.6 |
0.3–5.6 |
1.6–5.6 |
||||||
* One or more times during the 12 months before the survey. † During the 12 months before the survey. § 95% confidence interval. ¶ Not available. |
||||||||||||
| TABLE 28. (Continued) Percentage of high school students who ever smoked cigarettes, by sex — selected U.S. sites, Youth Risk Behavior Survey, 2011 |
||||||||||||
|---|---|---|---|---|---|---|---|---|---|---|---|---|
| Site |
Ever smoked cigarettes* |
Ever smoked cigarettes daily† |
||||||||||
| Female |
Male |
Total |
Female |
Male |
Total |
|||||||
| % |
CI§ |
% |
CI |
% |
CI |
% |
CI |
% |
CI |
% |
CI |
|
Large urban school district surveys |
||||||||||||
Boston, MA |
38.0 |
(33.5–42.7) |
44.2 |
(39.8–48.7) |
41.0 |
(37.7–44.4) |
6.9 |
(4.2–11.1) |
9.2 |
(6.3–13.2) |
8.0 |
(6.3–10.1) |
Broward County, FL |
32.3 |
(26.8–38.4) |
38.5 |
(33.6–43.6) |
35.5 |
(31.3–39.9) |
4.3 |
(2.6–7.2) |
6.6 |
(4.7–9.2) |
5.5 |
(4.0–7.5) |
Charlotte-Mecklenburg, NC |
— |
— |
— |
— |
— |
— |
— |
— |
— |
— |
— |
— |
Chicago, IL |
51.2 |
(46.6–55.7) |
51.4 |
(47.1–55.6) |
51.1 |
(47.7–54.6) |
5.8 |
(4.3–7.9) |
9.4 |
(7.2–12.3) |
7.5 |
(6.0–9.5) |
Dallas, TX |
43.4 |
(39.1–47.8) |
57.6 |
(53.0–62.1) |
50.4 |
(46.5–54.3) |
4.7 |
(3.2–6.9) |
5.8 |
(3.8–8.7) |
5.2 |
(3.9–6.9) |
Detroit, MI |
47.5 |
(43.7–51.3) |
49.5 |
(43.9–55.2) |
48.6 |
(45.2–51.9) |
2.5 |
(1.6–3.8) |
3.4 |
(2.4–4.9) |
3.0 |
(2.3–3.9) |
District of Columbia |
41.4 |
(37.0–45.9) |
44.0 |
(39.5–48.7) |
43.1 |
(39.7–46.5) |
5.7 |
(4.2–7.8) |
10.4 |
(8.0–13.5) |
8.1 |
(6.5–10.0) |
Duval County, FL |
— |
— |
— |
— |
— |
— |
6.2 |
(4.8–7.9) |
8.8 |
(7.0–11.0) |
7.5 |
(6.4–8.9) |
Houston, TX |
41.7 |
(37.6–46.0) |
50.2 |
(46.6–53.8) |
46.0 |
(43.1–48.8) |
3.8 |
(2.7–5.4) |
7.3 |
(5.6–9.5) |
5.6 |
(4.5–7.0) |
Los Angeles, CA |
38.3 |
(33.7–43.1) |
39.9 |
(33.9–46.1) |
39.2 |
(34.8–43.7) |
4.7 |
(3.3–6.7) |
5.5 |
(3.1–9.5) |
5.2 |
(3.7–7.4) |
Memphis, TN |
31.4 |
(27.5–35.6) |
33.7 |
(29.9–37.7) |
32.5 |
(29.6–35.5) |
2.0 |
(1.1–3.9) |
4.4 |
(2.9–6.7) |
3.2 |
(2.3–4.5) |
Miami-Dade County, FL |
35.3 |
(32.4–38.3) |
32.5 |
(29.4–35.7) |
34.1 |
(31.8–36.5) |
4.0 |
(2.9–5.6) |
6.5 |
(4.7–8.9) |
5.3 |
(4.1–6.8) |
Milwaukee, WI |
43.2 |
(39.9–46.6) |
48.0 |
(43.8–52.2) |
45.7 |
(42.8–48.7) |
4.0 |
(2.9–5.4) |
7.8 |
(5.6–10.7) |
5.9 |
(4.6–7.6) |
New York City, NY |
28.8 |
(26.3–31.5) |
28.9 |
(26.8–31.1) |
28.9 |
(26.8–31.0) |
— |
— |
— |
— |
— |
— |
Orange County, FL |
32.0 |
(27.8–36.4) |
40.3 |
(35.9–44.9) |
36.2 |
(32.9–39.6) |
4.9 |
(3.3–7.4) |
7.1 |
(4.8–10.3) |
6.0 |
(4.5–8.0) |
Palm Beach County, FL |
36.0 |
(32.0–40.3) |
39.0 |
(34.9–43.3) |
37.5 |
(34.0–41.2) |
6.5 |
(5.0–8.4) |
7.7 |
(5.6–10.5) |
7.1 |
(5.6–8.9) |
Philadelphia, PA |
43.3 |
(39.6–47.1) |
45.6 |
(41.6–49.6) |
44.6 |
(41.8–47.4) |
7.2 |
(5.7–9.0) |
6.3 |
(4.2–9.4) |
7.0 |
(5.5–8.8) |
San Bernardino, CA |
42.4 |
(37.6–47.3) |
48.8 |
(43.8–53.7) |
45.5 |
(41.8–49.4) |
4.5 |
(3.1–6.5) |
6.4 |
(4.5–9.0) |
5.4 |
(4.2–7.0) |
San Diego, CA |
41.7 |
(36.3–47.3) |
45.0 |
(40.2–49.8) |
43.4 |
(39.0–47.9) |
5.3 |
(3.5–7.8) |
8.4 |
(6.8–10.3) |
6.9 |
(5.5–8.7) |
San Francisco, CA |
33.6 |
(30.0–37.4) |
37.1 |
(33.3–41.1) |
35.6 |
(32.8–38.6) |
6.1 |
(4.0–9.2) |
8.9 |
(6.8–11.6) |
7.7 |
(6.4–9.2) |
Seattle, WA |
27.8 |
(24.7–31.1) |
34.2 |
(30.1–38.5) |
31.4 |
(28.5–34.4) |
5.2 |
(3.7–7.2) |
6.6 |
(4.6–9.2) |
6.0 |
(4.5–8.0) |
Median |
38.3 |
44.0 |
41.0 |
4.9 |
7.1 |
6.0 |
||||||
Range |
27.8–51.2 |
28.9–57.6 |
28.9–51.1 |
2.0–7.2 |
3.4–10.4 |
3.0–8.1 |
||||||
* Ever tried cigarette smoking, even one or two puffs. † Ever smoked at least one cigarette every day for 30 days. § 95% confidence interval. ¶ Not available. |
||||||||||||
|
TABLE 30. (Continued) Percentage of high school students who smoked a whole cigarette for the first time before age 13 years and who currently smoked cigarettes,* by sex — selected U.S. sites, Youth Risk Behavior Survey, 2011 |
||||||||||||
|---|---|---|---|---|---|---|---|---|---|---|---|---|
|
Site |
Smoked a whole cigarette before age 13 years |
Current cigarette use |
||||||||||
|
Female |
Male |
Total |
Female |
Male |
Total |
|||||||
|
% |
CI† |
% |
CI |
% |
CI |
% |
CI |
% |
CI |
% |
CI |
|
|
Large urban school district surveys |
||||||||||||
|
Boston, MA |
9.0 |
(6.8–11.8) |
9.7 |
(7.1–13.0) |
9.3 |
(7.6–11.3) |
8.4 |
(6.0–11.8) |
11.6 |
(8.1–16.4) |
10.0 |
(8.1–12.3) |
|
Broward County, FL |
5.5 |
(4.0–7.5) |
8.3 |
(6.5–10.7) |
6.9 |
(5.6–8.4) |
10.0 |
(7.8–12.7) |
12.0 |
(9.6–14.9) |
11.0 |
(9.3–12.9) |
|
Charlotte-Mecklenburg, NC |
8.2 |
(6.0–10.9) |
11.4 |
(8.3–15.6) |
10.0 |
(8.0–12.5) |
11.5 |
(9.0–14.7) |
16.2 |
(12.6–20.6) |
14.2 |
(11.7–17.2) |
|
Chicago, IL |
8.5 |
(6.4–11.2) |
14.1 |
(11.9–16.6) |
11.1 |
(9.5–13.0) |
12.0 |
(9.4–15.1) |
15.5 |
(12.2–19.4) |
13.6 |
(11.2–16.5) |
|
Dallas, TX |
8.0 |
(5.7–11.1) |
17.5 |
(13.8–21.9) |
12.7 |
(10.2–15.6) |
11.3 |
(8.7–14.6) |
18.2 |
(14.1–23.2) |
14.7 |
(12.1–17.8) |
|
Detroit, MI |
7.3 |
(5.8–9.2) |
9.8 |
(7.8–12.1) |
8.6 |
(7.4–10.1) |
3.2 |
(2.1–4.9) |
6.1 |
(4.7–7.9) |
4.8 |
(3.8–5.9) |
|
District of Columbia |
5.4 |
(3.8–7.5) |
11.4 |
(8.5–15.1) |
8.3 |
(6.5–10.6) |
9.3 |
(7.0–12.2) |
15.3 |
(12.1–19.2) |
12.5 |
(10.2–15.1) |
|
Duval County, FL |
8.2 |
(6.7–10.1) |
14.0 |
(12.2–16.0) |
11.3 |
(10.0–12.8) |
10.1 |
(8.5–11.9) |
14.5 |
(12.1–17.2) |
12.4 |
(10.9–14.2) |
|
Houston, TX |
6.6 |
(4.9–8.9) |
14.6 |
(12.1–17.4) |
10.7 |
(9.1–12.6) |
9.2 |
(7.2–11.8) |
15.1 |
(12.5–18.3) |
12.3 |
(10.4–14.4) |
|
Los Angeles, CA |
5.7 |
(4.2–7.6) |
12.2 |
(8.6–17.0) |
9.2 |
(7.0–12.0) |
6.8 |
(5.2–8.8) |
11.0 |
(7.9–15.2) |
9.1 |
(7.1–11.7) |
|
Memphis, TN |
6.3 |
(4.3–9.0) |
7.0 |
(5.1–9.7) |
6.6 |
(5.1–8.5) |
4.6 |
(3.1–6.8) |
9.7 |
(7.7–12.3) |
7.2 |
(5.9–8.7) |
|
Miami-Dade County, FL |
6.0 |
(4.6–7.9) |
6.8 |
(5.1–9.0) |
6.4 |
(5.1–8.0) |
10.6 |
(8.3–13.5) |
10.9 |
(8.3–14.0) |
10.8 |
(8.9–13.0) |
|
Milwaukee, WI |
10.7 |
(8.5–13.3) |
13.5 |
(10.2–17.7) |
12.2 |
(10.3–14.5) |
8.2 |
(6.4–10.3) |
12.4 |
(9.9–15.5) |
10.4 |
(8.5–12.6) |
|
New York City, NY |
— |
— |
— |
— |
— |
— |
7.9 |
(6.7–9.3) |
9.0 |
(7.8–10.4) |
8.5 |
(7.5–9.6) |
|
Orange County, FL |
6.3 |
(4.3–9.1) |
8.8 |
(6.6–11.6) |
7.5 |
(5.8–9.5) |
10.1 |
(7.6–13.2) |
14.4 |
(11.3–18.2) |
12.3 |
(10.2–14.7) |
|
Palm Beach County, FL |
6.6 |
(5.2–8.5) |
11.4 |
(9.2–14.0) |
9.0 |
(7.5–10.7) |
12.8 |
(10.6–15.3) |
12.7 |
(10.3–15.7) |
12.8 |
(10.9–15.0) |
|
Philadelphia, PA |
8.3 |
(6.5–10.5) |
11.2 |
(8.8–14.2) |
9.9 |
(8.3–11.9) |
7.7 |
(6.0–9.9) |
10.8 |
(8.2–14.0) |
9.6 |
(7.9–11.7) |
|
San Bernardino, CA |
7.2 |
(5.2–9.7) |
12.7 |
(9.7–16.5) |
10.0 |
(8.1–12.2) |
11.3 |
(8.8–14.4) |
16.2 |
(13.1–19.8) |
13.6 |
(11.3–16.3) |
|
San Diego, CA |
6.5 |
(4.5–9.4) |
10.8 |
(8.5–13.7) |
8.8 |
(7.1–10.9) |
12.4 |
(8.6–17.6) |
15.9 |
(13.4–18.7) |
14.2 |
(11.5–17.6) |
|
San Francisco, CA |
6.7 |
(5.1–8.7) |
10.1 |
(7.5–13.5) |
8.8 |
(7.3–10.7) |
8.4 |
(6.4–11.0) |
12.2 |
(10.0–14.9) |
10.7 |
(9.1–12.5) |
|
Seattle, WA |
4.8 |
(3.5–6.6) |
8.6 |
(6.5–11.4) |
6.9 |
(5.5–8.5) |
7.6 |
(5.5–10.3) |
9.1 |
(7.2–11.5) |
8.5 |
(6.8–10.6) |
|
Median |
6.6 |
11.3 |
9.1 |
9.3 |
12.4 |
11.0 |
||||||
|
Range |
4.8–10.7 |
6.8–17.5 |
6.4–12.7 |
3.2–12.8 |
6.1–18.2 |
4.8–14.7 |
||||||
|
* Smoked cigarettes on at least 1 day during the 30 days before the survey. † 95% confidence interval. § Not available. |
||||||||||||
|
TABLE 32. (Continued) Percentage of high school students who currently smoked cigarettes, by sex — selected U.S. sites, Youth Risk Behavior Survey, 2011 |
||||||||||||
|---|---|---|---|---|---|---|---|---|---|---|---|---|
|
Site |
Current frequent cigarette use* |
Smoked more than 10 cigarettes/day† |
||||||||||
|
Female |
Male |
Total |
Female |
Male |
Total |
|||||||
|
% |
CI§ |
% |
CI |
% |
CI |
% |
CI |
% |
CI |
% |
CI |
|
|
Large urban school district surveys |
||||||||||||
|
Boston, MA |
3.1 |
(1.6–6.2) |
4.3 |
(2.6–7.0) |
3.7 |
(2.7–5.1) |
— |
— |
— |
— |
— |
— |
|
Broward County, FL |
2.0 |
(1.1–3.5) |
4.1 |
(3.0–5.7) |
3.1 |
(2.3–4.2) |
— |
— |
— |
— |
10.4 |
(4.8–21.0) |
|
Charlotte-Mecklenburg, NC |
4.5 |
(3.1–6.6) |
5.9 |
(4.0–8.8) |
5.3 |
(3.9–7.0) |
— |
— |
10.3 |
(4.1–23.5) |
8.2 |
(3.5–18.1) |
|
Chicago, IL |
2.0 |
(1.1–3.6) |
4.6 |
(3.1–7.0) |
3.2 |
(2.2–4.6) |
— |
— |
4.3 |
(2.3–7.9) |
3.1 |
(1.8–5.3) |
|
Dallas, TX |
1.0 |
(0.3–3.1) |
2.8 |
(1.7–4.8) |
2.0 |
(1.2–3.4) |
— |
— |
— |
— |
1.9 |
(0.7–4.7) |
|
Detroit, MI |
0.4 |
(0.1–1.0) |
1.5 |
(0.8–2.6) |
0.9 |
(0.5–1.4) |
— |
— |
— |
— |
— |
— |
|
District of Columbia |
1.9 |
(1.0–3.7) |
6.9 |
(5.0–9.2) |
4.2 |
(3.2–5.5) |
— |
— |
— |
— |
7.3 |
(3.5–14.6) |
|
Duval County, FL |
3.6 |
(2.7–4.8) |
5.8 |
(4.5–7.4) |
4.7 |
(3.8–5.8) |
— |
— |
— |
— |
— |
— |
|
Houston, TX |
1.0 |
(0.5–1.9) |
3.4 |
(2.3–5.1) |
2.2 |
(1.5–3.0) |
— |
— |
4.5 |
(2.0–10.0) |
3.8 |
(1.8–7.7) |
|
Los Angeles, CA |
0.9 |
(0.5–1.6) |
3.1 |
(1.3–7.5) |
2.2 |
(1.1–4.3) |
— |
— |
— |
— |
11.2 |
(5.4–21.6) |
|
Memphis, TN |
1.0 |
(0.4–2.1) |
3.6 |
(2.3–5.6) |
2.3 |
(1.5–3.4) |
— |
— |
— |
— |
9.2 |
(4.6–17.5) |
|
Miami-Dade County, FL |
1.7 |
(1.0–2.9) |
4.3 |
(2.8–6.5) |
3.0 |
(2.0–4.3) |
9.0 |
(3.9–19.5) |
10.8 |
(5.5–20.1) |
9.8 |
(6.0–15.6) |
|
Milwaukee, WI |
2.5 |
(1.6–4.0) |
3.8 |
(2.4–6.0) |
3.2 |
(2.2–4.5) |
— |
— |
— |
— |
8.3 |
(4.4–15.0) |
|
New York City, NY |
1.7 |
(1.2–2.6) |
3.3 |
(2.7–4.1) |
2.5 |
(2.0–3.2) |
3.6 |
(2.1–6.1) |
12.1 |
(8.2–17.5) |
8.4 |
(6.1–11.4) |
|
Orange County, FL |
2.2 |
(1.1–4.3) |
4.4 |
(2.8–6.7) |
3.3 |
(2.3–4.8) |
— |
— |
— |
— |
10.2 |
(5.9–16.9) |
|
Palm Beach County, FL |
3.8 |
(2.7–5.4) |
4.4 |
(3.0–6.4) |
4.2 |
(3.2–5.4) |
7.7 |
(3.9–14.6) |
17.2 |
(9.5–29.0) |
12.9 |
(8.0–20.0) |
|
Philadelphia, PA |
2.8 |
(1.8–4.4) |
3.5 |
(2.1–5.8) |
3.3 |
(2.3–4.7) |
— |
— |
— |
— |
7.9 |
(4.0–14.7) |
|
San Bernardino, CA |
1.7 |
(1.0–3.0) |
4.3 |
(2.8–6.6) |
3.0 |
(2.0–4.4) |
— |
— |
6.7 |
(3.0–14.2) |
5.2 |
(2.7–9.5) |
|
San Diego, CA |
2.9 |
(1.6–5.2) |
4.4 |
(2.9–6.7) |
3.7 |
(2.6–5.1) |
— |
— |
4.0 |
(1.4–11.1) |
2.8 |
(1.1–7.2) |
|
San Francisco, CA |
2.5 |
(1.5–4.1) |
3.6 |
(2.4–5.5) |
3.3 |
(2.4–4.5) |
— |
— |
16.2 |
(8.7–28.1) |
11.1 |
(6.2–19.2) |
|
Seattle, WA |
2.7 |
(1.6–4.4) |
2.9 |
(1.6–5.2) |
2.9 |
(1.8–4.5) |
— |
— |
— |
— |
8.6 |
(5.0–14.6) |
|
Median |
2.0 |
4.1 |
3.2 |
7.7 |
10.3 |
8.3 |
||||||
|
Range |
0.4–4.5 |
1.5–6.9 |
0.9–5.3 |
3.6–9.0 |
4.0–17.2 |
1.9–12.9 |
||||||
|
* Smoked cigarettes on 20 or more days during the 30 days before the survey. † On the days they smoked during the 30 days before the survey, among students who currently smoked cigarettes. § 95% confidence interval. ¶ Not available. |
||||||||||||
|
TABLE 34. (Continued) Percentage of high school students who smoked cigarettes on school property* and who usually obtained their own cigarettes by buying them in a store or gas station,† by sex — selected U.S. sites, Youth Risk Behavior Survey, 2011 |
||||||||||||
|---|---|---|---|---|---|---|---|---|---|---|---|---|
|
Site |
Smoked cigarettes on school property |
Bought cigarettes in a store or gas station |
||||||||||
|
Female |
Male |
Total |
Female |
Male |
Total |
|||||||
|
% |
CI§ |
% |
CI |
% |
CI |
% |
CI |
% |
CI |
% |
CI |
|
|
Large urban school district surveys |
||||||||||||
|
Boston, MA |
3.9 |
(2.1–7.0) |
6.1 |
(3.8–9.8) |
5.0 |
(3.7–6.7) |
— |
— |
— |
— |
— |
— |
|
Broward County, FL |
2.9 |
(2.0–4.2) |
4.4 |
(3.3–6.0) |
3.7 |
(3.0–4.7) |
— |
— |
— |
— |
— |
— |
|
Charlotte-Mecklenburg, NC |
4.0 |
(2.7–5.8) |
7.6 |
(5.5–10.6) |
6.1 |
(4.6–8.1) |
— |
— |
— |
— |
— |
— |
|
Chicago, IL |
4.4 |
(2.9–6.6) |
7.7 |
(5.7–10.4) |
5.9 |
(4.5–7.9) |
— |
— |
42.2 |
(31.5–53.6) |
30.1 |
(22.9–38.4) |
|
Dallas, TX |
2.6 |
(1.6–4.2) |
5.1 |
(3.0–8.6) |
3.9 |
(2.6–5.9) |
— |
— |
— |
— |
16.4 |
(10.0–25.9) |
|
Detroit, MI |
0.7 |
(0.4–1.5) |
1.9 |
(1.1–3.1) |
1.5 |
(1.0–2.2) |
— |
— |
— |
— |
— |
— |
|
District of Columbia |
3.4 |
(2.1–5.3) |
5.5 |
(3.6–8.3) |
4.4 |
(3.2–6.0) |
— |
— |
— |
— |
21.7 |
(14.4–31.3) |
|
Duval County, FL |
— |
— |
— |
— |
— |
— |
15.7 |
(9.4–24.9) |
19.6 |
(13.8–27.0) |
18.0 |
(13.6–23.5) |
|
Houston, TX |
1.1 |
(0.6–2.1) |
3.7 |
(2.6–5.1) |
2.5 |
(1.9–3.3) |
— |
— |
33.5 |
(24.7–43.6) |
24.5 |
(18.7–31.4) |
|
Los Angeles, CA |
1.7 |
(0.9–2.9) |
3.0 |
(1.6–5.6) |
2.6 |
(1.7–4.0) |
— |
— |
— |
— |
10.3 |
(6.2–16.4) |
|
Memphis, TN |
0.9 |
(0.4–2.0) |
3.5 |
(2.3–5.4) |
2.2 |
(1.5–3.2) |
— |
— |
— |
— |
— |
— |
|
Miami-Dade County, FL |
2.3 |
(1.5–3.6) |
4.5 |
(3.0–6.8) |
3.4 |
(2.5–4.6) |
— |
— |
— |
— |
21.2 |
(14.1–30.5) |
|
Milwaukee, WI |
3.1 |
(2.1–4.5) |
4.8 |
(3.2–7.0) |
4.1 |
(3.0–5.5) |
— |
— |
— |
— |
— |
— |
|
New York City, NY |
— |
— |
— |
— |
— |
— |
— |
— |
— |
— |
— |
— |
|
Orange County, FL |
2.0 |
(1.0–4.0) |
4.1 |
(2.4–6.7) |
3.0 |
(1.9–4.8) |
— |
— |
— |
— |
15.6 |
(9.9–23.8) |
|
Palm Beach County, FL |
2.8 |
(1.8–4.2) |
4.2 |
(2.8–6.3) |
3.5 |
(2.6–4.7) |
13.5 |
(8.0–21.8) |
— |
— |
19.3 |
(14.0–26.1) |
|
Philadelphia, PA |
3.2 |
(2.1–4.6) |
5.3 |
(3.8–7.4) |
4.3 |
(3.3–5.6) |
— |
— |
— |
— |
— |
— |
|
San Bernardino, CA |
3.1 |
(2.1–4.6) |
7.2 |
(5.2–9.9) |
5.1 |
(3.8–6.8) |
— |
— |
— |
— |
12.6 |
(8.0–19.3) |
|
San Diego, CA |
1.6 |
(0.8–3.2) |
4.5 |
(3.2–6.3) |
3.2 |
(2.3–4.5) |
— |
— |
— |
— |
15.4 |
(10.0–23.1) |
|
San Francisco, CA |
1.6 |
(0.8–3.0) |
4.3 |
(3.1–6.0) |
3.2 |
(2.4–4.3) |
— |
— |
— |
— |
24.7 |
(18.5–32.1) |
|
Seattle, WA |
3.7 |
(2.5–5.5) |
4.8 |
(3.1–7.2) |
4.4 |
(3.1–6.1) |
— |
— |
— |
— |
11.9 |
(5.9–22.6) |
|
Median |
2.8 |
4.5 |
3.7 |
14.6 |
33.5 |
18.0 |
||||||
|
Range |
0.7–4.4 |
1.9–7.7 |
1.5–6.1 |
13.5–15.7 |
19.6–42.2 |
10.3–30.1 |
||||||
|
* On at least 1 day during the 30 days before the survey. † During the 30 days before the survey, among students who were aged <18 years and who currently smoked cigarettes. § 95% confidence interval. ¶ Not available. |
||||||||||||
| TABLE 36. (Continued) Percentage of high school students who tried to quit smoking cigarettes,* by sex — selected U.S. sites, Youth Risk Behavior Survey, 2011 |
||||||
|---|---|---|---|---|---|---|
| Site |
Female |
Male |
Total |
|||
| % |
CI† |
% |
CI |
% |
CI |
|
Large urban school district surveys |
||||||
Boston, MA |
— |
— |
— |
— |
— |
— |
Broward County, FL |
— |
— |
— |
— |
49.9 |
(39.0–60.9) |
Charlotte-Mecklenburg, NC |
— |
— |
55.2 |
(45.4–64.5) |
55.5 |
(48.3–62.5) |
Chicago, IL |
— |
— |
55.9 |
(45.7–65.6) |
53.3 |
(46.0–60.4) |
Dallas, TX |
— |
— |
— |
— |
58.8 |
(51.4–65.9) |
Detroit, MI |
— |
— |
— |
— |
— |
— |
District of Columbia |
— |
— |
— |
— |
61.6 |
(50.9–71.2) |
Duval County, FL |
45.4 |
(36.7–54.3) |
45.7 |
(37.7–53.9) |
45.9 |
(40.1–51.9) |
Houston, TX |
— |
— |
51.3 |
(41.4–61.0) |
49.3 |
(41.4–57.3) |
Los Angeles, CA |
— |
— |
— |
— |
50.4 |
(38.9–61.8) |
Memphis, TN |
— |
— |
— |
— |
53.4 |
(43.5–63.1) |
Miami-Dade County, FL |
43.7 |
(33.9–54.0) |
37.9 |
(28.4–48.5) |
40.5 |
(34.8–46.3) |
Milwaukee, WI |
— |
— |
— |
— |
55.1 |
(45.9–64.0) |
New York City, NY |
52.8 |
(45.0–60.4) |
54.9 |
(50.3–59.4) |
53.9 |
(49.3–58.4) |
Orange County, FL |
— |
— |
— |
— |
46.3 |
(38.4–54.5) |
Palm Beach County, FL |
42.6 |
(32.7–53.1) |
42.3 |
(33.3–51.9) |
42.8 |
(35.6–50.2) |
Philadelphia, PA |
— |
— |
— |
— |
56.9 |
(48.4–65.0) |
San Bernardino, CA |
— |
— |
53.2 |
(40.8–65.3) |
57.2 |
(46.6–67.2) |
San Diego, CA |
— |
— |
55.3 |
(45.3–64.9) |
52.1 |
(44.9–59.2) |
San Francisco, CA |
— |
— |
59.1 |
(48.0–69.4) |
53.9 |
(46.2–61.4) |
Seattle, WA |
— |
— |
— |
— |
49.4 |
(38.7–60.2) |
Median |
44.5 |
54.0 |
53.3 |
|||
Range |
42.6–52.8 |
37.9–59.1 |
40.5–61.6 |
|||
* During the 12 months before the survey, among students who currently smoked cigarettes. † 95% confidence interval. § Not available. |
||||||
|
TABLE 38. (Continued) Percentage of high school students who currently used smokeless tobacco* and who used smokeless tobacco on school property,* by sex — selected U.S. sites, Youth Risk Behavior Survey, 2011 |
||||||||||||
|---|---|---|---|---|---|---|---|---|---|---|---|---|
|
Site |
Current smokeless tobacco use |
Used smokeless tobacco on school property |
||||||||||
|
Female |
Male |
Total |
Female |
Male |
Total |
|||||||
|
% |
CI† |
% |
CI |
% |
CI |
% |
CI |
% |
CI |
% |
CI |
|
|
Large urban school district surveys |
||||||||||||
|
Boston, MA |
3.1 |
(1.6–6.2) |
5.0 |
(3.3–7.7) |
4.1 |
(2.8–5.9) |
1.2 |
(0.4–3.7) |
2.1 |
(1.1–4.1) |
1.6 |
(0.9–2.7) |
|
Broward County, FL |
1.4 |
(0.6–3.2) |
7.2 |
(5.0–10.3) |
4.5 |
(3.2–6.4) |
0.5 |
(0.2–1.4) |
5.5 |
(3.5–8.4) |
3.2 |
(2.1–5.0) |
|
Charlotte-Mecklenburg, NC |
2.4 |
(1.4–4.0) |
12.0 |
(8.5–16.5) |
7.5 |
(5.3–10.5) |
— |
— |
— |
— |
— |
— |
|
Chicago, IL |
2.4 |
(1.5–3.8) |
4.1 |
(2.7–6.3) |
3.5 |
(2.6–4.6) |
1.1 |
(0.6–2.1) |
1.9 |
(1.0–3.5) |
1.8 |
(1.2–2.6) |
|
Dallas, TX |
1.5 |
(0.9–2.5) |
4.5 |
(2.8–7.1) |
3.0 |
(2.0–4.3) |
0.3 |
(0.1–1.4) |
1.9 |
(1.0–3.6) |
1.1 |
(0.6–2.0) |
|
Detroit, MI |
1.3 |
(0.7–2.2) |
2.9 |
(2.0–4.3) |
2.2 |
(1.6–3.1) |
0.8 |
(0.4–1.7) |
1.9 |
(1.1–3.2) |
1.5 |
(1.0–2.3) |
|
District of Columbia |
1.8 |
(1.0–3.0) |
6.0 |
(3.8–9.4) |
4.1 |
(2.8–6.0) |
0.5 |
(0.2–1.5) |
3.7 |
(2.1–6.4) |
2.2 |
(1.4–3.7) |
|
Duval County, FL |
3.9 |
(3.0–5.0) |
10.6 |
(9.0–12.5) |
7.5 |
(6.4–8.7) |
— |
— |
— |
— |
— |
— |
|
Houston, TX |
2.1 |
(1.3–3.2) |
5.8 |
(4.5–7.4) |
4.0 |
(3.2–4.9) |
1.3 |
(0.7–2.3) |
2.6 |
(1.7–4.0) |
2.0 |
(1.5–2.8) |
|
Los Angeles, CA |
2.2 |
(1.2–3.9) |
4.6 |
(2.7–7.8) |
3.6 |
(2.5–5.4) |
0.9 |
(0.4–1.8) |
3.5 |
(1.9–6.3) |
2.5 |
(1.6–4.1) |
|
Memphis, TN |
0.6 |
(0.2–1.3) |
2.2 |
(1.3–3.7) |
1.4 |
(0.9–2.3) |
0.2 |
(0.1–1.0) |
1.1 |
(0.5–2.2) |
0.7 |
(0.4–1.4) |
|
Miami-Dade County, FL |
2.3 |
(1.4–3.7) |
5.1 |
(3.6–7.1) |
3.7 |
(2.7–5.0) |
1.7 |
(1.0–2.8) |
2.9 |
(1.8–4.5) |
2.2 |
(1.5–3.2) |
|
Milwaukee, WI |
— |
— |
— |
— |
— |
— |
— |
— |
— |
— |
— |
— |
|
New York City, NY |
2.1 |
(1.6–2.7) |
4.3 |
(3.6–5.1) |
3.3 |
(2.8–4.0) |
— |
— |
— |
— |
— |
— |
|
Orange County, FL |
2.2 |
(1.1–4.0) |
7.4 |
(5.5–10.0) |
4.8 |
(3.7–6.1) |
1.5 |
(0.7–3.0) |
4.9 |
(3.4–7.1) |
3.2 |
(2.3–4.3) |
|
Palm Beach County, FL |
2.6 |
(1.7–3.9) |
8.8 |
(6.9–11.3) |
5.9 |
(4.7–7.3) |
1.8 |
(1.1–3.1) |
4.8 |
(3.3–6.8) |
3.5 |
(2.6–4.7) |
|
Philadelphia, PA |
1.5 |
(0.8–2.5) |
4.1 |
(2.5–6.5) |
2.8 |
(1.9–4.2) |
0.5 |
(0.1–1.5) |
2.0 |
(1.0–4.1) |
1.2 |
(0.6–2.5) |
|
San Bernardino, CA |
2.7 |
(1.7–4.1) |
4.7 |
(3.2–6.9) |
3.7 |
(2.7–5.0) |
1.6 |
(0.9–2.9) |
3.1 |
(1.9–4.9) |
2.3 |
(1.6–3.5) |
|
San Diego, CA |
2.5 |
(1.6–3.9) |
5.1 |
(3.7–7.0) |
3.9 |
(2.9–5.1) |
1.1 |
(0.5–2.5) |
2.9 |
(1.9–4.4) |
2.0 |
(1.3–3.1) |
|
San Francisco, CA |
2.3 |
(1.2–4.2) |
5.4 |
(3.7–7.9) |
4.1 |
(3.0–5.7) |
1.2 |
(0.5–2.7) |
4.5 |
(3.0–6.6) |
3.2 |
(2.2–4.6) |
|
Seattle, WA |
2.5 |
(1.5–4.1) |
4.2 |
(3.1–5.8) |
3.8 |
(2.8–5.0) |
1.3 |
(0.7–2.3) |
2.9 |
(1.9–4.3) |
2.3 |
(1.7–3.3) |
|
Median |
2.2 |
5.0 |
3.8 |
1.1 |
2.9 |
2.2 |
||||||
|
Range |
0.6–3.9 |
2.2–12.0 |
1.4–7.5 |
0.2–1.8 |
1.1–5.5 |
0.7–3.5 |
||||||
|
* Chewing tobacco, snuff, or dip on at least 1 day during the 30 days before the survey. † 95% confidence interval. § Not available. |
||||||||||||
|
TABLE 40. (Continued) Percentage of high school students who currently smoked cigars* and who currently used tobacco,† by sex — selected U.S. sites, Youth Risk Behavior Survey, 2011 |
||||||||||||
|---|---|---|---|---|---|---|---|---|---|---|---|---|
|
Site |
Current cigar use |
Current tobacco use |
||||||||||
|
Female |
Male |
Total |
Female |
Male |
Total |
|||||||
|
% |
CI§ |
% |
CI |
% |
CI |
% |
CI |
% |
CI |
% |
CI |
|
|
Large urban school district surveys |
||||||||||||
|
Boston, MA |
7.4 |
(5.2–10.5) |
14.0 |
(10.7–18.2) |
10.7 |
(8.4–13.5) |
10.6 |
(8.0–13.9) |
16.1 |
(12.2–21.0) |
13.2 |
(11.0–15.9) |
|
Broward County, FL |
5.6 |
(3.8–8.2) |
12.9 |
(9.9–16.8) |
9.8 |
(7.4–12.7) |
11.6 |
(8.5–15.6) |
16.1 |
(12.7–20.1) |
14.2 |
(11.5–17.3) |
|
Charlotte-Mecklenburg, NC |
— |
— |
— |
— |
— |
— |
— |
— |
— |
— |
— |
— |
|
Chicago, IL |
11.7 |
(9.6–14.2) |
13.9 |
(11.5–16.7) |
13.0 |
(11.2–15.0) |
15.4 |
(12.5–18.9) |
17.9 |
(14.8–21.5) |
16.5 |
(14.0–19.4) |
|
Dallas, TX |
12.9 |
(9.8–16.9) |
17.9 |
(13.9–22.6) |
15.3 |
(12.9–18.1) |
15.8 |
(12.7–19.5) |
20.3 |
(15.7–25.7) |
18.0 |
(15.2–21.2) |
|
Detroit, MI |
7.4 |
(5.8–9.3) |
11.4 |
(9.1–14.2) |
9.7 |
(8.3–11.5) |
6.4 |
(4.9–8.5) |
12.1 |
(9.7–14.9) |
9.3 |
(7.9–11.0) |
|
District of Columbia |
9.6 |
(7.4–12.5) |
17.3 |
(13.9–21.2) |
13.7 |
(11.6–16.2) |
13.0 |
(10.2–16.5) |
20.4 |
(16.6–24.9) |
16.8 |
(14.5–19.4) |
|
Duval County, FL |
11.4 |
(9.7–13.2) |
19.6 |
(17.1–22.3) |
15.7 |
(14.1–17.5) |
15.6 |
(13.7–17.7) |
24.4 |
(21.3–27.9) |
20.0 |
(18.0–22.2) |
|
Houston, TX |
11.0 |
(8.8–13.6) |
17.9 |
(15.2–20.8) |
14.6 |
(12.6–16.8) |
12.7 |
(10.1–15.9) |
18.7 |
(15.7–22.0) |
15.7 |
(13.4–18.2) |
|
Los Angeles, CA |
4.5 |
(3.2–6.1) |
11.8 |
(8.3–16.5) |
8.5 |
(6.4–11.3) |
7.6 |
(6.0–9.6) |
13.0 |
(9.4–17.7) |
10.5 |
(8.3–13.2) |
|
Memphis, TN |
8.8 |
(6.5–11.7) |
12.0 |
(9.7–14.9) |
10.4 |
(8.9–12.2) |
11.5 |
(8.8–14.8) |
16.3 |
(13.3–20.0) |
13.9 |
(11.8–16.2) |
|
Miami-Dade County, FL |
6.5 |
(4.8–8.9) |
10.8 |
(8.7–13.3) |
8.7 |
(7.3–10.4) |
11.5 |
(9.1–14.4) |
12.6 |
(10.0–15.7) |
12.0 |
(10.0–14.4) |
|
Milwaukee, WI |
— |
— |
— |
— |
— |
— |
— |
— |
— |
— |
— |
— |
|
New York City, NY |
— |
— |
— |
— |
— |
— |
— |
— |
— |
— |
— |
— |
|
Orange County, FL |
7.4 |
(5.6–9.8) |
16.0 |
(12.2–20.7) |
11.7 |
(9.4–14.4) |
12.7 |
(10.1–15.8) |
20.6 |
(16.6–25.3) |
16.6 |
(14.2–19.4) |
|
Palm Beach County, FL |
8.0 |
(6.3–10.2) |
14.7 |
(12.0–17.7) |
11.5 |
(9.8–13.5) |
15.7 |
(13.1–18.6) |
21.0 |
(17.7–24.8) |
18.3 |
(16.0–20.9) |
|
Philadelphia, PA |
3.3 |
(2.2–4.9) |
8.6 |
(6.0–12.0) |
6.0 |
(4.8–7.6) |
8.7 |
(6.9–11.0) |
12.5 |
(9.5–16.3) |
10.7 |
(8.7–13.0) |
|
San Bernardino, CA |
7.2 |
(5.2–9.7) |
11.1 |
(8.6–14.2) |
9.1 |
(7.4–11.1) |
12.2 |
(9.7–15.2) |
19.1 |
(15.8–23.0) |
15.6 |
(13.1–18.4) |
|
San Diego, CA |
6.3 |
(4.6–8.6) |
14.3 |
(12.1–16.9) |
10.5 |
(8.9–12.4) |
14.0 |
(10.0–19.4) |
19.3 |
(16.4–22.6) |
16.8 |
(13.8–20.4) |
|
San Francisco, CA |
4.7 |
(3.3–6.8) |
9.8 |
(7.7–12.4) |
7.8 |
(6.4–9.5) |
9.2 |
(7.1–11.9) |
13.3 |
(10.9–16.1) |
11.5 |
(9.9–13.5) |
|
Seattle, WA |
5.4 |
(4.0–7.2) |
11.5 |
(9.2–14.3) |
9.0 |
(7.4–10.9) |
8.3 |
(6.2–11.0) |
12.6 |
(10.3–15.3) |
10.7 |
(8.9–12.8) |
|
Median |
7.4 |
13.4 |
10.4 |
11.9 |
17.1 |
14.9 |
||||||
|
Range |
3.3–12.9 |
8.6–19.6 |
6.0–15.7 |
6.4–15.8 |
12.1–24.4 |
9.3–20.0 |
||||||
|
* Smoked cigars, cigarillos, or little cigars on at least 1 day during the 30 days before the survey. † Current cigarette use, current smokeless tobacco use, or current cigar use. § 95% confidence interval. ¶ Not available. |
||||||||||||
|
TABLE 42. (Continued) Percentage of high school students who ever drank alcohol* and who drank alcohol† for the first time before age 13 years, by sex — selected U.S. sites, Youth Risk Behavior Survey, 2011 |
||||||||||||
|---|---|---|---|---|---|---|---|---|---|---|---|---|
|
Site |
Ever drank alcohol |
Drank alcohol for the first time before age 13 years |
||||||||||
|
Female |
Male |
Total |
Female |
Male |
Total |
|||||||
|
% |
CI§ |
% |
CI |
% |
CI |
% |
CI |
% |
CI |
% |
CI |
|
|
Large urban school district surveys |
||||||||||||
|
Boston, MA |
67.6 |
(62.3–72.4) |
68.4 |
(62.3–73.9) |
67.8 |
(63.0–72.2) |
18.3 |
(14.6–22.7) |
22.9 |
(18.4–28.0) |
20.5 |
(17.5–23.9) |
|
Broward County, FL |
70.7 |
(66.3–74.7) |
63.5 |
(58.4–68.3) |
66.9 |
(63.3–70.3) |
21.1 |
(18.3–24.3) |
23.1 |
(20.1–26.4) |
22.0 |
(19.9–24.2) |
|
Charlotte-Mecklenburg, NC |
69.2 |
(64.5–73.5) |
68.8 |
(64.7–72.7) |
69.1 |
(65.6–72.3) |
17.5 |
(14.9–20.4) |
26.3 |
(23.0–29.8) |
22.2 |
(20.2–24.4) |
|
Chicago, IL |
70.2 |
(65.6–74.5) |
67.6 |
(62.7–72.1) |
68.9 |
(64.9–72.7) |
21.6 |
(18.4–25.1) |
31.8 |
(28.7–35.0) |
26.4 |
(24.4–28.5) |
|
Dallas, TX |
71.6 |
(66.0–76.6) |
70.9 |
(66.2–75.2) |
71.3 |
(67.6–74.6) |
19.4 |
(16.2–23.0) |
25.6 |
(21.5–30.3) |
22.6 |
(19.6–25.9) |
|
Detroit, MI |
73.1 |
(69.8–76.1) |
63.4 |
(59.4–67.3) |
68.8 |
(65.8–71.6) |
17.5 |
(14.6–20.8) |
24.3 |
(20.4–28.7) |
21.0 |
(18.4–23.9) |
|
District of Columbia |
64.8 |
(59.9–69.3) |
55.3 |
(50.1–60.3) |
60.3 |
(56.7–63.7) |
20.7 |
(16.7–25.3) |
21.6 |
(18.1–25.6) |
21.3 |
(18.1–24.9) |
|
Duval County, FL |
66.8 |
(63.7–69.7) |
63.6 |
(60.5–66.6) |
65.2 |
(62.9–67.5) |
19.8 |
(17.5–22.3) |
23.7 |
(21.4–26.3) |
21.9 |
(20.1–23.7) |
|
Houston, TX |
66.9 |
(63.2–70.4) |
62.1 |
(58.1–65.9) |
64.5 |
(61.5–67.4) |
18.9 |
(16.5–21.5) |
25.7 |
(22.9–28.8) |
22.4 |
(20.2–24.7) |
|
Los Angeles, CA |
66.3 |
(62.2–70.2) |
63.8 |
(59.8–67.5) |
65.1 |
(62.2–67.9) |
22.8 |
(16.0–31.5) |
27.5 |
(23.8–31.6) |
25.5 |
(20.8–30.8) |
|
Memphis, TN |
59.4 |
(55.2–63.5) |
52.0 |
(47.0–56.9) |
55.8 |
(52.5–59.0) |
16.5 |
(13.8–19.6) |
20.6 |
(17.1–24.6) |
18.5 |
(16.4–20.9) |
|
Miami-Dade County, FL |
67.5 |
(63.8–71.0) |
58.7 |
(54.6–62.6) |
63.1 |
(60.1–66.1) |
20.6 |
(17.0–24.6) |
24.0 |
(20.8–27.5) |
22.2 |
(19.5–25.2) |
|
Milwaukee, WI |
67.9 |
(63.9–71.6) |
61.5 |
(57.1–65.8) |
64.9 |
(61.9–67.8) |
19.9 |
(16.7–23.6) |
23.9 |
(20.9–27.2) |
22.2 |
(20.0–24.5) |
|
New York City, NY |
— |
— |
— |
— |
— |
— |
21.4 |
(19.1–23.9) |
24.0 |
(22.0–26.1) |
22.8 |
(21.0–24.7) |
|
Orange County, FL |
68.2 |
(63.1–72.8) |
64.8 |
(60.2–69.2) |
66.5 |
(62.5–70.2) |
17.9 |
(14.7–21.7) |
21.5 |
(17.9–25.6) |
19.7 |
(17.0–22.8) |
|
Palm Beach County, FL |
70.8 |
(66.8–74.5) |
66.8 |
(62.3–71.0) |
68.8 |
(65.3–72.2) |
19.1 |
(16.3–22.2) |
24.3 |
(21.0–27.9) |
21.7 |
(19.4–24.2) |
|
Philadelphia, PA |
66.8 |
(62.6–70.7) |
61.7 |
(56.4–66.8) |
64.3 |
(60.4–68.1) |
17.5 |
(14.4–21.0) |
24.9 |
(21.4–28.8) |
21.1 |
(18.7–23.8) |
|
San Bernardino, CA |
75.0 |
(70.8–78.8) |
69.5 |
(64.7–73.8) |
72.2 |
(68.9–75.3) |
22.3 |
(18.9–26.2) |
29.5 |
(26.0–33.2) |
25.9 |
(23.1–29.0) |
|
San Diego, CA |
68.0 |
(63.8–72.0) |
62.2 |
(57.9–66.3) |
65.1 |
(61.5–68.6) |
20.6 |
(17.0–24.8) |
22.8 |
(19.6–26.3) |
21.7 |
(18.8–25.0) |
|
San Francisco, CA |
49.5 |
(45.4–53.5) |
48.4 |
(44.5–52.3) |
49.1 |
(46.0–52.2) |
16.2 |
(13.4–19.4) |
19.5 |
(16.4–23.1) |
18.1 |
(16.0–20.5) |
|
Seattle, WA |
— |
— |
— |
— |
— |
— |
13.6 |
(11.0–16.6) |
18.5 |
(15.6–21.8) |
16.2 |
(14.0–18.7) |
|
Median |
67.9 |
63.5 |
65.2 |
19.4 |
24.0 |
21.9 |
||||||
|
Range |
49.5–75.0 |
48.4–70.9 |
49.1–72.2 |
13.6–22.8 |
18.5–31.8 |
16.2–26.4 |
||||||
|
* Had at least one drink of alcohol on at least 1 day during their life. † Other than a few sips. § 95% confidence interval. ¶ Not available. |
||||||||||||
|
TABLE 44. (Continued) Percentage of high school students who drank alcohol, by sex — selected U.S. sites, Youth Risk Behavior Survey, 2011 |
||||||||||||
|---|---|---|---|---|---|---|---|---|---|---|---|---|
|
Site |
Current alcohol use* |
Binge drinking† |
||||||||||
|
Female |
Male |
Total |
Female |
Male |
Total |
|||||||
|
% |
CI§ |
% |
CI |
% |
CI |
% |
CI |
% |
CI |
% |
CI |
|
|
Large urban school district surveys |
||||||||||||
|
Boston, MA |
37.5 |
(32.5–42.8) |
39.4 |
(33.9–45.2) |
38.3 |
(34.2–42.7) |
16.5 |
(12.1–22.0) |
16.8 |
(12.9–21.6) |
16.6 |
(13.5–20.2) |
|
Broward County, FL |
36.7 |
(33.0–40.6) |
37.4 |
(33.9–41.2) |
37.2 |
(34.6–40.0) |
15.2 |
(13.0–17.7) |
19.6 |
(16.3–23.5) |
17.6 |
(15.5–20.0) |
|
Charlotte-Mecklenburg, NC |
33.1 |
(29.4–36.9) |
35.0 |
(30.8–39.4) |
34.1 |
(30.9–37.5) |
13.9 |
(11.6–16.6) |
16.9 |
(14.0–20.2) |
15.6 |
(13.6–17.9) |
|
Chicago, IL |
39.3 |
(35.5–43.2) |
35.9 |
(31.3–40.9) |
37.7 |
(34.3–41.3) |
18.9 |
(14.8–23.9) |
20.7 |
(17.3–24.5) |
19.7 |
(16.5–23.4) |
|
Dallas, TX |
37.6 |
(32.4–43.1) |
32.9 |
(27.5–38.9) |
35.4 |
(31.6–39.4) |
20.0 |
(16.3–24.4) |
19.1 |
(14.8–24.3) |
19.6 |
(16.5–23.1) |
|
Detroit, MI |
24.7 |
(21.5–28.2) |
23.9 |
(20.1–28.3) |
24.7 |
(22.2–27.3) |
7.8 |
(6.2–9.7) |
8.5 |
(6.8–10.5) |
8.2 |
(7.0–9.6) |
|
District of Columbia |
34.9 |
(29.5–40.7) |
30.5 |
(25.8–35.7) |
32.8 |
(29.1–36.7) |
12.9 |
(10.3–16.2) |
12.2 |
(9.4–15.8) |
12.6 |
(10.4–15.3) |
|
Duval County, FL |
38.0 |
(35.1–41.0) |
32.8 |
(29.5–36.4) |
35.6 |
(33.1–38.2) |
17.1 |
(15.1–19.4) |
17.9 |
(15.4–20.7) |
17.6 |
(15.8–19.6) |
|
Houston, TX |
34.5 |
(30.3–39.0) |
31.3 |
(27.3–35.5) |
33.0 |
(30.1–36.0) |
17.8 |
(15.6–20.2) |
17.1 |
(14.5–20.2) |
17.5 |
(15.6–19.6) |
|
Los Angeles,CA |
33.8 |
(29.3–38.5) |
32.0 |
(27.3–37.2) |
32.9 |
(29.5–36.5) |
17.5 |
(14.5–21.1) |
18.1 |
(14.4–22.5) |
17.9 |
(15.5–20.5) |
|
Memphis, TN |
25.8 |
(22.5–29.4) |
18.8 |
(15.8–22.2) |
22.4 |
(19.9–25.1) |
8.4 |
(6.2–11.2) |
6.4 |
(4.5–8.9) |
7.4 |
(5.8–9.5) |
|
Miami- Dade County, FL |
39.6 |
(36.3–43.1) |
30.3 |
(26.1–34.9) |
35.1 |
(32.0–38.4) |
17.8 |
(15.8–20.1) |
17.1 |
(14.1–20.6) |
17.5 |
(15.4–19.8) |
|
Milwaukee,WI |
30.5 |
(27.2–34.0) |
30.0 |
(26.4–33.8) |
30.5 |
(28.0–33.2) |
12.6 |
(10.7–14.9) |
14.4 |
(12.0–17.1) |
13.6 |
(12.1–15.3) |
|
New York City, NY |
32.6 |
(29.8–35.5) |
28.3 |
(26.2–30.5) |
30.6 |
(28.8–32.5) |
12.7 |
(11.4–14.2) |
12.5 |
(11.2–13.9) |
12.7 |
(11.7–13.9) |
|
Orange County, FL |
37.8 |
(33.2–42.6) |
35.0 |
(30.2–40.1) |
36.2 |
(32.5–40.1) |
15.9 |
(12.7–19.7) |
19.3 |
(15.3–24.0) |
17.5 |
(14.6–20.8) |
|
Palm Beach County, FL |
45.4 |
(40.8–50.2) |
41.2 |
(36.8–45.6) |
43.5 |
(39.6–47.4) |
24.8 |
(21.6–28.3) |
25.2 |
(21.4–29.5) |
25.2 |
(22.2–28.4) |
|
Philadelphia, PA |
33.6 |
(29.2–38.4) |
29.0 |
(24.6–33.8) |
31.6 |
(27.9–35.5) |
14.6 |
(11.8–18.0) |
15.6 |
(12.5–19.3) |
15.2 |
(12.7–18.0) |
|
San Bernardino, CA |
42.3 |
(37.7–47.1) |
39.0 |
(34.3–44.0) |
40.6 |
(37.0–44.4) |
22.6 |
(19.1–26.5) |
23.0 |
(19.6–26.8) |
22.7 |
(20.2–25.5) |
|
San Diego, CA |
32.3 |
(27.7–37.3) |
33.6 |
(28.8–38.7) |
33.0 |
(28.9–37.2) |
18.2 |
(14.8–22.3) |
19.8 |
(16.5–23.5) |
19.0 |
(16.1–22.3) |
|
San Francisco, CA |
21.6 |
(18.5–25.0) |
20.2 |
(17.3–23.4) |
21.0 |
(18.8–23.5) |
10.0 |
(7.7–13.0) |
13.0 |
(10.7–15.8) |
11.7 |
(10.0–13.5) |
|
Seattle, WA |
29.9 |
(26.1–33.9) |
24.4 |
(20.8–28.4) |
27.2 |
(24.1–30.6) |
17.5 |
(14.5–21.0) |
16.8 |
(13.9–20.3) |
17.4 |
(15.0–20.2) |
|
Median |
34.5 |
32.0 |
33.0 |
16.5 |
17.1 |
17.5 |
||||||
|
Range |
21.6–45.4 |
18.8–41.2 |
21.0–43.5 |
7.8–24.8 |
6.4–25.2 |
7.4–25.2 |
||||||
|
* Had at least one drink of alcohol on at least 1 day during the 30 days before the survey. † Had five or more drinks of alcohol in a row within a couple of hours on at least 1 day during the 30 days before the survey. § 95% confidence interval. |
||||||||||||
|
TABLE 46. (Continued) Percentage of high school students who drank alcohol on school property* and who usually obtained the alcohol they drank by someone giving it to them,† by sex — selected U.S. sites, Youth Risk Behavior Survey, 2011 |
||||||||||||
|---|---|---|---|---|---|---|---|---|---|---|---|---|
|
Site |
Drank alcohol on school property |
Someone gave alcohol to them |
||||||||||
|
Female |
Male |
Total |
Female |
Male |
Total |
|||||||
|
% |
CI§ |
% |
CI |
% |
CI |
% |
CI |
% |
CI |
% |
CI |
|
|
Large urban school district surveys |
||||||||||||
|
Boston, MA |
4.7 |
(2.7–8.0) |
5.4 |
(3.5–8.3) |
5.0 |
(3.6–7.0) |
39.4 |
(28.1–52.1) |
28.6 |
(21.1–37.5) |
34.4 |
(27.4–42.1) |
|
Broward County, FL |
3.3 |
(2.3–4.8) |
5.5 |
(4.2–7.3) |
4.5 |
(3.6–5.6) |
43.8 |
(35.8–52.2) |
33.4 |
(26.7–40.8) |
38.6 |
(34.3–43.0) |
|
Charlotte-Mecklenburg, NC |
5.2 |
(3.5–7.6) |
7.8 |
(5.9–10.3) |
6.6 |
(4.9–8.7) |
— |
— |
— |
— |
— |
— |
|
Chicago, IL |
4.4 |
(3.3–5.9) |
6.1 |
(4.6–8.2) |
5.2 |
(4.2–6.5) |
36.9 |
(31.7–42.3) |
28.4 |
(22.8–34.7) |
33.3 |
(29.1–37.7) |
|
Dallas, TX |
4.3 |
(3.0–6.1) |
7.0 |
(4.7–10.2) |
5.6 |
(4.2–7.4) |
51.4 |
(42.2–60.5) |
31.7 |
(24.8–39.6) |
42.9 |
(36.2–49.8) |
|
Detroit, MI |
2.2 |
(1.5–3.3) |
4.5 |
(3.4–6.1) |
3.3 |
(2.6–4.2) |
40.8 |
(35.6–46.3) |
33.6 |
(23.7–45.2) |
37.6 |
(32.6–42.9) |
|
District of Columbia |
6.6 |
(4.7–9.3) |
6.9 |
(4.9–9.7) |
6.7 |
(5.1–8.8) |
— |
— |
— |
— |
— |
— |
|
Duval County, FL |
6.3 |
(5.0–7.8) |
6.2 |
(5.0–7.8) |
6.3 |
(5.4–7.4) |
46.0 |
(41.5–50.6) |
32.4 |
(27.2–38.2) |
39.8 |
(36.2–43.6) |
|
Houston, TX |
4.5 |
(3.2–6.1) |
4.8 |
(3.7–6.3) |
4.7 |
(3.9–5.7) |
39.1 |
(33.3–45.2) |
29.0 |
(24.1–34.4) |
34.3 |
(30.1–38.7) |
|
Los Angeles, CA |
8.9 |
(6.6–12.1) |
9.4 |
(6.5–13.6) |
9.3 |
(7.1–11.9) |
44.3 |
(37.8–51.1) |
23.0 |
(17.2–30.1) |
33.4 |
(28.4–38.7) |
|
Memphis, TN |
2.9 |
(2.0–4.1) |
2.1 |
(1.2–3.8) |
2.6 |
(1.8–3.6) |
56.5 |
(48.2–64.5) |
28.7 |
(20.2–39.1) |
44.8 |
(37.7–52.1) |
|
Miami-Dade County, FL |
4.5 |
(3.4–5.9) |
5.1 |
(3.9–6.7) |
4.8 |
(3.8–6.0) |
43.3 |
(37.1–49.6) |
28.4 |
(21.7–36.2) |
37.0 |
(32.5–41.8) |
|
Milwaukee, WI |
— |
— |
— |
— |
— |
— |
53.8 |
(47.7–59.9) |
32.6 |
(26.5–39.4) |
43.2 |
(38.2–48.4) |
|
New York City, NY |
— |
— |
— |
— |
— |
— |
36.4 |
(33.3–39.6) |
27.2 |
(24.2–30.4) |
32.0 |
(29.7–34.5) |
|
Orange County, FL |
3.5 |
(2.2–5.6) |
4.5 |
(3.1–6.7) |
4.0 |
(3.0–5.4) |
51.6 |
(43.9–59.3) |
34.5 |
(28.4–41.1) |
43.3 |
(38.1–48.6) |
|
Palm Beach County, FL |
6.1 |
(4.4–8.3) |
6.3 |
(4.6–8.5) |
6.4 |
(5.0–8.0) |
43.7 |
(38.2–49.3) |
31.3 |
(25.5–37.6) |
37.8 |
(33.2–42.7) |
|
Philadelphia, PA |
4.2 |
(2.8–6.2) |
5.4 |
(3.7–7.8) |
4.8 |
(3.7–6.3) |
33.8 |
(27.1–41.3) |
26.7 |
(21.0–33.2) |
30.5 |
(25.8–35.6) |
|
San Bernardino, CA |
10.6 |
(8.4–13.4) |
10.9 |
(8.0–14.7) |
10.7 |
(8.8–13.0) |
42.7 |
(35.9–49.9) |
29.5 |
(24.1–35.5) |
36.3 |
(32.1–40.6) |
|
San Diego, CA |
7.8 |
(5.1–11.6) |
7.8 |
(5.6–10.8) |
7.8 |
(5.7–10.5) |
44.6 |
(36.3–53.2) |
19.6 |
(15.0–25.1) |
31.6 |
(26.0–37.8) |
|
San Francisco, CA |
4.9 |
(3.6–6.6) |
5.6 |
(4.0–7.7) |
5.3 |
(4.2–6.8) |
32.3 |
(25.1–40.5) |
20.5 |
(15.4–26.7) |
26.5 |
(22.1–31.4) |
|
Seattle, WA |
5.9 |
(4.3–7.9) |
5.9 |
(4.0–8.5) |
6.1 |
(4.8–7.8) |
40.4 |
(33.7–47.5) |
28.6 |
(21.9–36.3) |
34.8 |
(29.7–40.2) |
|
Median |
4.7 |
5.9 |
5.3 |
43.3 |
28.7 |
36.3 |
||||||
|
Range |
2.2–10.6 |
2.1–10.9 |
2.6–10.7 |
32.3–56.5 |
19.6–34.5 |
26.5–44.8 |
||||||
|
* At least one drink of alcohol on at least 1 day during the 30 days before the survey. † Among students who currently drank alcohol during the 30 days before the survey. § 95% confidence interval. ¶ Not available. |
||||||||||||
|
TABLE 48. (Continued) Percentage of high school students who used marijuana, by sex — selected U.S. sites, Youth Risk Behavior Survey, 2011 |
||||||||||||
|---|---|---|---|---|---|---|---|---|---|---|---|---|
|
Site |
Ever used marijuana* |
Tried marijuana for the first time before age 13 years |
||||||||||
|
Female |
Male |
Total |
Female |
Male |
Total |
|||||||
|
% |
CI† |
% |
CI |
% |
CI |
% |
CI |
% |
CI |
% |
CI |
|
|
Large urban school district surveys |
||||||||||||
|
Boston, MA |
36.2 |
(31.9–40.7) |
44.5 |
(38.8–50.4) |
40.3 |
(36.9–43.8) |
6.6 |
(4.5–9.4) |
12.8 |
(10.0–16.2) |
9.7 |
(8.1–11.5) |
|
Broward County, FL |
34.4 |
(30.5–38.6) |
41.5 |
(37.3–45.8) |
38.1 |
(34.9–41.4) |
4.3 |
(3.0–6.0) |
10.7 |
(8.7–13.1) |
7.5 |
(6.2–9.0) |
|
Charlotte-Mecklenburg, NC |
43.6 |
(38.3–49.1) |
48.6 |
(42.9–54.2) |
46.3 |
(42.0–50.6) |
6.9 |
(5.0–9.5) |
14.4 |
(11.6–17.8) |
11.1 |
(9.1–13.4) |
|
Chicago, IL |
40.0 |
(35.5–44.7) |
45.8 |
(40.3–51.4) |
42.6 |
(38.4–46.9) |
9.2 |
(7.5–11.4) |
14.6 |
(12.3–17.3) |
11.9 |
(10.1–14.0) |
|
Dallas, TX |
35.3 |
(30.7–40.1) |
46.8 |
(42.3–51.4) |
41.0 |
(37.3–44.8) |
7.8 |
(5.2–11.5) |
12.1 |
(9.0–16.1) |
10.0 |
(7.7–12.8) |
|
Detroit, MI |
46.3 |
(42.3–50.4) |
49.2 |
(44.1–54.3) |
47.9 |
(44.5–51.3) |
5.6 |
(4.4–7.1) |
14.4 |
(11.0–18.5) |
10.1 |
(8.2–12.3) |
|
District of Columbia |
40.3 |
(36.0–44.8) |
46.1 |
(41.1–51.2) |
43.0 |
(39.6–46.5) |
9.0 |
(6.7–11.9) |
13.2 |
(10.3–16.8) |
11.0 |
(9.2–13.1) |
|
Duval County, FL |
36.7 |
(33.4–40.1) |
44.1 |
(40.7–47.6) |
40.5 |
(37.8–43.2) |
8.3 |
(6.6–10.4) |
14.4 |
(12.3–16.9) |
11.5 |
(10.1–13.0) |
|
Houston, TX |
34.9 |
(31.1–38.8) |
42.8 |
(38.8–46.9) |
38.9 |
(36.0–42.0) |
7.1 |
(5.5–9.1) |
13.5 |
(11.2–16.2) |
10.4 |
(8.8–12.1) |
|
Los Angeles, CA |
40.5 |
(35.9–45.4) |
43.8 |
(36.6–51.4) |
42.4 |
(37.0–47.9) |
8.8 |
(6.3–12.3) |
15.1 |
(12.1–18.8) |
12.3 |
(10.3–14.5) |
|
Memphis, TN |
33.6 |
(30.1–37.2) |
42.3 |
(37.4–47.4) |
37.8 |
(34.2–41.5) |
7.2 |
(5.4–9.7) |
13.2 |
(10.5–16.4) |
10.2 |
(8.4–12.3) |
|
Miami-Dade County, FL |
30.0 |
(26.7–33.4) |
34.1 |
(29.9–38.5) |
32.2 |
(29.4–35.1) |
4.8 |
(3.5–6.5) |
7.8 |
(6.2–9.7) |
6.3 |
(5.2–7.7) |
|
Milwaukee, WI |
51.6 |
(47.7–55.4) |
56.3 |
(52.4–60.1) |
54.1 |
(51.2–56.9) |
11.9 |
(9.7–14.6) |
18.3 |
(15.2–21.9) |
15.2 |
(13.1–17.6) |
|
New York City, NY |
— |
— |
— |
— |
— |
— |
5.2 |
(4.2–6.3) |
8.9 |
(7.8–10.1) |
7.1 |
(6.2–8.1) |
|
Orange County, FL |
31.5 |
(27.3–35.9) |
36.2 |
(31.6–41.0) |
33.9 |
(30.3–37.7) |
5.0 |
(3.3–7.5) |
10.1 |
(7.6–13.3) |
7.6 |
(6.0–9.5) |
|
Palm Beach County, FL |
41.3 |
(37.7–45.0) |
45.7 |
(41.8–49.6) |
43.5 |
(40.2–46.9) |
6.6 |
(4.9–8.7) |
10.5 |
(8.3–13.2) |
8.6 |
(7.1–10.3) |
|
Philadelphia, PA |
33.7 |
(29.5–38.2) |
42.6 |
(37.9–47.5) |
38.2 |
(34.6–42.1) |
5.1 |
(3.7–6.9) |
10.7 |
(8.1–14.0) |
7.9 |
(6.2–9.8) |
|
San Bernardino, CA |
46.6 |
(41.3–52.1) |
49.1 |
(44.4–53.8) |
47.8 |
(43.5–52.1) |
7.7 |
(5.9–10.1) |
17.0 |
(13.4–21.3) |
12.4 |
(10.1–15.1) |
|
San Diego, CA |
38.9 |
(34.4–43.7) |
41.2 |
(35.8–46.8) |
40.1 |
(35.6–44.8) |
8.7 |
(6.2–12.1) |
12.5 |
(9.6–16.1) |
10.6 |
(8.2–13.7) |
|
San Francisco, CA |
28.3 |
(24.9–32.1) |
31.0 |
(27.2–35.1) |
30.1 |
(27.1–33.2) |
6.7 |
(4.9–9.1) |
9.2 |
(6.5–12.8) |
8.3 |
(6.5–10.6) |
|
Seattle, WA |
— |
— |
— |
— |
— |
— |
5.1 |
(3.8–6.9) |
9.4 |
(7.5–11.6) |
7.5 |
(6.2–9.0) |
|
Median |
36.7 |
44.1 |
40.5 |
6.9 |
12.8 |
10.1 |
||||||
|
Range |
28.3–51.6 |
31.0–56.3 |
30.1–54.1 |
4.3–11.9 |
7.8–18.3 |
6.3–15.2 |
||||||
|
* Used marijuana one or more times during their life. † 95% confidence interval. § Not available. |
||||||||||||
|
TABLE 50. (Continued) Percentage of high school students who currently used marijuana* and who used marijuana on school property,† by sex — selected U.S. sites, Youth Risk Behavior Survey, 2011 |
||||||||||||
|---|---|---|---|---|---|---|---|---|---|---|---|---|
|
Site |
Current marijuana use |
Used marijuana on school property |
||||||||||
|
Female |
Male |
Total |
Female |
Male |
Total |
|||||||
|
% |
CI§ |
% |
CI |
% |
CI |
% |
CI |
% |
CI |
% |
CI |
|
|
Large urban school district surveys |
||||||||||||
|
Boston, MA |
21.2 |
(17.6–25.4) |
32.7 |
(27.3–38.6) |
27.0 |
(24.1–30.2) |
5.9 |
(3.9–8.8) |
8.2 |
(5.5–12.3) |
7.1 |
(5.3–9.5) |
|
Broward County, FL |
17.9 |
(15.3–21.0) |
25.7 |
(22.5–29.2) |
22.1 |
(19.8–24.5) |
3.4 |
(2.3–4.9) |
7.8 |
(6.0–10.0) |
5.8 |
(4.6–7.3) |
|
Charlotte-Mecklenburg, NC |
24.0 |
(20.6–27.7) |
31.0 |
(26.5–35.8) |
27.6 |
(24.7–30.8) |
— |
— |
— |
— |
— |
— |
|
Chicago, IL |
21.7 |
(17.8–26.1) |
29.1 |
(24.9–33.6) |
25.0 |
(21.4–28.9) |
6.2 |
(4.4–8.6) |
12.6 |
(10.4–15.2) |
9.1 |
(7.2–11.4) |
|
Dallas, TX |
17.1 |
(13.5–21.5) |
22.2 |
(17.6–27.7) |
19.5 |
(16.4–23.1) |
1.8 |
(0.9–3.5) |
7.8 |
(4.9–12.2) |
4.7 |
(3.1–7.1) |
|
Detroit, MI |
13.6 |
(11.0–16.7) |
18.8 |
(15.0–23.1) |
16.3 |
(13.9–19.1) |
2.1 |
(1.4–3.0) |
6.9 |
(5.1–9.5) |
4.6 |
(3.6–5.9) |
|
District of Columbia |
24.0 |
(20.9–27.3) |
28.5 |
(24.3–33.1) |
26.1 |
(23.6–28.7) |
6.5 |
(4.9–8.6) |
9.4 |
(6.6–13.3) |
7.9 |
(6.2–9.9) |
|
Duval County, FL |
18.9 |
(16.6–21.5) |
26.7 |
(23.9–29.8) |
22.9 |
(20.9–25.0) |
4.7 |
(3.5–6.3) |
9.8 |
(8.1–11.7) |
7.3 |
(6.3–8.5) |
|
Houston, TX |
16.0 |
(13.5–18.9) |
22.8 |
(19.5–26.5) |
19.5 |
(17.1–22.1) |
4.5 |
(3.3–6.3) |
6.2 |
(4.8–8.1) |
5.5 |
(4.4–6.8) |
|
Los Angeles, CA |
19.8 |
(16.4–23.8) |
24.8 |
(18.7–32.0) |
22.4 |
(18.3–27.2) |
7.8 |
(5.8–10.5) |
12.3 |
(8.6–17.4) |
10.3 |
(8.0–13.1) |
|
Memphis, TN |
15.2 |
(12.1–18.8) |
26.0 |
(22.1–30.2) |
20.4 |
(17.8–23.3) |
2.1 |
(1.3–3.4) |
7.8 |
(5.7–10.6) |
4.9 |
(3.7–6.5) |
|
Miami-Dade County, FL |
15.7 |
(13.3–18.4) |
20.8 |
(17.6–24.5) |
18.3 |
(16.3–20.6) |
5.0 |
(3.5–7.2) |
8.1 |
(6.0–10.8) |
6.5 |
(5.1–8.4) |
|
Milwaukee, WI |
28.5 |
(25.0–32.2) |
34.7 |
(30.9–38.8) |
31.7 |
(28.9–34.7) |
— |
— |
— |
— |
— |
— |
|
New York City, NY |
15.7 |
(14.1–17.5) |
19.7 |
(18.2–21.1) |
17.7 |
(16.6–19.0) |
— |
— |
— |
— |
— |
— |
|
Orange County, FL |
18.0 |
(15.1–21.4) |
22.5 |
(18.7–26.9) |
20.2 |
(17.6–23.2) |
2.4 |
(1.3–4.5) |
6.6 |
(4.2–10.3) |
4.5 |
(3.1–6.4) |
|
Palm Beach County, FL |
25.5 |
(22.2–29.0) |
27.4 |
(23.9–31.3) |
26.6 |
(23.8–29.6) |
5.7 |
(4.3–7.4) |
8.5 |
(6.5–11.1) |
7.2 |
(5.9–8.8) |
|
Philadelphia, PA |
17.7 |
(15.0–20.9) |
24.5 |
(20.8–28.6) |
21.3 |
(18.6–24.3) |
3.7 |
(2.6–5.1) |
7.4 |
(5.3–10.2) |
5.4 |
(4.2–6.9) |
|
San Bernardino, CA |
23.1 |
(19.6–27.0) |
28.4 |
(24.2–33.1) |
25.8 |
(22.5–29.3) |
8.6 |
(6.6–11.2) |
14.5 |
(11.1–18.7) |
11.5 |
(9.5–14.0) |
|
San Diego, CA |
21.5 |
(17.6–25.9) |
26.4 |
(22.5–30.8) |
24.0 |
(20.6–27.9) |
5.8 |
(4.0–8.4) |
10.3 |
(7.8–13.5) |
8.2 |
(6.2–10.7) |
|
San Francisco, CA |
17.6 |
(14.7–20.9) |
17.7 |
(14.6–21.3) |
17.9 |
(15.8–20.3) |
4.5 |
(3.0–6.7) |
8.5 |
(6.3–11.4) |
6.7 |
(5.3–8.5) |
|
Seattle, WA |
18.3 |
(14.9–22.2) |
22.8 |
(19.4–26.6) |
20.8 |
(18.2–23.7) |
6.6 |
(4.8–8.9) |
9.7 |
(7.6–12.3) |
8.5 |
(6.8–10.6) |
|
Median |
18.3 |
25.7 |
22.1 |
4.8 |
8.3 |
6.9 |
||||||
|
Range |
13.6–28.5 |
17.7–34.7 |
16.3–31.7 |
1.8–8.6 |
6.2–14.5 |
4.5–11.5 |
||||||
|
* Used marijuana one or more times during the 30 days before the survey. † One or more times during the 30 days before the survey. § 95% confidence interval. ¶ Not available. |
||||||||||||
|
TABLE 52. (Continued) Percentage of high school students who used cocaine, by sex — selected U.S. sites, Youth Risk Behavior Survey, 2011 |
||||||||||||
|---|---|---|---|---|---|---|---|---|---|---|---|---|
|
Site |
Ever used cocaine* |
Current cocaine use† |
||||||||||
|
Female |
Male |
Total |
Female |
Male |
Total |
|||||||
|
% |
CI§ |
% |
CI |
% |
CI |
% |
CI |
% |
CI |
% |
CI |
|
|
Large urban school district surveys |
||||||||||||
|
Boston, MA |
1.6 |
(0.8–2.8) |
4.6 |
(2.8–7.6) |
3.1 |
(2.0–4.6) |
1.2 |
(0.5–3.0) |
2.3 |
(0.9–5.8) |
1.7 |
(0.9–3.3) |
|
Broward County, FL |
4.8 |
(3.4–6.7) |
5.8 |
(4.2–8.0) |
5.5 |
(4.3–6.9) |
2.0 |
(1.2–3.3) |
3.3 |
(2.3–4.7) |
2.7 |
(2.0–3.6) |
|
Charlotte-Mecklenburg, NC |
5.0 |
(3.6–7.1) |
9.2 |
(6.4–13.1) |
7.5 |
(5.5–10.0) |
— |
— |
— |
— |
— |
— |
|
Chicago, IL |
4.5 |
(3.3–6.0) |
7.3 |
(5.4–9.8) |
5.9 |
(4.7–7.4) |
1.4 |
(0.8–2.3) |
3.1 |
(2.0–4.6) |
2.2 |
(1.6–3.1) |
|
Dallas, TX |
6.4 |
(4.3–9.5) |
9.5 |
(7.4–12.3) |
8.0 |
(6.5–9.8) |
1.8 |
(1.0–3.2) |
3.1 |
(2.0–4.7) |
2.5 |
(1.7–3.4) |
|
Detroit, MI |
2.3 |
(1.4–3.8) |
4.9 |
(3.5–6.9) |
4.1 |
(3.0–5.4) |
0.7 |
(0.4–1.5) |
2.9 |
(1.8–4.8) |
2.0 |
(1.4–3.0) |
|
District of Columbia |
1.8 |
(1.1–3.2) |
7.3 |
(4.7–11.2) |
4.6 |
(3.0–6.9) |
— |
— |
— |
— |
— |
— |
|
Duval County, FL |
4.4 |
(3.4–5.6) |
6.8 |
(5.4–8.5) |
5.7 |
(4.8–6.8) |
2.3 |
(1.6–3.2) |
3.6 |
(2.7–4.8) |
3.0 |
(2.4–3.9) |
|
Houston, TX |
7.0 |
(5.3–9.0) |
9.8 |
(7.8–12.4) |
8.5 |
(7.1–10.1) |
1.9 |
(1.2–3.0) |
4.6 |
(3.4–6.1) |
3.3 |
(2.6–4.3) |
|
Los Angeles, CA |
8.3 |
(6.4–10.7) |
9.5 |
(6.6–13.5) |
9.2 |
(7.4–11.4) |
2.6 |
(1.7–4.1) |
4.9 |
(2.8–8.4) |
4.1 |
(2.8–6.0) |
|
Memphis, TN |
0.8 |
(0.4–1.6) |
2.2 |
(1.4–3.4) |
1.5 |
(1.0–2.3) |
0.7 |
(0.3–1.4) |
0.8 |
(0.4–1.7) |
0.8 |
(0.5–1.2) |
|
Miami-Dade County, FL |
5.5 |
(4.1–7.3) |
6.9 |
(5.1–9.4) |
6.1 |
(5.0–7.6) |
3.3 |
(2.3–4.6) |
4.2 |
(2.9–6.1) |
3.7 |
(2.8–4.9) |
|
Milwaukee, WI |
3.2 |
(2.1–4.7) |
6.9 |
(5.1–9.2) |
5.1 |
(4.0–6.4) |
1.8 |
(1.1–3.1) |
3.1 |
(1.9–5.0) |
2.6 |
(1.8–3.9) |
|
New York City, NY |
3.0 |
(2.5–3.8) |
4.9 |
(4.1–5.9) |
4.1 |
(3.5–4.8) |
— |
— |
— |
— |
— |
— |
|
Orange County, FL |
3.2 |
(2.1–5.0) |
7.1 |
(4.9–10.2) |
5.1 |
(3.9–6.8) |
2.0 |
(1.2–3.5) |
4.1 |
(2.4–6.7) |
3.0 |
(2.1–4.4) |
|
Palm Beach County, FL |
5.5 |
(4.2–7.2) |
7.8 |
(6.0–10.0) |
6.8 |
(5.7–8.1) |
2.9 |
(1.9–4.3) |
5.5 |
(4.0–7.4) |
4.3 |
(3.4–5.4) |
|
Philadelphia, PA |
1.4 |
(0.7–2.8) |
4.8 |
(3.1–7.3) |
3.2 |
(2.3–4.5) |
0.7 |
(0.3–1.6) |
2.8 |
(1.6–5.0) |
1.9 |
(1.2–2.9) |
|
San Bernardino, CA |
6.4 |
(4.6–8.7) |
12.2 |
(9.5–15.5) |
9.3 |
(7.6–11.3) |
2.8 |
(1.6–4.6) |
5.3 |
(3.6–7.6) |
4.0 |
(2.9–5.4) |
|
San Diego, CA |
6.9 |
(4.6–10.3) |
9.8 |
(7.6–12.5) |
8.4 |
(6.6–10.7) |
3.1 |
(1.9–5.0) |
4.6 |
(3.2–6.7) |
3.9 |
(3.0–5.0) |
|
San Francisco, CA |
4.8 |
(3.4–6.9) |
8.1 |
(6.2–10.5) |
7.1 |
(5.6–8.9) |
— |
— |
— |
— |
— |
— |
|
Seattle, WA |
— |
— |
— |
— |
— |
— |
— |
— |
— |
— |
— |
— |
|
Median |
4.6 |
7.2 |
5.8 |
1.9 |
3.4 |
2.8 |
||||||
|
Range |
0.8–8.3 |
2.2–12.2 |
1.5–9.3 |
0.7–3.3 |
0.8–5.5 |
0.8–4.3 |
||||||
|
* Used any form of cocaine (e.g., powder, crack, or freebase) one or more times during their life. † Used any form of cocaine one or more times during the 30 days before the survey. § 95% confidence interval. ¶ Not available. |
||||||||||||
|
TABLE 54. (Continued) Percentage of high school students who used inhalants* and who used ecstasy,† by sex — selected U.S. sites, Youth Risk Behavior Survey, 2011 |
||||||||||||
|---|---|---|---|---|---|---|---|---|---|---|---|---|
|
Site |
Ever used inhalants |
Ever used ecstasy |
||||||||||
|
Female |
Male |
Total |
Female |
Male |
Total |
|||||||
|
% |
CI§ |
% |
CI |
% |
CI |
% |
CI |
% |
CI |
% |
CI |
|
|
Large urban school district surveys |
||||||||||||
|
Boston, MA |
3.9 |
(2.5–6.0) |
7.4 |
(4.3–12.5) |
5.6 |
(3.9–8.0) |
2.0 |
(1.0–4.0) |
4.6 |
(2.6–8.2) |
3.3 |
(2.0–5.4) |
|
Broward County, FL |
9.4 |
(6.8–13.0) |
8.4 |
(5.9–11.8) |
9.0 |
(6.7–11.9) |
7.1 |
(4.9–10.1) |
10.6 |
(7.9–14.1) |
9.2 |
(6.9–12.0) |
|
Charlotte-Mecklenburg, NC |
12.3 |
(9.8–15.4) |
11.8 |
(8.5–16.0) |
12.3 |
(10.2–14.7) |
6.1 |
(4.3–8.4) |
10.2 |
(7.2–14.2) |
8.5 |
(6.5–11.2) |
|
Chicago, IL |
10.4 |
(8.2–13.0) |
10.9 |
(8.7–13.6) |
10.7 |
(9.1–12.5) |
5.1 |
(3.7–7.1) |
8.7 |
(6.8–11.0) |
6.9 |
(5.6–8.4) |
|
Dallas, TX |
9.1 |
(6.8–12.2) |
7.9 |
(5.8–10.9) |
8.5 |
(6.7–10.7) |
5.1 |
(3.5–7.4) |
10.7 |
(8.1–14.0) |
7.9 |
(6.5–9.7) |
|
Detroit, MI |
7.6 |
(5.8–9.9) |
7.4 |
(5.4–10.0) |
7.9 |
(6.5–9.5) |
— |
— |
— |
— |
— |
— |
|
District of Columbia |
11.4 |
(9.1–14.3) |
12.2 |
(9.0–16.3) |
11.8 |
(9.7–14.2) |
2.9 |
(1.9–4.5) |
6.8 |
(4.7–9.7) |
4.8 |
(3.6–6.5) |
|
Duval County, FL |
11.3 |
(9.5–13.4) |
9.6 |
(8.0–11.6) |
10.7 |
(9.4–12.1) |
5.2 |
(4.2–6.6) |
10.4 |
(8.5–12.7) |
8.0 |
(6.8–9.4) |
|
Houston, TX |
9.3 |
(7.4–11.6) |
9.0 |
(7.0–11.5) |
9.2 |
(8.0–10.7) |
7.8 |
(6.0–10.0) |
11.0 |
(8.8–13.7) |
9.5 |
(8.1–11.2) |
|
Los Angeles, CA |
16.8 |
(14.3–19.7) |
12.4 |
(9.2–16.6) |
14.9 |
(12.7–17.3) |
16.7 |
(13.5–20.5) |
15.5 |
(11.6–20.4) |
16.4 |
(13.8–19.3) |
|
Memphis, TN |
9.1 |
(7.0–11.7) |
4.0 |
(2.7–6.0) |
6.6 |
(5.2–8.5) |
1.6 |
(0.9–2.7) |
3.7 |
(2.3–5.9) |
2.7 |
(1.8–3.9) |
|
Miami-Dade County, FL |
10.6 |
(7.9–13.9) |
9.4 |
(7.4–11.9) |
9.9 |
(8.1–12.1) |
9.0 |
(7.2–11.3) |
10.7 |
(8.5–13.4) |
9.9 |
(8.2–11.9) |
|
Milwaukee, WI |
10.5 |
(8.4–13.2) |
9.5 |
(7.0–12.7) |
10.3 |
(8.4–12.5) |
6.4 |
(4.6–8.8) |
11.3 |
(8.6–14.7) |
9.2 |
(7.2–11.6) |
|
New York City, NY |
11.2 |
(9.6–13.0) |
8.4 |
(7.4–9.5) |
10.0 |
(8.9–11.1) |
3.0 |
(2.4–3.8) |
6.2 |
(5.2–7.3) |
4.7 |
(4.1–5.4) |
|
Orange County, FL |
10.9 |
(8.2–14.4) |
10.0 |
(7.6–13.0) |
10.5 |
(8.8–12.5) |
5.6 |
(4.0–7.9) |
8.7 |
(6.2–12.2) |
7.2 |
(5.6–9.3) |
|
Palm Beach County, FL |
9.5 |
(7.8–11.5) |
9.7 |
(7.5–12.4) |
9.8 |
(8.5–11.3) |
9.7 |
(7.8–12.0) |
11.6 |
(9.2–14.6) |
10.7 |
(9.0–12.7) |
|
Philadelphia, PA |
7.1 |
(5.5–9.1) |
9.6 |
(7.1–12.8) |
8.5 |
(7.0–10.2) |
3.2 |
(1.9–5.3) |
4.3 |
(2.6–7.1) |
4.0 |
(2.6–6.1) |
|
San Bernardino, CA |
20.1 |
(17.0–23.6) |
17.2 |
(14.2–20.8) |
18.7 |
(16.4–21.2) |
15.6 |
(12.9–18.7) |
16.9 |
(14.1–20.1) |
16.2 |
(13.9–18.7) |
|
San Diego, CA |
12.1 |
(9.4–15.4) |
9.8 |
(8.0–12.0) |
11.0 |
(9.2–13.1) |
16.8 |
(13.0–21.4) |
15.4 |
(12.6–18.7) |
16.1 |
(13.3–19.2) |
|
San Francisco, CA |
5.0 |
(3.6–7.0) |
8.6 |
(6.4–11.5) |
7.4 |
(5.9–9.3) |
10.6 |
(8.5–13.2) |
12.6 |
(10.3–15.2) |
12.1 |
(10.2–14.2) |
|
Seattle, WA |
6.4 |
(5.0–8.2) |
9.0 |
(7.2–11.4) |
8.1 |
(6.8–9.6) |
— |
— |
— |
— |
— |
— |
|
Median |
10.4 |
9.5 |
9.9 |
6.1 |
10.6 |
8.5 |
||||||
|
Range |
3.9–20.1 |
4.0–17.2 |
5.6–18.7 |
1.6–16.8 |
3.7–16.9 |
2.7–16.4 |
||||||
|
* Sniffed glue, breathed the contents of aerosol spray cans, or inhaled any paints or sprays to get high one or more times during their life. † Used ecstasy (also called "MDMA") one or more times during their life. § 95% confidence interval. ¶ Not available. |
||||||||||||
|
TABLE 56. (Continued) Percentage of high school students who used heroin* and who used methamphetamines,† by sex — selected U.S. sites, Youth Risk Behavior Survey, 2011 |
||||||||||||
|---|---|---|---|---|---|---|---|---|---|---|---|---|
|
Site |
Ever used heroin |
Ever used methamphetamines |
||||||||||
|
Female |
Male |
Total |
Female |
Male |
Total |
|||||||
|
% |
CI§ |
% |
CI |
% |
CI |
% |
CI |
% |
CI |
% |
CI |
|
|
Large urban school district surveys |
||||||||||||
|
Boston, MA |
1.0 |
(0.4–2.3) |
2.9 |
(1.5–5.8) |
2.0 |
(1.1–3.5) |
0.9 |
(0.3–2.4) |
3.1 |
(1.5–6.2) |
2.0 |
(1.1–3.7) |
|
Broward County, FL |
1.7 |
(0.9–3.2) |
2.4 |
(1.4–4.2) |
2.1 |
(1.2–3.5) |
2.5 |
(1.2–4.9) |
3.7 |
(2.3–6.0) |
3.3 |
(2.0–5.2) |
|
Charlotte-Mecklenburg, NC |
2.2 |
(1.4–3.5) |
6.5 |
(3.9–10.4) |
4.8 |
(3.1–7.4) |
3.3 |
(2.1–5.1) |
6.8 |
(4.2–10.9) |
5.6 |
(3.8–8.0) |
|
Chicago, IL |
2.2 |
(1.3–3.6) |
5.1 |
(3.4–7.7) |
3.9 |
(2.9–5.2) |
2.0 |
(1.1–3.8) |
4.4 |
(3.1–6.0) |
3.4 |
(2.7–4.3) |
|
Dallas, TX |
1.5 |
(0.8–2.8) |
3.6 |
(2.3–5.6) |
2.6 |
(1.8–3.8) |
1.7 |
(0.9–3.2) |
4.5 |
(3.0–6.6) |
3.1 |
(2.1–4.4) |
|
Detroit, MI |
1.1 |
(0.6–2.1) |
3.3 |
(1.9–5.6) |
2.4 |
(1.5–3.6) |
1.5 |
(0.9–2.4) |
4.3 |
(2.8–6.6) |
3.3 |
(2.4–4.6) |
|
District of Columbia |
1.2 |
(0.4–3.9) |
6.6 |
(4.1–10.3) |
3.9 |
(2.4–6.4) |
0.7 |
(0.2–1.9) |
5.1 |
(3.1–8.4) |
3.0 |
(1.8–4.9) |
|
Duval County, FL |
— |
— |
— |
— |
— |
— |
4.6 |
(3.6–5.9) |
5.8 |
(4.5–7.5) |
5.4 |
(4.5–6.5) |
|
Houston, TX |
1.9 |
(1.2–2.9) |
5.5 |
(4.2–7.2) |
3.8 |
(3.0–4.8) |
2.9 |
(1.9–4.5) |
5.4 |
(3.7–7.8) |
4.3 |
(3.3–5.6) |
|
Los Angeles, CA |
1.3 |
(0.7–2.5) |
6.7 |
(3.9–11.4) |
4.4 |
(2.8–7.1) |
5.2 |
(4.1–6.6) |
8.0 |
(5.5–11.4) |
6.9 |
(5.4–8.7) |
|
Memphis, TN |
0.3 |
(0.1–1.2) |
1.2 |
(0.5–2.6) |
0.8 |
(0.4–1.7) |
0.6 |
(0.2–1.7) |
2.0 |
(1.2–3.4) |
1.3 |
(0.8–2.2) |
|
Miami-Dade County, FL |
2.0 |
(1.3–3.1) |
4.0 |
(2.7–5.8) |
3.0 |
(2.1–4.2) |
3.7 |
(2.9–4.9) |
4.4 |
(3.0–6.4) |
4.0 |
(3.1–5.2) |
|
Milwaukee, WI |
3.9 |
(2.7–5.6) |
6.1 |
(4.0–9.4) |
5.3 |
(3.7–7.7) |
2.8 |
(1.8–4.3) |
7.5 |
(5.2–10.8) |
5.4 |
(3.7–7.9) |
|
New York City, NY |
1.6 |
(1.2–2.1) |
3.5 |
(2.8–4.2) |
2.7 |
(2.3–3.2) |
1.6 |
(1.3–2.0) |
3.7 |
(2.9–4.7) |
2.8 |
(2.3–3.4) |
|
Orange County, FL |
1.2 |
(0.6–2.3) |
3.9 |
(2.2–6.9) |
2.5 |
(1.6–4.0) |
2.2 |
(1.3–3.7) |
3.7 |
(2.2–6.1) |
2.9 |
(2.0–4.3) |
|
Palm Beach County, FL |
3.2 |
(2.2–4.5) |
5.3 |
(3.7–7.7) |
4.4 |
(3.4–5.8) |
3.6 |
(2.5–5.3) |
5.6 |
(3.8–8.2) |
4.8 |
(3.7–6.2) |
|
Philadelphia, PA |
1.2 |
(0.6–2.5) |
4.0 |
(2.4–6.6) |
2.8 |
(1.8–4.2) |
1.6 |
(0.8–3.2) |
3.7 |
(2.2–6.2) |
2.8 |
(1.8–4.4) |
|
San Bernardino, CA |
1.5 |
(0.8–2.7) |
2.9 |
(1.8–4.6) |
2.2 |
(1.6–3.1) |
4.1 |
(2.9–5.7) |
5.3 |
(3.7–7.5) |
4.6 |
(3.7–5.9) |
|
San Diego, CA |
1.9 |
(1.1–3.2) |
3.5 |
(2.2–5.5) |
2.8 |
(1.9–3.9) |
3.2 |
(2.1–4.9) |
6.4 |
(4.7–8.8) |
4.9 |
(3.8–6.4) |
|
San Francisco, CA |
2.3 |
(1.3–4.1) |
6.5 |
(4.8–8.7) |
5.0 |
(3.7–6.6) |
3.4 |
(2.2–5.2) |
6.0 |
(4.5–8.0) |
5.3 |
(4.2–6.6) |
|
Seattle, WA |
— |
— |
— |
— |
— |
— |
3.8 |
(2.5–5.8) |
6.0 |
(4.8–7.5) |
5.2 |
(4.0–6.6) |
|
Median |
1.6 |
4.0 |
2.8 |
2.8 |
5.1 |
4.0 |
||||||
|
Range |
0.3–3.9 |
1.2–6.7 |
0.8–5.3 |
0.6–5.2 |
2.0–8.0 |
1.3–6.9 |
||||||
|
* Used heroin (also called "smack," "junk," or "China White") one or more times during their life. † Used methamphetamines (also called "speed," "crystal," "crank," or "ice") one or more times during their life. § 95% confidence interval. ¶ Not available. |
||||||||||||
|
TABLE 60. (Continued) Percentage of high school students who took prescription drugs* and who injected illegal drugs,† by sex — selected U.S. sites, Youth Risk Behavior Survey, 2011 |
||||||||||||
|---|---|---|---|---|---|---|---|---|---|---|---|---|
|
Site |
Ever took prescription drugs without a doctor's prescription |
Ever injected any illegal drug |
||||||||||
|
Female |
Male |
Total |
Female |
Male |
Total |
|||||||
|
% |
CI§ |
% |
CI |
% |
CI |
% |
CI |
% |
CI |
% |
CI |
|
|
Large urban school district surveys |
||||||||||||
|
Boston, MA |
— |
— |
— |
— |
— |
— |
0.9 |
(0.3–2.3) |
2.7 |
(1.4–5.3) |
1.8 |
(1.0–3.2) |
|
Broward County, FL |
11.1 |
(9.1–13.5) |
14.1 |
(11.3–17.3) |
12.8 |
(11.0–14.9) |
1.3 |
(0.6–3.0) |
1.3 |
(0.7–2.3) |
1.4 |
(0.8–2.6) |
|
Charlotte-Mecklenburg, NC |
16.2 |
(13.1–19.9) |
20.1 |
(16.4–24.4) |
18.3 |
(15.5–21.5) |
— |
— |
— |
— |
— |
— |
|
Chicago, IL |
7.9 |
(5.6–11.2) |
11.7 |
(9.4–14.5) |
9.8 |
(7.9–12.0) |
2.0 |
(1.4–3.1) |
4.6 |
(3.1–6.6) |
3.4 |
(2.7–4.2) |
|
Dallas, TX |
11.9 |
(8.8–15.8) |
17.4 |
(14.5–20.6) |
14.5 |
(12.4–17.0) |
1.0 |
(0.4–2.1) |
1.1 |
(0.5–2.5) |
1.0 |
(0.6–1.8) |
|
Detroit, MI |
— |
— |
— |
— |
— |
— |
17.4 |
(13.8–21.6) |
7.9 |
(5.5–11.1) |
13.0 |
(10.4–16.0) |
|
District of Columbia |
5.8 |
(3.9–8.5) |
8.8 |
(6.3–12.1) |
7.3 |
(5.6–9.6) |
— |
— |
— |
— |
— |
— |
|
Duval County, FL |
— |
— |
— |
— |
— |
— |
3.7 |
(2.8–5.1) |
4.9 |
(3.7–6.5) |
4.5 |
(3.6–5.4) |
|
Houston, TX |
15.1 |
(12.8–17.8) |
15.1 |
(12.5–18.0) |
15.1 |
(13.3–17.1) |
2.5 |
(1.8–3.5) |
4.6 |
(3.4–6.2) |
3.7 |
(2.9–4.6) |
|
Los Angeles, CA |
11.9 |
(9.8–14.3) |
11.7 |
(8.3–16.1) |
12.1 |
(10.0–14.5) |
1.7 |
(0.9–3.1) |
4.7 |
(2.3–9.2) |
3.4 |
(1.9–6.0) |
|
Memphis, TN |
7.2 |
(5.6–9.2) |
9.5 |
(7.5–12.0) |
8.4 |
(7.0–10.0) |
0.6 |
(0.3–1.2) |
1.4 |
(0.7–2.6) |
1.0 |
(0.6–1.7) |
|
Miami-Dade County, FL |
9.8 |
(8.3–11.5) |
11.8 |
(9.7–14.3) |
10.7 |
(9.3–12.3) |
2.8 |
(1.9–4.2) |
4.7 |
(3.3–6.5) |
3.7 |
(2.8–5.0) |
|
Milwaukee, WI |
14.1 |
(12.3–16.3) |
19.1 |
(16.3–22.4) |
16.9 |
(15.1–18.8) |
— |
— |
— |
— |
— |
— |
|
New York City, NY |
— |
— |
— |
— |
— |
— |
1.5 |
(1.0–2.0) |
3.4 |
(2.5–4.4) |
2.5 |
(1.9–3.2) |
|
Orange County, FL |
11.3 |
(8.9–14.4) |
13.6 |
(10.6–17.1) |
12.5 |
(10.7–14.6) |
1.3 |
(0.6–2.5) |
3.4 |
(1.9–6.0) |
2.3 |
(1.5–3.7) |
|
Palm Beach County, FL |
14.3 |
(12.0–17.0) |
13.5 |
(11.2–16.1) |
14.0 |
(12.3–15.8) |
2.5 |
(1.5–4.1) |
4.8 |
(3.3–7.0) |
3.8 |
(2.8–5.2) |
|
Philadelphia, PA |
7.2 |
(5.4–9.5) |
9.5 |
(7.4–12.2) |
8.6 |
(7.1–10.5) |
2.0 |
(1.1–3.5) |
3.4 |
(2.1–5.3) |
2.7 |
(1.8–4.0) |
|
San Bernardino, CA |
15.1 |
(12.0–18.9) |
16.4 |
(13.4–20.0) |
15.8 |
(13.5–18.4) |
1.1 |
(0.5–2.5) |
2.3 |
(1.2–4.4) |
1.7 |
(1.0–2.8) |
|
San Diego, CA |
12.6 |
(9.3–16.7) |
15.2 |
(12.4–18.5) |
13.9 |
(11.5–16.6) |
1.5 |
(0.9–2.6) |
4.1 |
(2.8–5.8) |
2.9 |
(2.1–3.9) |
|
San Francisco, CA |
9.5 |
(7.5–11.9) |
12.0 |
(9.2–15.5) |
11.4 |
(9.3–13.8) |
— |
— |
— |
— |
— |
— |
|
Seattle, WA |
— |
— |
— |
— |
— |
— |
2.5 |
(1.7–3.8) |
4.2 |
(3.0–5.9) |
3.5 |
(2.7–4.7) |
|
Median |
11.6 |
13.5 |
12.6 |
1.7 |
4.1 |
2.9 |
||||||
|
Range |
5.8–16.2 |
8.8–20.1 |
7.3–18.3 |
0.6–17.4 |
1.1–7.9 |
1.0–13.0 |
||||||
|
* Took prescription drugs (e.g., Oxycontin, Percocet, Vicodin, codeine, Adderall, Ritalin, or Xanax) without a doctor's prescription one or more times during their life. † Used a needle to inject any illegal drug into their body one or more times during their life. § 95% confidence interval. ¶ Not available. |
||||||||||||
|
TABLE 62. (Continued) Percentage of high school students who were offered, sold, or given an illegal drug by someone on school property,* by sex — selected U.S. sites, Youth Risk Behavior Survey, 2011 |
||||||
|---|---|---|---|---|---|---|
|
Site |
Female |
Male |
Total |
|||
|
% |
CI† |
% |
CI |
% |
CI |
|
|
Large urban school district surveys |
||||||
|
Boston, MA |
23.9 |
(20.1–28.1) |
29.2 |
(24.0–35.0) |
26.6 |
(24.0–29.3) |
|
Broward County, FL |
19.6 |
(16.9–22.7) |
26.0 |
(23.1–29.1) |
23.1 |
(21.1–25.1) |
|
Charlotte-Mecklenburg, NC |
32.0 |
(28.4–35.8) |
44.3 |
(40.1–48.5) |
38.3 |
(35.5–41.2) |
|
Chicago, IL |
29.2 |
(25.4–33.2) |
37.5 |
(33.8–41.4) |
33.0 |
(30.0–36.1) |
|
Dallas, TX |
32.4 |
(28.1–36.9) |
40.3 |
(35.8–44.9) |
36.4 |
(32.9–40.1) |
|
Detroit, MI |
37.8 |
(33.3–42.6) |
35.2 |
(31.5–39.0) |
36.6 |
(33.6–39.6) |
|
District of Columbia |
16.6 |
(13.5–20.2) |
28.6 |
(24.5–33.1) |
22.6 |
(19.7–25.8) |
|
Duval County, FL |
28.7 |
(26.5–31.0) |
37.3 |
(34.2–40.5) |
33.0 |
(30.9–35.1) |
|
Houston, TX |
27.2 |
(24.4–30.2) |
32.6 |
(28.9–36.6) |
29.9 |
(27.4–32.6) |
|
Los Angeles, CA |
41.4 |
(35.5–47.6) |
37.1 |
(33.3–41.0) |
39.3 |
(35.7–42.9) |
|
Memphis, TN |
10.5 |
(8.7–12.7) |
17.9 |
(15.0–21.2) |
14.3 |
(12.5–16.2) |
|
Miami-Dade County, FL |
21.3 |
(18.7–24.3) |
24.9 |
(21.4–28.7) |
23.2 |
(20.9–25.6) |
|
Milwaukee, WI |
24.4 |
(21.4–27.7) |
33.6 |
(30.0–37.4) |
29.2 |
(26.7–31.7) |
|
New York City, NY |
— |
— |
— |
— |
— |
— |
|
Orange County, FL |
17.2 |
(14.4–20.4) |
27.0 |
(23.7–30.6) |
22.0 |
(19.7–24.5) |
|
Palm Beach County, FL |
18.2 |
(16.0–20.7) |
27.4 |
(24.5–30.5) |
22.7 |
(20.7–24.9) |
|
Philadelphia, PA |
22.9 |
(19.5–26.7) |
28.6 |
(25.0–32.6) |
26.0 |
(23.5–28.6) |
|
San Bernardino, CA |
33.4 |
(30.0–37.0) |
38.7 |
(35.2–42.3) |
36.1 |
(33.6–38.7) |
|
San Diego, CA |
26.8 |
(23.5–30.5) |
37.0 |
(32.7–41.5) |
32.0 |
(28.8–35.4) |
|
San Francisco, CA |
24.0 |
(21.1–27.0) |
32.0 |
(28.7–35.5) |
28.3 |
(25.9–30.8) |
|
Seattle, WA |
23.5 |
(20.6–26.8) |
32.3 |
(29.0–35.8) |
28.2 |
(25.9–30.6) |
|
Median |
24.2 |
32.4 |
28.7 |
|||
|
Range |
10.5–41.4 |
17.9–44.3 |
14.3–39.3 |
|||
|
* During the 12 months before the survey. † 95% confidence interval. § Not available. |
||||||
| TABLE 64. (Continued) Percentage of high school students who ever had sexual intercourse and who had sexual intercourse for the first time before age 13 years, by sex — selected U.S. sites, Youth Risk Behavior Survey, 2011 |
||||||||||||
|---|---|---|---|---|---|---|---|---|---|---|---|---|
| Site |
Ever had sexual intercourse |
Had first sexual intercourse before age 13 years |
||||||||||
| Female |
Male |
Total |
Female |
Male |
Total |
|||||||
| % |
CI* |
% |
CI |
% |
CI |
% |
CI |
% |
CI |
% |
CI |
|
Large urban school district surveys |
||||||||||||
Boston, MA |
45.3 |
(39.7–51.1) |
66.1 |
(60.3–71.3) |
55.5 |
(50.6–60.3) |
4.5 |
(2.8–7.4) |
18.6 |
(13.6–24.9) |
11.4 |
(8.5–15.3) |
Broward County, FL |
41.6 |
(36.7–46.7) |
55.5 |
(50.5–60.4) |
48.8 |
(44.8–52.7) |
4.5 |
(3.1–6.6) |
12.0 |
(9.7–14.8) |
8.3 |
(6.8–10.0) |
Charlotte-Mecklenburg, NC |
46.5 |
(40.5–52.7) |
53.5 |
(47.2–59.6) |
50.0 |
(44.6–55.3) |
5.4 |
(4.0–7.3) |
12.9 |
(9.7–16.9) |
9.1 |
(7.4–11.3) |
Chicago, IL |
45.7 |
(39.5–51.9) |
60.3 |
(54.7–65.7) |
52.2 |
(46.8–57.5) |
4.2 |
(2.8–6.2) |
21.5 |
(17.7–26.0) |
11.9 |
(10.0–14.3) |
Dallas, TX |
47.4 |
(41.3–53.6) |
58.1 |
(50.1–65.7) |
52.5 |
(46.4–58.4) |
4.1 |
(2.6–6.3) |
13.7 |
(9.7–19.2) |
8.7 |
(6.5–11.4) |
Detroit, MI |
57.3 |
(51.8–62.5) |
62.6 |
(57.6–67.4) |
59.8 |
(56.3–63.2) |
3.9 |
(2.7–5.6) |
22.6 |
(18.6–27.1) |
12.5 |
(10.5–14.9) |
District of Columbia |
49.3 |
(44.1–54.5) |
61.7 |
(55.4–67.5) |
54.9 |
(50.0–59.6) |
4.6 |
(2.9–7.1) |
24.0 |
(19.8–28.7) |
13.3 |
(11.1–15.9) |
Duval County, FL |
46.8 |
(43.2–50.5) |
55.1 |
(51.2–59.1) |
50.9 |
(47.7–54.0) |
4.7 |
(3.5–6.3) |
16.3 |
(13.9–19.1) |
10.4 |
(8.9–12.0) |
Houston, TX |
46.3 |
(42.1–50.6) |
58.6 |
(54.0–63.1) |
52.3 |
(48.5–56.2) |
6.7 |
(4.6–9.6) |
14.6 |
(11.9–17.9) |
10.5 |
(8.8–12.6) |
Los Angeles, CA |
34.2 |
(28.2–40.8) |
43.2 |
(35.1–51.6) |
38.9 |
(32.4–45.7) |
2.2 |
(1.3–3.5) |
9.0 |
(6.1–13.2) |
5.7 |
(4.2–7.8) |
Memphis, TN |
55.9 |
(51.4–60.3) |
69.0 |
(64.0–73.6) |
62.2 |
(58.4–65.9) |
5.5 |
(4.1–7.4) |
26.2 |
(23.0–29.7) |
15.6 |
(13.6–17.9) |
Miami-Dade County, FL |
43.0 |
(38.9–47.1) |
52.0 |
(47.7–56.2) |
47.4 |
(43.9–50.9) |
3.0 |
(2.1–4.3) |
12.7 |
(10.0–15.9) |
7.6 |
(6.1–9.5) |
Milwaukee, WI |
54.8 |
(50.2–59.2) |
65.9 |
(60.6–70.9) |
60.2 |
(56.5–63.8) |
7.1 |
(5.3–9.3) |
22.1 |
(17.3–27.6) |
14.4 |
(12.0–17.3) |
New York City, NY |
32.1 |
(28.3–36.2) |
43.9 |
(40.6–47.3) |
37.8 |
(34.5–41.2) |
3.9 |
(3.0–4.9) |
10.5 |
(9.1–12.0) |
7.0 |
(6.0–8.1) |
Orange County, FL |
38.1 |
(32.3–44.3) |
45.4 |
(40.7–50.2) |
41.5 |
(37.2–46.0) |
4.1 |
(2.8–6.0) |
11.2 |
(9.1–13.7) |
7.6 |
(6.4–8.9) |
Palm Beach County, FL |
45.7 |
(41.2–50.3) |
50.9 |
(46.4–55.3) |
48.3 |
(44.4–52.1) |
3.8 |
(2.6–5.5) |
12.5 |
(9.8–15.7) |
8.1 |
(6.5–10.0) |
Philadelphia, PA |
55.5 |
(50.2–60.6) |
66.9 |
(60.8–72.4) |
61.0 |
(56.1–65.6) |
5.9 |
(4.1–8.4) |
25.0 |
(21.3–29.3) |
15.1 |
(13.0–17.5) |
San Bernardino, CA |
42.3 |
(35.9–49.1) |
55.2 |
(49.9–60.5) |
48.6 |
(43.6–53.6) |
1.9 |
(1.1–3.3) |
12.7 |
(10.0–15.9) |
7.2 |
(5.7–9.1) |
San Diego, CA |
38.9 |
(32.8–45.3) |
46.0 |
(39.8–52.2) |
42.5 |
(37.3–47.8) |
2.9 |
(1.8–4.6) |
9.3 |
(7.1–12.2) |
6.1 |
(4.8–7.7) |
San Francisco, CA |
26.4 |
(22.5–30.7) |
29.0 |
(24.8–33.6) |
27.8 |
(24.6–31.3) |
2.0 |
(1.2–3.3) |
7.5 |
(5.4–10.4) |
4.9 |
(3.8–6.4) |
Seattle, WA |
26.7 |
(22.7–31.1) |
32.7 |
(28.2–37.5) |
29.8 |
(26.2–33.7) |
2.4 |
(1.5–3.9) |
7.3 |
(5.3–10.0) |
5.0 |
(3.8–6.7) |
Median |
45.7 |
55.2 |
50.0 |
4.1 |
12.9 |
8.7 |
||||||
Range |
26.4–57.3 |
29.0–69.0 |
27.8–62.2 |
1.9–7.1 |
7.3–26.2 |
4.9–15.6 |
||||||
* 95% confidence interval. † Not available. |
||||||||||||
|
TABLE 66. (Continued) Percentage of high school students who had sexual intercourse with four or more persons during their life and who were currently sexually active,* by sex — selected U.S. sites, Youth Risk Behavior Survey, 2011 |
||||||||||||
|---|---|---|---|---|---|---|---|---|---|---|---|---|
|
Site |
Had sexual intercourse with four or more persons during their life |
Currently sexually active |
||||||||||
|
Female |
Male |
Total |
Female |
Male |
Total |
|||||||
|
% |
CI† |
% |
CI |
% |
CI |
% |
CI |
% |
CI |
% |
CI |
|
|
Large urban school district surveys |
||||||||||||
|
Boston, MA |
13.1 |
(10.1–16.9) |
31.6 |
(26.6–37.1) |
22.2 |
(18.9–25.9) |
30.4 |
(25.5–35.9) |
41.3 |
(34.4–48.5) |
35.8 |
(30.9–41.0) |
|
Broward County, FL |
10.4 |
(7.8–13.6) |
23.2 |
(19.8–27.0) |
16.8 |
(14.5–19.3) |
29.9 |
(25.3–34.9) |
36.7 |
(32.7–41.0) |
33.6 |
(30.4–37.1) |
|
Charlotte-Mecklenburg, NC |
15.1 |
(11.9–19.1) |
24.2 |
(19.2–30.1) |
19.7 |
(16.3–23.7) |
34.4 |
(29.1–40.1) |
34.5 |
(29.7–39.6) |
34.6 |
(30.3–39.1) |
|
Chicago, IL |
10.5 |
(7.9–13.9) |
26.3 |
(21.8–31.3) |
17.5 |
(14.4–21.2) |
33.4 |
(28.7–38.6) |
43.3 |
(38.5–48.2) |
37.8 |
(33.8–41.9) |
|
Dallas, TX |
11.2 |
(8.1–15.2) |
23.4 |
(19.0–28.5) |
17.0 |
(13.7–20.8) |
33.5 |
(28.7–38.7) |
35.4 |
(29.7–41.5) |
34.4 |
(30.3–38.8) |
|
Detroit, MI |
11.8 |
(9.9–14.1) |
30.1 |
(25.8–34.8) |
20.3 |
(17.9–23.1) |
31.8 |
(27.2–36.8) |
38.3 |
(33.3–43.7) |
34.8 |
(31.3–38.6) |
|
District of Columbia |
15.4 |
(12.6–18.8) |
34.5 |
(28.6–41.0) |
23.9 |
(20.6–27.6) |
36.8 |
(32.5–41.4) |
49.3 |
(43.5–55.1) |
42.3 |
(38.3–46.5) |
|
Duval County, FL |
11.8 |
(9.8–14.2) |
26.7 |
(23.6–30.1) |
19.0 |
(16.9–21.4) |
34.9 |
(31.8–38.1) |
38.6 |
(34.8–42.5) |
36.7 |
(33.9–39.6) |
|
Houston, TX |
10.5 |
(7.9–13.8) |
24.4 |
(20.8–28.5) |
17.3 |
(14.5–20.4) |
32.9 |
(28.7–37.4) |
38.0 |
(34.1–42.2) |
35.4 |
(31.9–39.1) |
|
Los Angeles, CA |
5.3 |
(3.4–8.2) |
12.8 |
(9.1–17.7) |
9.2 |
(6.8–12.3) |
24.5 |
(19.3–30.4) |
26.6 |
(20.0–34.5) |
25.7 |
(20.1–32.1) |
|
Memphis, TN |
14.1 |
(11.2–17.6) |
37.1 |
(32.8–41.5) |
25.3 |
(22.3–28.6) |
37.0 |
(32.2–42.2) |
46.0 |
(41.1–51.0) |
41.4 |
(37.5–45.4) |
|
Miami-Dade County, FL |
9.3 |
(7.4–11.6) |
24.0 |
(20.3–28.1) |
16.4 |
(14.2–18.9) |
30.2 |
(26.3–34.5) |
35.6 |
(32.0–39.5) |
32.8 |
(29.7–36.1) |
|
Milwaukee, WI |
16.0 |
(12.6–20.0) |
32.1 |
(27.6–37.0) |
23.6 |
(20.7–26.9) |
39.1 |
(35.1–43.3) |
47.9 |
(43.2–52.5) |
43.2 |
(39.7–46.8) |
|
New York City, NY |
7.1 |
(5.6–8.9) |
18.2 |
(16.1–20.5) |
12.3 |
(10.7–14.2) |
22.5 |
(19.5–25.9) |
27.8 |
(25.0–30.8) |
25.1 |
(22.6–27.7) |
|
Orange County, FL |
11.6 |
(8.5–15.8) |
16.9 |
(13.4–21.3) |
14.2 |
(11.9–16.8) |
28.7 |
(23.9–34.0) |
30.3 |
(25.9–35.1) |
29.3 |
(25.7–33.2) |
|
Palm Beach County, FL |
12.0 |
(9.8–14.6) |
21.5 |
(18.3–25.0) |
16.7 |
(14.4–19.1) |
35.5 |
(31.4–39.9) |
35.3 |
(31.3–39.5) |
35.4 |
(32.2–38.7) |
|
Philadelphia, PA |
16.7 |
(13.6–20.4) |
39.0 |
(34.0–44.3) |
27.2 |
(23.9–30.8) |
41.0 |
(36.0–46.3) |
49.0 |
(43.5–54.5) |
44.9 |
(40.4–49.6) |
|
San Bernardino, CA |
7.8 |
(5.3–11.1) |
20.8 |
(17.4–24.8) |
14.1 |
(11.9–16.7) |
29.1 |
(23.9–34.9) |
37.3 |
(32.4–42.6) |
33.1 |
(29.0–37.5) |
|
San Diego, CA |
8.8 |
(6.1–12.4) |
14.9 |
(11.9–18.4) |
11.9 |
(9.7–14.5) |
26.3 |
(21.5–31.6) |
29.4 |
(25.5–33.5) |
27.8 |
(24.1–31.9) |
|
San Francisco, CA |
4.4 |
(3.1–6.2) |
9.6 |
(7.4–12.4) |
7.0 |
(5.8–8.4) |
19.7 |
(16.3–23.5) |
19.1 |
(15.6–23.0) |
19.5 |
(16.9–22.3) |
|
Seattle, WA |
5.3 |
(4.0–7.1) |
9.1 |
(7.0–11.8) |
7.3 |
(5.9–9.1) |
20.1 |
(16.6–24.2) |
21.6 |
(18.0–25.8) |
21.0 |
(18.1–24.1) |
|
Median |
11.2 |
24.0 |
17.0 |
31.8 |
36.7 |
34.6 |
||||||
|
Range |
4.4–16.7 |
9.1–39.0 |
7.0–27.2 |
19.7–41.0 |
19.1–49.3 |
19.5–44.9 |
||||||
|
* Had sexual intercourse with at least one person during the 3 months before the survey. † 95% confidence interval. § Not available. |
||||||||||||
| TABLE 68. (Continued) Percentage of high school students who used a condom during last sexual intercourse* and who used birth control pills before last sexual intercourse,*,† by sex — selected U.S. sites, Youth Risk Behavior Survey, 2011 |
||||||||||||
|---|---|---|---|---|---|---|---|---|---|---|---|---|
| Site |
Condom use |
Birth control pill use |
||||||||||
| Female |
Male |
Total |
Female |
Male |
Total |
|||||||
| % |
CI§ |
% |
CI |
% |
CI |
% |
CI |
% |
CI |
% |
CI |
|
Large urban school district surveys |
||||||||||||
Boston, MA |
53.0 |
(43.0–62.8) |
78.0 |
(69.9–84.5) |
67.0 |
(58.9–74.3) |
20.9 |
(13.8–30.3) |
12.7 |
(7.9–19.7) |
16.4 |
(12.3–21.4) |
Broward County, FL |
66.1 |
(59.0–72.6) |
76.3 |
(69.0–82.3) |
71.2 |
(66.4–75.6) |
8.2 |
(4.8–13.7) |
7.8 |
(4.0–14.9) |
7.9 |
(5.1–11.9) |
Charlotte-Mecklenburg, NC |
52.7 |
(45.1–60.1) |
70.7 |
(64.9–75.8) |
61.3 |
(56.3–66.0) |
16.4 |
(11.3–23.2) |
8.6 |
(5.8–12.6) |
12.9 |
(10.0–16.5) |
Chicago, IL |
59.8 |
(51.5–67.5) |
69.2 |
(63.8–74.1) |
64.3 |
(59.4–69.0) |
12.8 |
(9.0–17.8) |
10.9 |
(7.4–15.8) |
11.8 |
(9.1–15.2) |
Dallas, TX |
45.6 |
(36.3–55.3) |
66.0 |
(58.9–72.4) |
55.5 |
(49.7–61.1) |
6.1 |
(3.4–10.6) |
5.7 |
(2.8–11.3) |
5.9 |
(3.7–9.1) |
Detroit, MI |
54.8 |
(48.2–61.3) |
75.0 |
(69.6–79.8) |
64.8 |
(60.2–69.1) |
10.5 |
(7.4–14.8) |
8.3 |
(4.6–14.6) |
9.4 |
(6.7–13.1) |
District of Columbia |
67.7 |
(59.9–74.6) |
81.8 |
(76.1–86.4) |
75.1 |
(70.4–79.2) |
7.6 |
(4.6–12.5) |
5.3 |
(3.0–9.1) |
6.4 |
(4.3–9.4) |
Duval County, FL |
53.1 |
(47.7–58.5) |
65.5 |
(60.5–70.3) |
59.2 |
(55.4–63.0) |
14.9 |
(11.4–19.4) |
12.1 |
(9.1–15.9) |
13.6 |
(11.2–16.5) |
Houston, TX |
50.4 |
(42.4–58.5) |
67.7 |
(60.7–74.0) |
59.5 |
(54.7–64.0) |
6.9 |
(4.1–11.2) |
9.3 |
(6.0–14.3) |
8.1 |
(5.9–11.1) |
Los Angeles, CA |
57.7 |
(45.8–68.8) |
64.0 |
(52.8–73.9) |
61.1 |
(55.2–66.7) |
7.2 |
(3.7–13.7) |
9.5 |
(5.1–16.9) |
8.4 |
(5.4–12.8) |
Memphis, TN |
65.2 |
(58.4–71.4) |
78.1 |
(72.6–82.8) |
72.1 |
(67.8–76.1) |
13.3 |
(8.9–19.3) |
4.8 |
(2.7–8.4) |
8.8 |
(6.3–12.2) |
Miami-Dade County, FL |
60.8 |
(53.3–67.8) |
75.7 |
(70.1–80.5) |
68.3 |
(62.7–73.4) |
8.3 |
(4.8–14.0) |
4.0 |
(2.0–7.7) |
6.1 |
(4.0–9.1) |
Milwaukee, WI |
53.1 |
(47.8–58.3) |
75.6 |
(70.6–79.9) |
65.2 |
(61.3–68.8) |
13.4 |
(9.6–18.4) |
7.9 |
(5.7–10.8) |
10.5 |
(8.4–13.0) |
New York City, NY |
59.6 |
(54.7–64.4) |
70.8 |
(66.3–75.0) |
65.4 |
(61.4–69.2) |
10.4 |
(8.2–13.1) |
8.4 |
(6.7–10.4) |
9.3 |
(7.8–11.2) |
Orange County, FL |
59.6 |
(52.0–66.8) |
73.0 |
(66.1–78.9) |
66.4 |
(61.3–71.1) |
12.9 |
(7.9–20.3) |
13.9 |
(9.7–19.3) |
13.4 |
(10.1–17.5) |
Palm Beach County, FL |
60.1 |
(54.0–66.0) |
66.4 |
(60.0–72.2) |
63.2 |
(58.5–67.5) |
23.6 |
(19.4–28.4) |
19.0 |
(14.0–25.2) |
21.3 |
(18.1–24.9) |
Philadelphia, PA |
50.4 |
(43.7–57.1) |
69.0 |
(61.3–75.8) |
59.6 |
(54.2–64.8) |
19.5 |
(14.9–25.0) |
10.3 |
(7.1–14.7) |
14.8 |
(12.1–18.0) |
San Bernardino, CA |
42.5 |
(34.4–51.0) |
67.0 |
(59.3–73.9) |
55.9 |
(49.5–62.2) |
9.0 |
(5.9–13.5) |
6.9 |
(4.4–10.5) |
7.8 |
(5.8–10.4) |
San Diego, CA |
50.1 |
(41.6–58.6) |
65.9 |
(57.2–73.7) |
58.6 |
(52.2–64.7) |
24.9 |
(17.2–34.5) |
17.1 |
(10.6–26.2) |
20.7 |
(14.8–28.0) |
San Francisco, CA |
47.3 |
(38.8–56.0) |
60.4 |
(51.3–68.9) |
52.9 |
(47.7–58.1) |
17.2 |
(11.4–25.2) |
5.6 |
(2.9–10.6) |
11.5 |
(8.2–16.0) |
Seattle, WA |
58.3 |
(48.6–67.5) |
57.1 |
(46.5–67.0) |
57.6 |
(51.1–63.8) |
32.9 |
(24.8–42.1) |
23.3 |
(15.4–33.7) |
27.6 |
(22.3–33.6) |
Median |
54.8 |
69.2 |
63.2 |
12.9 |
8.6 |
10.5 |
||||||
Range |
42.5–67.7 |
57.1–81.8 |
52.9–75.1 |
6.1–32.9 |
4.0–23.3 |
5.9–27.6 |
||||||
* Among students who were currently sexually active. † To prevent pregnancy. § 95% confidence interval. ¶ Not available. |
||||||||||||
|
TABLE 70. (Continued) Percentage of high school students who used Depo-Provera,* Nuva Ring,† Implanon,§ or any IUD before last sexual intercourse¶,** and who used birth control pills, Depo-Provera,* Nuva Ring,† Implanon,§ or any IUD before last sexual intercourse,¶,** by sex — selected U.S. sites, Youth Risk Behavior Survey, 2011 |
||||||||||||
|---|---|---|---|---|---|---|---|---|---|---|---|---|
|
Site |
Depo-Provera, Nuva Ring, Implanon, or any IUD use |
Birth control pill, Depo-Provera, Nuva Ring, Implanon, or any IUD use |
||||||||||
|
Female |
Male |
Total |
Female |
Male |
Total |
|||||||
|
% |
CI†† |
% |
CI |
% |
CI |
% |
CI |
% |
CI |
% |
CI |
|
|
Large urban school district surveys |
||||||||||||
|
Boston, MA |
15.1 |
(8.6–25.2) |
2.3 |
(0.8–6.1) |
7.7 |
(4.5–12.8) |
36.0 |
(27.1–46.0) |
14.9 |
(9.7–22.2) |
24.0 |
(18.9–30.1) |
|
Broward County, FL |
1.9 |
(0.6–5.8) |
1.5 |
(0.4–5.7) |
2.2 |
(1.0–4.7) |
10.1 |
(5.8–17.2) |
9.3 |
(5.1–16.4) |
10.1 |
(6.4–15.5) |
|
Charlotte-Mecklenburg, NC |
8.1 |
(4.7–13.6) |
2.0 |
(0.8–4.9) |
5.1 |
(3.4–7.6) |
24.5 |
(17.5–33.2) |
10.7 |
(7.5–14.9) |
18.0 |
(14.2–22.5) |
|
Chicago, IL |
10.4 |
(6.7–15.8) |
3.2 |
(1.5–6.9) |
6.8 |
(4.7–9.6) |
23.2 |
(18.0–29.3) |
14.1 |
(10.0–19.5) |
18.6 |
(15.5–22.2) |
|
Dallas, TX |
8.7 |
(5.4–13.8) |
1.1 |
(0.3–3.4) |
5.1 |
(3.2–8.0) |
14.8 |
(10.0–21.3) |
6.8 |
(3.7–12.2) |
10.9 |
(7.9–14.9) |
|
Detroit, MI |
10.0 |
(6.7–14.7) |
1.3 |
(0.5–3.6) |
5.7 |
(3.9–8.3) |
20.6 |
(15.7–26.4) |
9.7 |
(5.8–15.6) |
15.1 |
(11.6–19.5) |
|
District of Columbia |
11.1 |
(7.9–15.5) |
3.4 |
(1.6–7.4) |
7.1 |
(4.9–10.2) |
18.8 |
(14.4–24.1) |
8.7 |
(5.5–13.5) |
13.5 |
(10.3–17.5) |
|
Duval County, FL |
10.1 |
(7.2–13.9) |
2.2 |
(1.2–4.3) |
6.1 |
(4.5–8.3) |
25.0 |
(20.7–29.9) |
14.3 |
(11.0–18.5) |
19.7 |
(16.8–23.1) |
|
Houston, TX |
6.2 |
(3.3–11.6) |
2.0 |
(0.8–4.7) |
4.0 |
(2.4–6.7) |
13.1 |
(9.0–18.8) |
11.3 |
(7.6–16.6) |
12.2 |
(9.4–15.6) |
|
Los Angeles, CA |
3.8 |
(1.7–8.4) |
1.3 |
(0.5–3.4) |
2.5 |
(1.3–4.7) |
11.1 |
(6.2–19.1) |
10.8 |
(6.0–18.8) |
10.9 |
(7.2–16.2) |
|
Memphis, TN |
5.8 |
(3.4–9.6) |
0.2 |
(0.0–1.5) |
2.8 |
(1.7–4.5) |
19.0 |
(13.6–26.0) |
5.0 |
(2.8–8.6) |
11.6 |
(8.7–15.2) |
|
Miami-Dade County, FL |
1.0 |
(0.3–3.1) |
1.0 |
(0.3–4.1) |
1.0 |
(0.4–2.9) |
9.4 |
(5.7–15.0) |
5.0 |
(2.7–9.0) |
7.1 |
(4.9–10.3) |
|
Milwaukee, WI |
15.7 |
(11.5–21.1) |
4.8 |
(2.8–8.2) |
9.9 |
(7.3–13.4) |
29.1 |
(23.2–35.9) |
12.7 |
(9.5–16.8) |
20.4 |
(16.7–24.7) |
|
New York City, NY |
5.5 |
(3.9–7.8) |
1.7 |
(1.0–2.8) |
3.5 |
(2.6–4.8) |
15.9 |
(13.3–18.9) |
10.1 |
(8.1–12.4) |
12.9 |
(11.1–14.9) |
|
Orange County, FL |
4.7 |
(2.3–9.4) |
1.6 |
(0.5–5.2) |
3.1 |
(1.6–6.2) |
17.6 |
(11.0–26.9) |
15.5 |
(11.2–21.0) |
16.5 |
(12.5–21.5) |
|
Palm Beach County, FL |
2.5 |
(1.2–5.0) |
1.2 |
(0.4–4.0) |
1.9 |
(1.0–3.4) |
26.1 |
(21.4–31.3) |
20.2 |
(15.0–26.7) |
23.2 |
(19.8–26.9) |
|
Philadelphia, PA |
11.5 |
(8.0–16.3) |
1.5 |
(0.6–4.2) |
6.5 |
(4.5–9.2) |
31.0 |
(25.3–37.3) |
11.8 |
(8.0–17.1) |
21.2 |
(17.5–25.5) |
|
San Bernardino, CA |
4.2 |
(2.2–8.2) |
3.1 |
(1.6–6.0) |
3.6 |
(2.3–5.7) |
13.2 |
(9.8–17.6) |
10.0 |
(6.8–14.5) |
11.4 |
(8.9–14.5) |
|
San Diego, CA |
3.9 |
(1.6–9.2) |
2.7 |
(1.1–6.3) |
3.2 |
(1.6–6.6) |
28.8 |
(21.2–37.8) |
19.7 |
(12.8–29.1) |
23.9 |
(17.9–31.2) |
|
San Francisco, CA |
20.5 |
(15.1–27.2) |
8.4 |
(4.1–16.5) |
14.9 |
(11.2–19.6) |
37.7 |
(30.4–45.6) |
14.1 |
(8.7–22.0) |
26.5 |
(22.1–31.4) |
|
Seattle, WA |
10.2 |
(5.8–17.4) |
7.4 |
(4.2–13.0) |
8.7 |
(5.7–13.1) |
43.1 |
(33.9–52.7) |
30.7 |
(21.3–42.2) |
36.3 |
(29.9–43.2) |
|
Median |
8.1 |
2.0 |
5.1 |
20.6 |
11.3 |
16.5 |
||||||
|
Range |
1.0–20.5 |
0.2–8.4 |
1.0–14.9 |
9.4–43.1 |
5.0–30.7 |
7.1–36.3 |
||||||
|
* Or any injectable birth control. † Or any birth control ring. § Or any implant. ¶ Among students who were currently sexually active. ** To prevent pregnancy. †† 95% confidence interval. §§ Not available. |
||||||||||||
| TABLE 72. (Continued) Percentage of high school students who used both a condom during last sexual intercourse* and birth control pills, Depo-Provera,† Nuva Ring,§ Implanon,¶ or any IUD before last sexual intercourse*,** and who did not use any method to prevent pregnancy during last sexual intercourse,* by sex — selected U.S. sites, Youth Risk Behavior Survey, 2011 |
||||||||||||
|---|---|---|---|---|---|---|---|---|---|---|---|---|
| Site |
Condom use and birth control pill, Depo-Provera, Nuva Ring, Implanon, or any IUD use |
Did not use any method to prevent pregnancy |
||||||||||
| Female |
Male |
Total |
Female |
Male |
Total |
|||||||
| % |
CI†† |
% |
CI |
% |
CI |
% |
CI |
% |
CI |
% |
CI |
|
Large urban school district surveys |
||||||||||||
Boston, MA |
10.7 |
(6.2–17.7) |
7.3 |
(3.8–13.4) |
8.7 |
(5.4–13.7) |
19.2 |
(12.0–29.3) |
9.8 |
(5.4–17.2) |
13.8 |
(9.1–20.3) |
Broward County, FL |
3.8 |
(1.8–7.8) |
3.9 |
(1.9–7.7) |
3.8 |
(2.4–6.0) |
14.3 |
(10.1–19.8) |
7.0 |
(4.4–11.0) |
10.3 |
(7.7–13.6) |
Charlotte-Mecklenburg, NC |
7.0 |
(4.2–11.6) |
3.9 |
(2.3–6.7) |
5.5 |
(3.6–8.4) |
18.7 |
(13.2–25.8) |
9.8 |
(6.8–13.8) |
14.5 |
(11.3–18.4) |
Chicago, IL |
11.2 |
(7.2–17.0) |
7.5 |
(4.3–12.8) |
9.3 |
(6.7–12.9) |
19.2 |
(14.2–25.5) |
15.2 |
(9.9–22.5) |
17.3 |
(13.1–22.5) |
Dallas, TX |
2.7 |
(1.1–6.4) |
1.8 |
(0.6–4.9) |
2.2 |
(1.1–4.5) |
32.5 |
(24.9–41.2) |
16.9 |
(12.1–23.1) |
25.0 |
(20.4–30.3) |
Detroit, MI |
6.7 |
(4.4–10.1) |
5.0 |
(2.1–11.2) |
5.8 |
(3.8–8.9) |
20.7 |
(16.8–25.3) |
18.1 |
(13.6–23.7) |
19.4 |
(16.2–23.1) |
District of Columbia |
8.9 |
(5.5–13.9) |
5.6 |
(3.0–10.5) |
7.2 |
(4.7–10.8) |
15.6 |
(10.9–21.8) |
11.3 |
(7.7–16.3) |
13.4 |
(10.0–17.6) |
Duval County, FL |
8.8 |
(6.5–11.9) |
6.5 |
(4.5–9.4) |
7.7 |
(6.1–9.6) |
16.4 |
(12.9–20.7) |
14.0 |
(10.7–18.1) |
15.2 |
(12.7–18.1) |
Houston, TX |
2.8 |
(1.3–6.0) |
8.5 |
(5.2–13.5) |
5.7 |
(3.8–8.5) |
27.8 |
(21.6–35.0) |
20.6 |
(15.4–26.9) |
24.0 |
(20.4–28.1) |
Los Angeles, CA |
3.2 |
(1.6–6.4) |
3.6 |
(1.0–12.4) |
3.4 |
(1.5–7.6) |
24.5 |
(15.3–36.7) |
18.0 |
(11.3–27.2) |
20.8 |
(16.7–25.8) |
Memphis, TN |
9.8 |
(5.9–15.9) |
2.2 |
(1.0–5.0) |
5.9 |
(4.0–8.7) |
16.4 |
(12.6–21.0) |
9.2 |
(5.9–14.0) |
12.5 |
(9.8–15.8) |
Miami-Dade County, FL |
3.6 |
(1.9–7.0) |
3.5 |
(1.6–7.6) |
3.5 |
(2.0–6.2) |
19.6 |
(15.3–24.8) |
12.5 |
(8.6–18.0) |
15.9 |
(12.9–19.4) |
Milwaukee, WI |
11.3 |
(7.8–16.0) |
5.0 |
(2.9–8.2) |
7.9 |
(5.8–10.7) |
18.1 |
(13.9–23.3) |
13.1 |
(9.2–18.3) |
15.4 |
(12.6–18.8) |
New York City, NY |
6.2 |
(4.3–8.9) |
3.5 |
(2.6–4.8) |
4.8 |
(3.6–6.4) |
14.1 |
(11.9–16.6) |
14.0 |
(11.1–17.5) |
14.2 |
(12.4–16.1) |
Orange County, FL |
7.9 |
(4.1–14.8) |
8.4 |
(5.4–12.8) |
8.2 |
(5.6–11.8) |
14.7 |
(9.8–21.4) |
7.7 |
(4.6–12.6) |
11.1 |
(8.1–15.1) |
Palm Beach County, FL |
10.8 |
(7.9–14.4) |
9.0 |
(5.8–13.8) |
9.9 |
(7.8–12.6) |
12.4 |
(9.1–16.8) |
9.6 |
(6.2–14.6) |
11.2 |
(8.7–14.2) |
Philadelphia, PA |
11.8 |
(8.2–16.8) |
5.9 |
(3.0–11.5) |
8.9 |
(6.1–12.7) |
21.8 |
(16.9–27.8) |
20.1 |
(15.2–26.1) |
21.2 |
(17.3–25.7) |
San Bernardino, CA |
2.4 |
(1.0–5.8) |
3.8 |
(1.8–7.8) |
3.2 |
(1.7–5.6) |
26.3 |
(19.4–34.7) |
13.3 |
(8.8–19.6) |
19.3 |
(14.7–24.9) |
San Diego, CA |
8.6 |
(4.8–15.2) |
5.2 |
(2.9–9.2) |
6.8 |
(4.5–10.1) |
17.8 |
(12.2–25.2) |
12.9 |
(8.3–19.5) |
15.2 |
(11.0–20.5) |
San Francisco, CA |
8.2 |
(4.2–15.3) |
2.8 |
(1.0–7.5) |
5.6 |
(3.2–9.6) |
17.0 |
(10.3–26.8) |
16.9 |
(10.8–25.5) |
17.2 |
(12.5–23.3) |
Seattle, WA |
18.4 |
(12.3–26.6) |
7.5 |
(3.6–14.9) |
12.6 |
(9.0–17.2) |
14.0 |
(7.4–24.9) |
11.2 |
(6.6–18.3) |
12.8 |
(8.6–18.7) |
Median |
8.2 |
5.0 |
5.9 |
18.1 |
13.1 |
15.2 |
||||||
Range |
2.4–18.4 |
1.8–9.0 |
2.2–12.6 |
12.4–32.5 |
7.0–20.6 |
10.3–25.0 |
||||||
* Among students who were currently sexually active. † Or any injectable birth control. § Or any birth control ring. ¶ Or any implant. ** To prevent pregnancy. †† 95% confidence interval. §§ Not available. |
||||||||||||
|
TABLE 74. (Continued) Percentage of high school students who drank alcohol or used drugs before last sexual intercourse* and who were ever taught in school about acquired immunodeficiency syndrome (AIDS) or human immunodeficiency virus (HIV) infection, by sex — selected U.S. sites, Youth Risk Behavior Survey, 2011 |
||||||||||||
|---|---|---|---|---|---|---|---|---|---|---|---|---|
|
Site |
Drank alcohol or used drugs before last sexual intercourse |
Were taught in school about AIDS or HIV infection |
||||||||||
|
Female |
Male |
Total |
Female |
Male |
Total |
|||||||
|
% |
CI† |
% |
CI |
% |
CI |
% |
CI |
% |
CI |
% |
CI |
|
|
Large urban school district surveys |
||||||||||||
|
Boston, MA |
17.7 |
(10.9–27.4) |
29.3 |
(19.8–41.0) |
24.3 |
(17.0–33.4) |
73.4 |
(68.2–78.1) |
73.2 |
(67.7–78.0) |
73.3 |
(69.3–76.9) |
|
Broward County, FL |
18.7 |
(14.3–24.0) |
25.7 |
(20.7–31.4) |
22.4 |
(18.6–26.8) |
88.1 |
(84.4–91.0) |
86.7 |
(84.0–88.9) |
87.3 |
(84.8–89.4) |
|
Charlotte-Mecklenburg, NC |
25.8 |
(20.9–31.5) |
25.5 |
(20.4–31.3) |
26.0 |
(22.1–30.4) |
85.9 |
(82.4–88.9) |
82.9 |
(78.6–86.4) |
84.3 |
(81.2–87.0) |
|
Chicago, IL |
16.5 |
(12.9–20.9) |
25.8 |
(20.3–32.3) |
21.3 |
(17.3–25.9) |
75.0 |
(70.2–79.2) |
71.0 |
(66.7–74.9) |
72.9 |
(69.1–76.4) |
|
Dallas, TX |
12.3 |
(7.9–18.8) |
21.7 |
(15.7–29.3) |
16.9 |
(12.3–22.8) |
82.2 |
(77.9–85.8) |
79.7 |
(75.1–83.6) |
80.9 |
(77.6–83.9) |
|
Detroit, MI |
9.2 |
(5.9–14.0) |
23.0 |
(16.6–31.0) |
16.2 |
(12.4–20.8) |
82.7 |
(79.3–85.7) |
79.0 |
(75.7–82.0) |
80.8 |
(78.2–83.1) |
|
District of Columbia |
19.7 |
(14.2–26.8) |
25.8 |
(20.9–31.4) |
22.9 |
(19.0–27.2) |
85.6 |
(82.1–88.5) |
82.6 |
(77.5–86.8) |
83.8 |
(80.6–86.6) |
|
Duval County, FL |
19.1 |
(15.5–23.3) |
27.7 |
(23.0–32.9) |
23.5 |
(20.3–27.0) |
82.4 |
(80.2–84.5) |
80.3 |
(77.7–82.6) |
81.3 |
(79.4–83.1) |
|
Houston, TX |
10.5 |
(7.4–14.7) |
26.1 |
(20.5–32.5) |
18.5 |
(15.1–22.6) |
75.9 |
(72.6–78.9) |
73.2 |
(69.8–76.3) |
74.6 |
(72.0–77.0) |
|
Los Angeles, CA |
13.1 |
(8.0–20.6) |
22.0 |
(13.2–34.5) |
18.1 |
(12.1–26.2) |
84.2 |
(80.1–87.6) |
79.9 |
(74.6–84.4) |
82.0 |
(77.8–85.5) |
|
Memphis, TN |
9.7 |
(6.9–13.7) |
18.9 |
(15.0–23.5) |
14.6 |
(12.2–17.5) |
78.6 |
(75.2–81.7) |
75.7 |
(72.2–79.0) |
77.2 |
(74.7–79.5) |
|
Miami-Dade County, FL |
15.6 |
(12.1–19.8) |
30.0 |
(24.1–36.6) |
22.9 |
(19.4–26.9) |
79.3 |
(76.4–82.0) |
76.3 |
(72.2–80.0) |
77.9 |
(75.2–80.4) |
|
Milwaukee, WI |
16.7 |
(12.5–21.9) |
24.9 |
(19.5–31.2) |
20.9 |
(17.4–24.9) |
83.8 |
(80.4–86.6) |
79.9 |
(76.6–82.9) |
81.7 |
(79.0–84.0) |
|
New York City, NY |
15.2 |
(12.9–17.8) |
23.2 |
(19.9–26.7) |
19.2 |
(17.0–21.7) |
— |
— |
— |
— |
— |
— |
|
Orange County, FL |
23.7 |
(18.1–30.5) |
27.3 |
(20.8–34.9) |
25.6 |
(21.2–30.5) |
88.3 |
(85.2–90.8) |
85.1 |
(80.7–88.6) |
86.6 |
(84.4–88.6) |
|
Palm Beach County, FL |
23.4 |
(18.9–28.7) |
31.0 |
(25.5–37.1) |
27.0 |
(23.6–30.7) |
87.5 |
(84.8–89.8) |
83.8 |
(80.7–86.4) |
85.5 |
(83.2–87.4) |
|
Philadelphia, PA |
15.0 |
(11.3–19.6) |
21.0 |
(15.6–27.6) |
18.2 |
(14.6–22.4) |
83.0 |
(79.0–86.4) |
80.5 |
(76.7–83.9) |
81.8 |
(78.9–84.5) |
|
San Bernardino, CA |
14.3 |
(8.6–23.0) |
26.5 |
(19.8–34.4) |
21.0 |
(16.3–26.6) |
80.5 |
(76.5–84.0) |
79.1 |
(74.4–83.1) |
79.8 |
(76.2–83.0) |
|
San Diego, CA |
15.7 |
(10.7–22.6) |
27.4 |
(21.1–34.8) |
21.9 |
(17.4–27.2) |
87.0 |
(82.9–90.3) |
85.4 |
(81.4–88.6) |
86.1 |
(83.0–88.7) |
|
San Francisco, CA |
14.8 |
(10.1–21.3) |
27.4 |
(20.7–35.2) |
21.0 |
(16.4–26.4) |
84.4 |
(80.8–87.5) |
78.0 |
(74.0–81.6) |
81.1 |
(78.0–83.8) |
|
Seattle, WA |
— |
— |
— |
— |
— |
— |
87.5 |
(84.4–90.1) |
85.3 |
(81.9–88.2) |
86.2 |
(83.7–88.4) |
|
Median |
15.6 |
25.8 |
21.1 |
83.4 |
79.9 |
81.5 |
||||||
|
Range |
9.2–25.8 |
18.9–31.0 |
14.6–27.0 |
73.4–88.3 |
71.0–86.7 |
72.9–87.3 |
||||||
|
* Among students who were currently sexually active. † 95% confidence interval. § Not available. |
||||||||||||
| TABLE 77. (Continued) Percentage of high school students who did not eat fruit or drink 100% fruit juices* and who ate fruit or drank 100% fruit juices one or more times/day,* by sex — selected U.S. sites, Youth Risk Behavior Survey, 2011 |
||||||||||||
|---|---|---|---|---|---|---|---|---|---|---|---|---|
| Site |
Did not eat fruit or drink 100% fruit juices |
Ate fruit or drank 100% fruit juices one or more times/day |
||||||||||
| Female |
Male |
Total |
Female |
Male |
Total |
|||||||
| % |
CI† |
% |
CI |
% |
CI |
% |
CI |
% |
CI |
% |
CI |
|
Large urban school district surveys |
||||||||||||
Boston, MA |
6.1 |
(4.2–8.7) |
6.5 |
(4.2–9.9) |
6.3 |
(4.6–8.4) |
51.4 |
(47.2–55.6) |
62.1 |
(55.5–68.2) |
56.4 |
(52.5–60.3) |
Broward County, FL |
6.9 |
(5.2–9.1) |
6.4 |
(4.7–8.6) |
6.7 |
(5.4–8.4) |
61.4 |
(57.8–64.8) |
67.2 |
(63.5–70.7) |
64.4 |
(61.9–66.8) |
Charlotte-Mecklenburg, NC |
7.1 |
(5.3–9.3) |
7.1 |
(5.6–8.9) |
7.1 |
(5.8–8.6) |
58.7 |
(54.2–63.0) |
65.8 |
(62.3–69.1) |
62.3 |
(59.5–64.9) |
Chicago, IL |
6.2 |
(4.8–7.9) |
8.4 |
(6.4–11.0) |
7.2 |
(5.9–8.7) |
57.9 |
(53.7–62.0) |
62.4 |
(58.7–66.0) |
60.1 |
(57.1–63.0) |
Dallas, TX |
5.0 |
(3.2–7.8) |
5.2 |
(3.6–7.6) |
5.1 |
(3.7–6.9) |
61.5 |
(56.6–66.1) |
61.6 |
(56.3–66.7) |
61.6 |
(58.0–65.0) |
Detroit, MI |
7.0 |
(5.5–8.8) |
8.2 |
(6.0–11.0) |
7.5 |
(6.2–9.0) |
47.8 |
(43.0–52.6) |
46.1 |
(41.6–50.7) |
47.1 |
(43.5–50.8) |
District of Columbia |
6.8 |
(4.8–9.6) |
7.4 |
(5.4–10.1) |
7.2 |
(5.8–9.0) |
60.7 |
(56.1–65.1) |
61.9 |
(57.6–66.0) |
60.9 |
(57.6–64.0) |
Duval County, FL |
8.3 |
(7.0–9.9) |
11.1 |
(9.1–13.5) |
9.7 |
(8.4–11.1) |
53.6 |
(50.7–56.5) |
54.1 |
(50.9–57.2) |
53.9 |
(51.6–56.1) |
Houston, TX |
6.2 |
(4.7–8.0) |
7.6 |
(6.0–9.7) |
6.9 |
(5.7–8.3) |
57.4 |
(54.2–60.6) |
61.2 |
(58.4–64.0) |
59.3 |
(57.2–61.4) |
Los Angeles, CA |
4.3 |
(2.6–7.0) |
5.4 |
(3.3–8.6) |
4.8 |
(3.5–6.7) |
65.1 |
(57.2–72.3) |
66.5 |
(62.1–70.7) |
66.0 |
(60.8–70.8) |
Memphis, TN |
5.8 |
(4.2–7.8) |
6.8 |
(5.0–9.2) |
6.3 |
(5.1–7.7) |
62.5 |
(58.5–66.4) |
65.3 |
(61.3–69.1) |
63.9 |
(60.9–66.8) |
Miami-Dade County, FL |
6.5 |
(5.1–8.3) |
7.1 |
(5.5–9.2) |
6.9 |
(5.6–8.4) |
57.6 |
(53.9–61.2) |
66.2 |
(62.7–69.6) |
61.8 |
(59.3–64.2) |
Milwaukee, WI |
6.0 |
(4.5–8.0) |
6.4 |
(4.7–8.7) |
6.2 |
(5.0–7.6) |
60.6 |
(57.0–64.0) |
63.7 |
(60.4–66.9) |
62.1 |
(59.6–64.6) |
New York City, NY |
5.0 |
(4.3–5.9) |
8.4 |
(7.2–9.9) |
6.7 |
(6.0–7.4) |
57.8 |
(55.8–59.7) |
60.4 |
(57.8–62.8) |
59.0 |
(57.2–60.8) |
Orange County, FL |
5.6 |
(4.0–7.7) |
8.0 |
(5.6–11.4) |
6.9 |
(5.4–8.8) |
57.1 |
(52.6–61.5) |
66.0 |
(61.6–70.0) |
61.4 |
(58.6–64.2) |
Palm Beach County, FL |
5.7 |
(4.4–7.3) |
7.6 |
(5.6–10.2) |
6.6 |
(5.3–8.2) |
62.7 |
(59.1–66.1) |
66.3 |
(63.0–69.4) |
64.5 |
(62.2–66.8) |
Philadelphia, PA |
6.2 |
(4.6–8.3) |
7.8 |
(5.6–10.6) |
7.0 |
(5.4–9.0) |
53.4 |
(49.5–57.3) |
56.4 |
(51.0–61.7) |
54.9 |
(51.4–58.2) |
San Bernardino, CA |
3.3 |
(2.0–5.5) |
4.0 |
(2.5–6.6) |
3.8 |
(2.8–5.3) |
65.3 |
(62.1–68.4) |
71.8 |
(68.2–75.2) |
68.4 |
(65.9–70.9) |
San Diego, CA |
4.0 |
(2.8–5.9) |
6.0 |
(4.0–8.8) |
5.1 |
(3.9–6.6) |
61.6 |
(57.1–65.8) |
65.0 |
(61.4–68.5) |
63.3 |
(60.2–66.2) |
San Francisco, CA |
4.4 |
(3.0–6.4) |
7.3 |
(5.7–9.4) |
5.8 |
(4.7–7.3) |
63.5 |
(59.7–67.2) |
61.7 |
(58.0–65.2) |
62.6 |
(60.3–64.9) |
Seattle, WA |
3.9 |
(2.6–5.7) |
4.8 |
(3.1–7.3) |
4.4 |
(3.4–5.8) |
69.2 |
(65.3–72.9) |
67.9 |
(63.6–71.8) |
68.4 |
(65.4–71.3) |
Median |
6.0 |
7.1 |
6.7 |
60.6 |
63.7 |
61.8 |
||||||
Range |
3.3–8.3 |
4.0–11.1 |
3.8–9.7 |
47.8–69.2 |
46.1–71.8 |
47.1–68.4 |
||||||
* During the 7 days before the survey. † 95% confidence interval. § Not available. |
||||||||||||
|
TABLE 79. (Continued) Percentage of high school students who ate fruit or drank 100% fruit juices, by sex — selected U.S. sites, Youth Risk Behavior Survey, 2011 |
||||||||||||
|---|---|---|---|---|---|---|---|---|---|---|---|---|
|
Site |
Ate fruit or drank 100% fruit juices two or more times/day* |
Ate fruit or drank 100% fruit juices three or more times/day* |
||||||||||
|
Female |
Male |
Total |
Female |
Male |
Total |
|||||||
|
% |
CI† |
% |
CI |
% |
CI |
% |
CI |
% |
CI |
% |
CI |
|
|
Large urban school district surveys |
||||||||||||
|
Boston, MA |
25.2 |
(21.9–28.8) |
36.1 |
(31.0–41.6) |
30.4 |
(27.4–33.6) |
18.5 |
(15.5–22.0) |
29.9 |
(25.0–35.4) |
24.0 |
(20.9–27.4) |
|
Broward County, FL |
33.6 |
(30.3–37.2) |
41.6 |
(38.3–45.0) |
37.7 |
(35.2–40.2) |
22.0 |
(18.9–25.5) |
31.1 |
(27.8–34.7) |
26.5 |
(24.1–29.1) |
|
Charlotte-Mecklenburg, NC |
34.0 |
(31.2–36.9) |
39.0 |
(35.4–42.7) |
36.5 |
(34.4–38.7) |
23.6 |
(20.9–26.4) |
26.5 |
(23.3–29.9) |
25.0 |
(23.0–27.2) |
|
Chicago, IL |
30.8 |
(27.8–34.0) |
34.8 |
(30.5–39.3) |
32.5 |
(29.5–35.7) |
23.0 |
(20.4–25.7) |
26.3 |
(22.0–31.1) |
24.4 |
(21.6–27.4) |
|
Dallas, TX |
31.4 |
(28.1–34.9) |
33.1 |
(27.5–39.1) |
32.3 |
(28.8–35.9) |
21.0 |
(18.2–24.2) |
24.1 |
(19.8–29.1) |
22.6 |
(20.0–25.4) |
|
Detroit, MI |
26.1 |
(23.1–29.2) |
27.1 |
(23.8–30.6) |
26.6 |
(24.4–29.0) |
18.4 |
(16.2–20.9) |
20.7 |
(17.6–24.1) |
19.6 |
(17.6–21.7) |
|
District of Columbia |
34.6 |
(30.4–39.0) |
35.1 |
(30.6–39.9) |
34.7 |
(31.5–37.9) |
25.3 |
(21.8–29.2) |
26.8 |
(22.2–32.0) |
25.9 |
(22.7–29.3) |
|
Duval County, FL |
25.7 |
(23.3–28.3) |
29.8 |
(27.2–32.6) |
27.7 |
(25.9–29.6) |
18.4 |
(16.3–20.7) |
21.4 |
(19.1–24.0) |
19.9 |
(18.3–21.5) |
|
Houston, TX |
28.2 |
(25.5–31.1) |
34.1 |
(30.8–37.6) |
31.2 |
(28.8–33.6) |
19.0 |
(16.3–22.0) |
24.7 |
(21.7–27.9) |
21.8 |
(19.7–24.2) |
|
Los Angeles, CA |
35.4 |
(30.3–40.8) |
38.6 |
(34.5–42.9) |
37.2 |
(33.6–40.9) |
24.9 |
(21.3–28.9) |
26.7 |
(22.9–31.0) |
25.9 |
(22.8–29.4) |
|
Memphis, TN |
34.6 |
(30.9–38.4) |
43.9 |
(39.6–48.3) |
39.2 |
(36.1–42.4) |
23.7 |
(20.4–27.3) |
32.5 |
(29.0–36.3) |
28.0 |
(25.2–31.0) |
|
Miami-Dade County, FL |
32.3 |
(28.9–36.0) |
41.4 |
(38.0–44.9) |
36.8 |
(34.4–39.2) |
22.2 |
(19.1–25.5) |
31.8 |
(28.8–35.0) |
26.9 |
(24.8–29.2) |
|
Milwaukee, WI |
32.7 |
(29.2–36.3) |
37.5 |
(34.7–40.5) |
35.2 |
(33.1–37.3) |
25.1 |
(21.8–28.6) |
29.1 |
(26.5–32.0) |
27.1 |
(25.3–29.1) |
|
New York City, NY |
32.8 |
(30.9–34.7) |
35.3 |
(33.4–37.4) |
33.9 |
(32.5–35.4) |
21.9 |
(20.5–23.4) |
26.3 |
(24.3–28.4) |
24.0 |
(22.6–25.4) |
|
Orange County, FL |
30.8 |
(27.3–34.6) |
38.5 |
(34.7–42.3) |
34.6 |
(31.7–37.6) |
20.3 |
(17.3–23.6) |
29.0 |
(25.2–33.1) |
24.5 |
(21.9–27.3) |
|
Palm Beach County, FL |
35.4 |
(32.8–38.0) |
37.7 |
(34.2–41.2) |
36.6 |
(34.4–38.9) |
25.7 |
(23.5–28.1) |
26.2 |
(23.2–29.4) |
26.0 |
(24.1–28.1) |
|
Philadelphia, PA |
25.8 |
(22.1–29.9) |
30.4 |
(26.4–34.9) |
28.0 |
(24.9–31.3) |
19.2 |
(15.9–22.9) |
22.5 |
(18.8–26.6) |
20.6 |
(18.2–23.3) |
|
San Bernardino, CA |
38.0 |
(34.3–41.9) |
40.7 |
(36.5–45.1) |
39.2 |
(36.4–42.2) |
28.0 |
(24.4–32.0) |
31.3 |
(27.5–35.3) |
29.6 |
(26.8–32.5) |
|
San Diego, CA |
31.7 |
(27.7–36.1) |
36.5 |
(32.1–41.1) |
34.1 |
(30.6–37.8) |
19.8 |
(16.8–23.3) |
23.3 |
(19.5–27.6) |
21.6 |
(18.8–24.7) |
|
San Francisco, CA |
34.7 |
(31.1–38.5) |
33.9 |
(30.8–37.2) |
34.3 |
(32.1–36.5) |
20.0 |
(17.0–23.2) |
22.2 |
(19.4–25.2) |
21.2 |
(19.3–23.1) |
|
Seattle, WA |
34.3 |
(30.9–37.9) |
33.8 |
(29.7–38.1) |
34.1 |
(31.2–37.0) |
19.8 |
(17.2–22.7) |
23.0 |
(19.7–26.6) |
21.3 |
(19.1–23.7) |
|
Median |
32.7 |
36.1 |
34.3 |
21.9 |
26.3 |
24.4 |
||||||
|
Range |
25.2–38.0 |
27.1–43.9 |
26.6–39.2 |
18.4–28.0 |
20.7–32.5 |
19.6–29.6 |
||||||
|
* During the 7 days before the survey. † 95% confidence interval. § Not available. |
||||||||||||
|
TABLE 81. (Continued) Percentage of high school students who did not eat vegetables*,† and who ate vegetables* one or more times/day,† by sex — selected U.S. sites, Youth Risk Behavior Survey, 2011 |
||||||||||||
|---|---|---|---|---|---|---|---|---|---|---|---|---|
|
Site |
Did not eat vegetables |
Ate vegetables one or more times/day |
||||||||||
|
Female |
Male |
Total |
Female |
Male |
Total |
|||||||
|
% |
CI§ |
% |
CI |
% |
CI |
% |
CI |
% |
CI |
% |
CI |
|
|
Large urban school district surveys |
||||||||||||
|
Boston, MA |
9.3 |
(6.3–13.7) |
11.3 |
(7.4–16.9) |
10.3 |
(7.7–13.5) |
44.8 |
(39.4–50.4) |
47.1 |
(40.7–53.6) |
45.9 |
(42.5–49.4) |
|
Broward County, FL |
10.1 |
(7.8–12.9) |
10.2 |
(8.0–12.9) |
10.2 |
(8.4–12.3) |
57.4 |
(53.3–61.3) |
59.5 |
(56.4–62.6) |
58.6 |
(55.8–61.4) |
|
Charlotte-Mecklenburg, NC |
6.6 |
(4.7–9.2) |
7.7 |
(6.0–9.9) |
7.1 |
(5.8–8.8) |
59.3 |
(55.7–62.7) |
60.9 |
(56.6–65.0) |
60.3 |
(57.5–63.1) |
|
Chicago, IL |
11.2 |
(9.2–13.6) |
14.0 |
(12.0–16.3) |
12.4 |
(10.9–14.1) |
48.3 |
(44.2–52.4) |
49.1 |
(46.3–52.0) |
48.9 |
(46.1–51.7) |
|
Dallas, TX |
9.6 |
(7.0–13.1) |
10.2 |
(7.9–13.1) |
9.9 |
(8.2–11.9) |
48.0 |
(43.5–52.6) |
48.9 |
(43.7–54.1) |
48.4 |
(44.7–52.2) |
|
Detroit, MI |
7.5 |
(6.0–9.4) |
8.9 |
(6.8–11.4) |
8.2 |
(6.9–9.7) |
58.7 |
(55.2–62.2) |
60.7 |
(56.5–64.8) |
59.8 |
(56.8–62.8) |
|
District of Columbia |
6.2 |
(4.2–9.1) |
10.7 |
(7.8–14.4) |
8.5 |
(6.6–10.7) |
54.5 |
(50.8–58.2) |
55.7 |
(51.2–60.1) |
55.1 |
(52.1–58.0) |
|
Duval County, FL |
7.2 |
(5.8–8.8) |
10.5 |
(8.9–12.5) |
8.8 |
(7.8–10.0) |
54.7 |
(51.8–57.6) |
57.5 |
(54.5–60.5) |
56.2 |
(53.9–58.4) |
|
Houston, TX |
9.8 |
(8.2–11.7) |
13.8 |
(12.2–15.6) |
11.8 |
(10.6–13.2) |
51.1 |
(47.5–54.7) |
52.3 |
(48.8–55.8) |
51.8 |
(49.0–54.6) |
|
Los Angeles, CA |
7.1 |
(5.2–9.7) |
8.1 |
(6.0–10.8) |
7.6 |
(6.0–9.5) |
49.8 |
(41.9–57.7) |
55.9 |
(52.0–59.6) |
53.2 |
(48.2–58.0) |
|
Memphis, TN |
12.2 |
(9.9–15.0) |
12.9 |
(10.2–16.1) |
12.5 |
(10.7–14.5) |
47.0 |
(43.1–51.0) |
49.8 |
(45.9–53.7) |
48.4 |
(45.9–50.9) |
|
Miami-Dade County, FL |
9.3 |
(7.4–11.7) |
13.4 |
(11.3–15.8) |
11.3 |
(9.6–13.3) |
50.7 |
(46.9–54.5) |
55.0 |
(51.6–58.3) |
52.7 |
(50.2–55.2) |
|
Milwaukee, WI |
— |
— |
— |
— |
— |
— |
— |
— |
— |
— |
— |
— |
|
New York City, NY |
— |
— |
— |
— |
— |
— |
— |
— |
— |
— |
— |
— |
|
Orange County, FL |
7.8 |
(5.2–11.5) |
9.3 |
(7.0–12.2) |
8.6 |
(6.7–10.9) |
58.5 |
(54.0–62.9) |
60.8 |
(56.7–64.8) |
59.6 |
(56.4–62.7) |
|
Palm Beach County, FL |
7.4 |
(5.8–9.5) |
10.1 |
(7.8–13.0) |
8.8 |
(7.2–10.6) |
60.3 |
(57.4–63.1) |
59.7 |
(56.2–63.1) |
60.0 |
(57.7–62.3) |
|
Philadelphia, PA |
7.9 |
(6.0–10.4) |
10.0 |
(7.6–12.9) |
8.8 |
(7.2–10.8) |
49.6 |
(45.5–53.7) |
48.1 |
(44.1–52.2) |
49.1 |
(46.1–52.2) |
|
San Bernardino, CA |
9.6 |
(7.1–12.8) |
9.4 |
(6.8–12.9) |
9.6 |
(7.9–11.6) |
52.9 |
(48.9–56.9) |
57.2 |
(52.9–61.3) |
55.0 |
(52.0–58.0) |
|
San Diego, CA |
5.5 |
(3.8–7.8) |
10.2 |
(7.8–13.2) |
7.9 |
(6.5–9.6) |
57.4 |
(53.6–61.2) |
58.7 |
(55.5–61.9) |
58.1 |
(55.5–60.5) |
|
San Francisco, CA |
4.8 |
(3.3–7.0) |
6.8 |
(5.2–8.9) |
5.8 |
(4.8–7.1) |
69.0 |
(65.0–72.7) |
68.9 |
(64.9–72.5) |
69.1 |
(66.4–71.7) |
|
Seattle, WA |
4.0 |
(2.6–6.3) |
5.4 |
(4.1–7.2) |
4.9 |
(3.9–6.2) |
67.0 |
(63.5–70.4) |
68.9 |
(64.3–73.2) |
67.8 |
(64.8–70.7) |
|
Median |
7.8 |
10.2 |
8.8 |
54.5 |
57.2 |
55.1 |
||||||
|
Range |
4.0–12.2 |
5.4–14.0 |
4.9–12.5 |
44.8–69.0 |
47.1–68.9 |
45.9–69.1 |
||||||
|
* Green salad, potatoes (excluding French fries, fried potatoes, or potato chips), carrots, or other vegetables. † During the 7 days before the survey. § 95% confidence interval. ¶ Not available. |
||||||||||||
|
TABLE 83. (Continued) Percentage of high school students who ate vegetables, by sex — selected U.S. sites, Youth Risk Behavior Survey, 2011 |
||||||||||||
|---|---|---|---|---|---|---|---|---|---|---|---|---|
|
Site |
Ate vegetables two or more times/day*,† |
Ate vegetables three or more times/day*,† |
||||||||||
|
Female |
Male |
Total |
Female |
Male |
Total |
|||||||
|
% |
CI§ |
% |
CI |
% |
CI |
% |
CI |
% |
CI |
% |
CI |
|
|
Large urban school district surveys |
||||||||||||
|
Boston, MA |
16.1 |
(13.1–19.6) |
24.6 |
(19.8–30.1) |
20.1 |
(17.4–23.0) |
7.8 |
(5.1–11.6) |
16.0 |
(12.2–20.7) |
11.6 |
(9.5–14.2) |
|
Broward County, FL |
25.9 |
(22.7–29.4) |
31.5 |
(28.5–34.8) |
29.0 |
(26.6–31.5) |
13.7 |
(11.2–16.6) |
17.1 |
(14.7–19.7) |
15.5 |
(13.7–17.4) |
|
Charlotte-Mecklenburg, NC |
25.1 |
(22.0–28.4) |
27.7 |
(24.6–30.9) |
26.5 |
(24.3–28.9) |
13.5 |
(10.9–16.6) |
12.8 |
(10.7–15.2) |
13.4 |
(11.6–15.3) |
|
Chicago, IL |
21.3 |
(17.8–25.3) |
23.2 |
(20.2–26.5) |
22.2 |
(19.4–25.3) |
13.1 |
(10.5–16.3) |
14.9 |
(12.5–17.7) |
14.1 |
(11.9–16.5) |
|
Dallas, TX |
19.0 |
(16.3–22.0) |
19.7 |
(16.2–23.8) |
19.3 |
(16.8–22.0) |
9.9 |
(7.9–12.4) |
10.6 |
(8.0–13.8) |
10.2 |
(8.5–12.2) |
|
Detroit, MI |
19.1 |
(15.9–22.7) |
30.7 |
(26.4–35.5) |
24.6 |
(21.8–27.7) |
8.1 |
(6.2–10.5) |
10.2 |
(8.1–12.7) |
9.1 |
(7.7–10.8) |
|
District of Columbia |
25.4 |
(22.1–29.0) |
28.8 |
(24.3–33.8) |
27.0 |
(23.9–30.2) |
15.9 |
(13.1–19.2) |
15.8 |
(12.9–19.2) |
15.8 |
(13.8–18.1) |
|
Duval County, FL |
22.2 |
(20.0–24.7) |
26.6 |
(23.8–29.6) |
24.4 |
(22.6–26.4) |
11.3 |
(9.8–13.1) |
14.3 |
(12.2–16.7) |
12.9 |
(11.5–14.4) |
|
Houston, TX |
23.6 |
(20.6–26.9) |
25.6 |
(22.2–29.3) |
24.8 |
(22.4–27.3) |
12.0 |
(10.1–14.1) |
14.9 |
(12.5–17.7) |
13.5 |
(12.1–15.2) |
|
Los Angeles, CA |
21.4 |
(17.0–26.5) |
24.1 |
(19.5–29.4) |
22.9 |
(18.7–27.7) |
12.0 |
(9.3–15.5) |
13.4 |
(10.4–17.1) |
12.9 |
(10.5–15.8) |
|
Memphis, TN |
19.6 |
(16.3–23.5) |
27.7 |
(24.5–31.3) |
23.7 |
(21.3–26.3) |
10.7 |
(8.3–13.8) |
18.2 |
(15.5–21.3) |
14.5 |
(12.5–16.8) |
|
Miami-Dade County, FL |
25.2 |
(21.7–29.1) |
28.3 |
(25.6–31.1) |
26.8 |
(24.7–29.0) |
16.1 |
(13.3–19.3) |
18.3 |
(16.1–20.8) |
17.3 |
(15.6–19.2) |
|
Milwaukee, WI |
— |
— |
— |
— |
— |
— |
— |
— |
— |
— |
— |
— |
|
New York City, NY |
— |
— |
— |
— |
— |
— |
— |
— |
— |
— |
— |
— |
|
Orange County, FL |
23.7 |
(20.5–27.2) |
29.2 |
(25.0–33.8) |
26.5 |
(23.8–29.4) |
12.9 |
(10.5–15.7) |
18.5 |
(14.7–23.0) |
15.8 |
(13.5–18.5) |
|
Palm Beach County, FL |
31.4 |
(28.4–34.6) |
29.3 |
(26.4–32.3) |
30.5 |
(28.3–32.8) |
17.9 |
(15.4–20.7) |
18.9 |
(16.1–22.1) |
18.5 |
(16.5–20.7) |
|
Philadelphia, PA |
21.8 |
(18.4–25.6) |
19.1 |
(15.6–23.3) |
20.8 |
(18.1–23.8) |
13.5 |
(11.2–16.2) |
10.6 |
(7.9–14.0) |
12.3 |
(10.4–14.4) |
|
San Bernardino, CA |
26.8 |
(22.9–31.1) |
30.6 |
(26.9–34.5) |
28.6 |
(25.7–31.7) |
14.4 |
(11.9–17.2) |
18.7 |
(15.4–22.4) |
16.5 |
(14.3–19.0) |
|
San Diego, CA |
26.3 |
(22.3–30.8) |
24.9 |
(21.6–28.6) |
25.6 |
(23.0–28.4) |
13.5 |
(10.9–16.7) |
12.6 |
(10.0–15.7) |
13.0 |
(11.2–15.2) |
|
San Francisco, CA |
34.5 |
(31.4–37.8) |
34.8 |
(31.5–38.2) |
34.9 |
(32.6–37.2) |
18.1 |
(15.6–20.9) |
17.9 |
(15.2–21.0) |
18.4 |
(16.7–20.4) |
|
Seattle, WA |
32.1 |
(28.7–35.8) |
35.6 |
(32.1–39.3) |
34.1 |
(31.5–36.8) |
14.1 |
(11.9–16.6) |
16.7 |
(14.2–19.6) |
15.6 |
(13.8–17.6) |
|
Median |
23.7 |
27.7 |
25.6 |
13.5 |
15.8 |
14.1 |
||||||
|
Range |
16.1–34.5 |
19.1–35.6 |
19.3–34.9 |
7.8–18.1 |
10.2–18.9 |
9.1–18.5 |
||||||
|
* Green salad, potatoes (excluding French fries, fried potatoes, or potato chips), carrots, or other vegetables. † During the 7 days before the survey. § 95% confidence interval. ¶ Not available. |
||||||||||||
|
TABLE 87. (Continued) Percentage of high school students who did not drink soda or pop*,† and who drank soda or pop one or more times/day,*,† by sex — selected U.S. sites, Youth Risk Behavior Survey, 2011 |
||||||||||||
|---|---|---|---|---|---|---|---|---|---|---|---|---|
|
Site |
Did not drink soda or pop |
Drank soda or pop one or more times/day |
||||||||||
|
Female |
Male |
Total |
Female |
Male |
Total |
|||||||
|
% |
CI§ |
% |
CI |
% |
CI |
% |
CI |
% |
CI |
% |
CI |
|
|
Large urban school district surveys |
||||||||||||
|
Boston, MA |
19.4 |
(14.6–25.3) |
17.6 |
(13.5–22.6) |
18.6 |
(15.4–22.2) |
19.7 |
(15.3–25.0) |
28.6 |
(23.2–34.7) |
24.0 |
(20.0–28.6) |
|
Broward County, FL |
26.3 |
(23.3–29.5) |
22.0 |
(18.7–25.7) |
24.2 |
(22.1–26.5) |
23.1 |
(20.0–26.4) |
25.6 |
(22.6–28.9) |
24.4 |
(22.1–26.8) |
|
Charlotte-Mecklenburg, NC |
— |
— |
— |
— |
— |
— |
— |
— |
— |
— |
— |
— |
|
Chicago, IL |
14.9 |
(12.2–18.1) |
20.7 |
(18.0–23.6) |
17.9 |
(15.7–20.3) |
28.8 |
(26.0–31.8) |
30.1 |
(25.7–34.9) |
29.4 |
(26.9–32.0) |
|
Dallas, TX |
17.4 |
(13.8–21.7) |
14.4 |
(11.6–17.8) |
16.0 |
(13.8–18.6) |
22.3 |
(18.5–26.6) |
31.9 |
(26.1–38.2) |
27.0 |
(23.4–31.0) |
|
Detroit, MI |
21.3 |
(18.1–24.9) |
18.9 |
(15.6–22.7) |
20.1 |
(17.7–22.8) |
19.7 |
(16.7–23.1) |
23.3 |
(19.4–27.7) |
21.4 |
(18.7–24.4) |
|
District of Columbia |
25.3 |
(21.6–29.4) |
20.8 |
(17.4–24.7) |
23.5 |
(20.8–26.5) |
24.2 |
(21.0–27.6) |
23.8 |
(19.7–28.3) |
23.9 |
(21.3–26.7) |
|
Duval County, FL |
20.2 |
(18.0–22.7) |
21.7 |
(19.2–24.3) |
20.9 |
(19.2–22.8) |
24.4 |
(21.7–27.2) |
27.8 |
(25.5–30.3) |
26.1 |
(24.2–28.1) |
|
Houston, TX |
20.2 |
(17.0–23.8) |
20.0 |
(17.0–23.5) |
20.1 |
(17.7–22.6) |
25.3 |
(21.9–28.9) |
28.0 |
(25.2–31.0) |
26.6 |
(24.6–28.7) |
|
Los Angeles, CA |
25.7 |
(22.4–29.3) |
18.9 |
(15.4–22.9) |
22.1 |
(19.4–25.0) |
17.3 |
(14.5–20.6) |
24.8 |
(20.7–29.5) |
21.3 |
(18.3–24.7) |
|
Memphis, TN |
12.8 |
(10.6–15.3) |
13.9 |
(11.4–16.9) |
13.4 |
(11.5–15.4) |
37.0 |
(33.5–40.8) |
40.8 |
(36.7–45.1) |
38.9 |
(36.1–41.9) |
|
Miami-Dade County, FL |
24.6 |
(21.2–28.3) |
21.4 |
(18.7–24.4) |
23.3 |
(20.8–26.0) |
23.1 |
(20.1–26.4) |
29.9 |
(26.4–33.6) |
26.4 |
(24.0–28.9) |
|
Milwaukee, WI |
21.4 |
(18.7–24.5) |
20.2 |
(16.8–24.1) |
20.8 |
(18.4–23.5) |
27.7 |
(24.3–31.5) |
26.5 |
(23.5–29.7) |
27.1 |
(24.9–29.5) |
|
New York City, NY |
26.7 |
(23.8–29.8) |
25.4 |
(23.0–28.0) |
26.1 |
(23.9–28.6) |
18.5 |
(16.7–20.6) |
23.5 |
(20.9–26.3) |
20.9 |
(19.0–23.1) |
|
Orange County, FL |
26.0 |
(22.8–29.4) |
17.4 |
(14.2–21.2) |
21.8 |
(19.2–24.7) |
19.2 |
(15.9–23.1) |
26.5 |
(23.5–29.8) |
22.8 |
(20.6–25.3) |
|
Palm Beach County, FL |
24.2 |
(21.7–26.9) |
22.8 |
(19.7–26.3) |
23.5 |
(21.6–25.6) |
22.2 |
(19.4–25.2) |
26.9 |
(24.0–29.9) |
24.6 |
(22.3–27.1) |
|
Philadelphia, PA |
20.9 |
(17.9–24.3) |
19.6 |
(16.2–23.7) |
20.2 |
(18.0–22.7) |
23.7 |
(20.7–27.0) |
26.3 |
(22.0–31.0) |
25.0 |
(22.3–27.9) |
|
San Bernardino, CA |
20.8 |
(17.6–24.5) |
15.0 |
(12.0–18.6) |
17.9 |
(15.8–20.2) |
26.7 |
(23.3–30.3) |
35.0 |
(30.3–39.9) |
30.8 |
(27.6–34.1) |
|
San Diego, CA |
24.6 |
(21.9–27.4) |
19.8 |
(17.1–22.9) |
22.2 |
(20.1–24.6) |
14.0 |
(11.5–17.1) |
22.0 |
(18.3–26.3) |
18.1 |
(15.4–21.2) |
|
San Francisco, CA |
— |
— |
— |
— |
— |
— |
— |
— |
— |
— |
— |
— |
|
Seattle, WA |
37.1 |
(33.5–40.9) |
27.4 |
(24.5–30.4) |
32.2 |
(29.9–34.6) |
9.4 |
(7.5–11.8) |
15.5 |
(13.0–18.3) |
12.7 |
(11.1–14.4) |
|
Median |
21.4 |
20.0 |
20.9 |
23.1 |
26.5 |
24.6 |
||||||
|
Range |
12.8–37.1 |
13.9–27.4 |
13.4–32.2 |
9.4–37.0 |
15.5–40.8 |
12.7–38.9 |
||||||
|
* A can, bottle, or glass of soda or pop, not counting diet soda or diet pop. † During the 7 days before the survey. § 95% confidence interval. ¶ Not available. |
||||||||||||
|
TABLE 89. (Continued) Percentage of high school students who drank soda or pop, by sex — selected U.S. sites, Youth Risk Behavior Survey, 2011 |
||||||||||||
|---|---|---|---|---|---|---|---|---|---|---|---|---|
|
Site |
Drank soda or pop two or more times/day*,† |
Drank soda or pop three or more times/day*,† |
||||||||||
|
Female |
Male |
Total |
Female |
Male |
Total |
|||||||
|
% |
CI§ |
% |
CI |
% |
CI |
% |
CI |
% |
CI |
% |
CI |
|
|
Large urban school district surveys |
||||||||||||
|
Boston, MA |
15.8 |
(12.0–20.6) |
20.2 |
(17.0–23.8) |
17.9 |
(15.3–20.9) |
9.5 |
(6.6–13.3) |
14.8 |
(12.0–18.0) |
12.1 |
(9.7–14.8) |
|
Broward County, FL |
15.9 |
(13.2–18.9) |
18.5 |
(16.0–21.2) |
17.2 |
(15.2–19.4) |
9.3 |
(7.0–12.2) |
11.2 |
(9.1–13.6) |
10.3 |
(8.6–12.2) |
|
Charlotte-Mecklenburg, NC |
— |
— |
— |
— |
— |
— |
— |
— |
— |
— |
— |
— |
|
Chicago, IL |
23.5 |
(20.8–26.4) |
22.4 |
(18.7–26.6) |
22.9 |
(20.8–25.2) |
13.9 |
(11.4–16.9) |
14.1 |
(11.0–17.8) |
14.0 |
(11.9–16.4) |
|
Dallas, TX |
14.0 |
(10.8–17.8) |
19.6 |
(15.2–24.8) |
16.8 |
(13.7–20.4) |
7.8 |
(5.8–10.4) |
7.8 |
(4.9–12.3) |
7.9 |
(6.0–10.2) |
|
Detroit, MI |
16.1 |
(13.4–19.2) |
17.5 |
(14.4–21.0) |
16.6 |
(14.4–19.0) |
9.5 |
(7.7–11.8) |
10.8 |
(8.7–13.3) |
10.0 |
(8.6–11.7) |
|
District of Columbia |
18.5 |
(15.5–22.0) |
18.7 |
(15.1–22.9) |
18.6 |
(16.2–21.2) |
12.3 |
(10.1–15.0) |
11.2 |
(8.6–14.5) |
11.8 |
(9.9–14.0) |
|
Duval County, FL |
17.3 |
(15.2–19.7) |
20.3 |
(18.2–22.7) |
18.8 |
(17.2–20.6) |
10.6 |
(9.0–12.5) |
13.6 |
(11.6–15.8) |
12.0 |
(10.8–13.5) |
|
Houston, TX |
16.5 |
(13.6–19.8) |
19.5 |
(17.2–22.0) |
18.0 |
(16.3–19.8) |
9.4 |
(7.1–12.5) |
9.8 |
(8.1–11.9) |
9.6 |
(8.1–11.4) |
|
Los Angeles, CA |
11.7 |
(8.7–15.5) |
14.8 |
(10.6–20.2) |
13.3 |
(10.3–17.1) |
5.5 |
(4.2–7.2) |
8.9 |
(6.1–12.8) |
7.3 |
(5.7–9.4) |
|
Memphis, TN |
29.6 |
(25.9–33.5) |
33.5 |
(29.7–37.5) |
31.5 |
(28.6–34.5) |
18.8 |
(15.7–22.4) |
22.1 |
(19.0–25.5) |
20.4 |
(18.0–22.9) |
|
Miami-Dade County, FL |
18.3 |
(15.6–21.4) |
21.7 |
(18.5–25.2) |
19.9 |
(18.0–22.0) |
10.8 |
(8.6–13.5) |
15.0 |
(12.3–18.2) |
12.9 |
(11.1–14.8) |
|
Milwaukee, WI |
23.1 |
(19.9–26.6) |
20.1 |
(17.3–23.3) |
21.6 |
(19.4–24.0) |
14.9 |
(12.0–18.3) |
13.5 |
(11.0–16.4) |
14.2 |
(12.0–16.6) |
|
New York City, NY |
13.4 |
(11.9–15.0) |
16.3 |
(14.2–18.6) |
14.8 |
(13.1–16.6) |
8.7 |
(7.5–10.1) |
9.4 |
(8.2–10.7) |
9.0 |
(8.0–10.1) |
|
Orange County, FL |
13.7 |
(10.7–17.4) |
19.6 |
(16.7–22.8) |
16.6 |
(14.5–18.9) |
8.2 |
(6.1–10.9) |
14.0 |
(11.3–17.2) |
11.0 |
(9.3–13.1) |
|
Palm Beach County, FL |
15.9 |
(13.4–18.7) |
18.3 |
(15.7–21.2) |
17.2 |
(15.1–19.5) |
9.3 |
(7.6–11.3) |
9.8 |
(8.0–11.9) |
9.7 |
(8.3–11.3) |
|
Philadelphia, PA |
16.7 |
(13.7–20.2) |
19.4 |
(15.5–23.9) |
18.0 |
(15.4–20.8) |
10.2 |
(8.1–12.8) |
11.9 |
(9.5–14.9) |
11.0 |
(9.3–12.8) |
|
San Bernardino, CA |
19.0 |
(16.0–22.4) |
25.7 |
(21.9–30.0) |
22.3 |
(19.5–25.4) |
11.0 |
(8.9–13.6) |
16.7 |
(13.4–20.7) |
13.9 |
(11.6–16.5) |
|
San Diego, CA |
9.0 |
(6.7–11.9) |
14.7 |
(11.5–18.6) |
11.9 |
(9.7–14.5) |
5.1 |
(3.7–7.1) |
7.9 |
(5.7–10.8) |
6.5 |
(5.1–8.4) |
|
San Francisco, CA |
— |
— |
— |
— |
— |
— |
— |
— |
— |
— |
— |
— |
|
Seattle, WA |
5.5 |
(4.1–7.5) |
10.2 |
(8.0–12.8) |
8.1 |
(6.8–9.7) |
3.0 |
(1.9–4.7) |
5.9 |
(4.5–7.8) |
4.7 |
(3.7–6.0) |
|
Median |
16.1 |
19.5 |
17.9 |
9.5 |
11.2 |
11.0 |
||||||
|
Range |
5.5–29.6 |
10.2–33.5 |
8.1–31.5 |
3.0–18.8 |
5.9–22.1 |
4.7–20.4 |
||||||
|
* A can, bottle, or glass of soda or pop, not counting diet soda or diet pop. † During the 7 days before the survey. § 95% confidence interval. ¶ Not available. |
||||||||||||
|
TABLE 92. (Continued) Percentage of high school students who did not participate in at least 60 minutes of physical activity on any day*,† and were physically active at least 60 minutes/day on 5 or more days,†,§ by sex — selected U.S. sites, Youth Risk Behavior Survey, 2011 |
||||||||||||
|---|---|---|---|---|---|---|---|---|---|---|---|---|
|
Site |
Did not participate in at least 60 minutes of physical activity on any day |
Physically active at least 60 minutes/day on 5 or more days |
||||||||||
|
Female |
Male |
Total |
Female |
Male |
Total |
|||||||
|
% |
CI¶ |
% |
CI |
% |
CI |
% |
CI |
% |
CI |
% |
CI |
|
|
Large urban school district surveys |
||||||||||||
|
Boston, MA |
27.9 |
(23.5–32.7) |
21.2 |
(17.2–25.8) |
24.7 |
(21.4–28.2) |
19.3 |
(15.4–23.8) |
39.2 |
(34.8–43.8) |
29.1 |
(26.0–32.4) |
|
Broward County, FL |
26.2 |
(22.5–30.4) |
14.3 |
(11.8–17.2) |
20.2 |
(17.6–23.1) |
28.9 |
(25.4–32.6) |
54.3 |
(50.9–57.6) |
41.9 |
(39.2–44.7) |
|
Charlotte-Mecklenburg, NC |
26.0 |
(22.2–30.3) |
12.4 |
(9.8–15.4) |
19.1 |
(16.5–22.0) |
28.2 |
(25.1–31.5) |
51.9 |
(47.0–56.8) |
39.9 |
(36.7–43.2) |
|
Chicago, IL |
21.5 |
(17.8–25.7) |
19.9 |
(16.8–23.3) |
20.6 |
(18.0–23.6) |
30.0 |
(23.7–37.1) |
39.5 |
(34.9–44.3) |
34.2 |
(29.5–39.3) |
|
Dallas, TX |
20.2 |
(16.8–24.2) |
11.8 |
(9.0–15.2) |
16.0 |
(13.8–18.4) |
27.7 |
(22.9–33.0) |
46.6 |
(42.2–51.2) |
37.0 |
(33.6–40.6) |
|
Detroit, MI |
23.2 |
(20.3–26.3) |
18.2 |
(15.2–21.7) |
20.9 |
(18.8–23.2) |
23.7 |
(20.2–27.6) |
30.2 |
(26.2–34.5) |
26.7 |
(23.8–29.9) |
|
District of Columbia |
30.6 |
(26.4–35.3) |
22.8 |
(18.9–27.1) |
27.1 |
(24.1–30.3) |
24.2 |
(20.7–28.1) |
33.3 |
(28.3–38.6) |
28.4 |
(25.1–31.8) |
|
Duval County, FL |
27.9 |
(25.6–30.4) |
20.0 |
(17.7–22.5) |
23.9 |
(22.2–25.8) |
23.9 |
(21.8–26.2) |
38.0 |
(34.9–41.1) |
30.7 |
(28.7–32.8) |
|
Houston, TX |
25.7 |
(23.1–28.6) |
18.5 |
(15.6–21.8) |
22.1 |
(19.9–24.4) |
21.8 |
(18.9–25.0) |
38.6 |
(35.2–42.1) |
30.3 |
(27.8–32.9) |
|
Los Angeles, CA |
21.8 |
(17.1–27.4) |
13.9 |
(10.1–18.9) |
17.7 |
(14.2–21.9) |
31.4 |
(26.9–36.2) |
46.5 |
(42.7–50.4) |
39.2 |
(36.0–42.5) |
|
Memphis, TN |
26.1 |
(22.6–30.0) |
18.9 |
(16.1–22.2) |
22.5 |
(20.1–25.0) |
27.0 |
(23.5–30.8) |
47.7 |
(44.1–51.3) |
37.3 |
(34.7–39.9) |
|
Miami-Dade County, FL |
24.0 |
(20.9–27.5) |
13.2 |
(10.9–16.0) |
18.8 |
(16.5–21.4) |
27.0 |
(23.5–30.8) |
47.3 |
(43.2–51.5) |
37.0 |
(34.3–39.8) |
|
Milwaukee, WI |
28.3 |
(24.9–32.0) |
20.3 |
(17.0–24.1) |
24.4 |
(21.7–27.3) |
23.6 |
(20.5–27.0) |
37.7 |
(33.7–41.8) |
30.6 |
(27.8–33.4) |
|
New York City, NY |
20.1 |
(18.0–22.3) |
16.6 |
(15.3–18.0) |
18.4 |
(17.0–19.9) |
33.0 |
(30.8–35.3) |
45.8 |
(43.9–47.8) |
39.0 |
(37.4–40.6) |
|
Orange County, FL |
26.1 |
(22.3–30.3) |
13.8 |
(11.0–17.0) |
20.0 |
(17.3–22.9) |
29.1 |
(25.7–32.7) |
53.0 |
(49.3–56.6) |
40.9 |
(38.4–43.5) |
|
Palm Beach County, FL |
24.0 |
(21.2–27.0) |
14.7 |
(12.0–18.0) |
19.4 |
(17.5–21.4) |
27.6 |
(24.6–30.8) |
53.5 |
(49.7–57.2) |
40.6 |
(38.1–43.1) |
|
Philadelphia, PA |
24.1 |
(21.1–27.5) |
15.3 |
(12.8–18.2) |
20.0 |
(17.9–22.3) |
32.3 |
(28.6–36.3) |
42.9 |
(38.1–47.8) |
37.1 |
(33.9–40.5) |
|
San Bernardino, CA |
18.9 |
(16.1–22.0) |
12.3 |
(9.1–16.3) |
15.5 |
(13.1–18.1) |
34.8 |
(30.6–39.2) |
51.8 |
(47.0–56.6) |
43.4 |
(39.8–47.0) |
|
San Diego, CA |
21.3 |
(18.0–25.0) |
13.0 |
(10.9–15.3) |
17.0 |
(14.7–19.6) |
36.8 |
(30.9–43.1) |
54.3 |
(50.3–58.2) |
45.7 |
(41.4–50.1) |
|
San Francisco, CA |
27.6 |
(24.0–31.5) |
21.6 |
(18.1–25.5) |
24.6 |
(22.0–27.3) |
27.0 |
(23.1–31.3) |
38.6 |
(34.3–43.0) |
32.7 |
(29.3–36.2) |
|
Seattle, WA |
20.7 |
(17.6–24.2) |
14.6 |
(11.8–18.0) |
18.0 |
(15.9–20.2) |
34.0 |
(30.1–38.2) |
43.8 |
(39.5–48.2) |
38.8 |
(35.9–41.9) |
|
Median |
24.1 |
15.3 |
20.0 |
27.7 |
45.8 |
37.1 |
||||||
|
Range |
18.9–30.6 |
11.8–22.8 |
15.5–27.1 |
19.3–36.8 |
30.2–54.3 |
26.7–45.7 |
||||||
|
* Were physically active doing any kind of physical activity that increased their heart rate and made them breathe hard some of the time for a total of at least 60 minutes/day on 0 days during the 7 days before the survey. † During the 7 days before the survey. § Were physically active doing any kind of physical activity that increased their heart rate and made them breathe hard some of the time. ¶ 95% confidence interval. ** Not available. |
||||||||||||
|
TABLE 94. (Continued) Percentage of high school students who were physically active at least 60 minutes/day on all 7 days,* by sex — selected U.S. sites, Youth Risk Behavior Survey, 2011 |
||||||
|---|---|---|---|---|---|---|
|
Site |
Physically active at least 60 minutes/day on all 7 days |
|||||
|
Female |
Male |
Total |
||||
|
% |
CI† |
% |
CI |
% |
CI |
|
|
Large urban school district surveys |
||||||
|
Boston, MA |
9.4 |
(6.9–12.6) |
21.2 |
(17.3–25.7) |
15.2 |
(13.0–17.8) |
|
Broward County, FL |
14.2 |
(11.6–17.3) |
34.1 |
(30.9–37.4) |
24.1 |
(22.1–26.2) |
|
Charlotte-Mecklenburg, NC |
16.2 |
(14.0–18.7) |
30.9 |
(27.4–34.6) |
23.4 |
(21.1–25.8) |
|
Chicago, IL |
14.7 |
(11.4–18.8) |
22.4 |
(19.8–25.2) |
18.2 |
(15.8–20.8) |
|
Dallas, TX |
15.1 |
(11.9–19.0) |
24.3 |
(20.5–28.6) |
19.7 |
(17.3–22.4) |
|
Detroit, MI |
13.0 |
(10.6–15.8) |
17.4 |
(14.3–21.0) |
15.1 |
(12.9–17.7) |
|
District of Columbia |
13.0 |
(10.6–15.9) |
21.0 |
(17.4–25.2) |
16.8 |
(14.6–19.1) |
|
Duval County, FL |
12.7 |
(10.9–14.8) |
23.4 |
(20.8–26.3) |
17.9 |
(16.2–19.8) |
|
Houston, TX |
9.4 |
(7.6–11.6) |
21.8 |
(19.1–24.8) |
15.6 |
(13.7–17.8) |
|
Los Angeles, CA |
13.3 |
(11.0–16.0) |
26.0 |
(22.5–29.8) |
19.9 |
(17.8–22.1) |
|
Memphis, TN |
14.6 |
(12.3–17.4) |
34.3 |
(30.5–38.2) |
24.4 |
(21.9–27.0) |
|
Miami-Dade County, FL |
13.7 |
(11.7–16.2) |
30.2 |
(26.7–34.0) |
21.9 |
(19.9–24.0) |
|
Milwaukee, WI |
12.7 |
(10.5–15.4) |
22.9 |
(20.2–25.9) |
17.8 |
(16.1–19.6) |
|
New York City, NY |
15.0 |
(13.5–16.6) |
26.4 |
(24.5–28.3) |
20.3 |
(19.1–21.6) |
|
Orange County, FL |
14.8 |
(12.2–17.9) |
35.0 |
(31.0–39.2) |
24.9 |
(22.4–27.6) |
|
Palm Beach County, FL |
13.7 |
(11.7–16.1) |
33.7 |
(30.6–37.0) |
23.8 |
(21.7–26.1) |
|
Philadelphia, PA |
17.6 |
(14.3–21.4) |
25.5 |
(21.8–29.7) |
21.2 |
(18.6–24.1) |
|
San Bernardino, CA |
17.9 |
(14.7–21.7) |
33.7 |
(29.4–38.3) |
25.9 |
(23.0–29.0) |
|
San Diego, CA |
16.7 |
(13.2–21.0) |
32.5 |
(28.3–37.1) |
24.8 |
(21.5–28.4) |
|
San Francisco, CA |
9.4 |
(7.2–12.1) |
17.8 |
(15.2–20.7) |
13.4 |
(11.7–15.4) |
|
Seattle, WA |
13.3 |
(10.9–16.1) |
24.0 |
(20.7–27.6) |
18.6 |
(16.5–20.9) |
|
Median |
13.7 |
25.5 |
19.9 |
|||
|
Range |
9.4–17.9 |
17.4–35.0 |
13.4–25.9 |
|||
|
* Were physically active doing any kind of physical activity that increased their heart rate and made them breathe hard some of the time for a total of at least 60 minutes/day on 7 of the 7 days before the survey. † 95% confidence interval. § Not available. |
||||||
|
TABLE 96. (Continued) Percentage of high school students who played video or computer games or used a computer* for 3 or more hours/day† and who watched 3 or more hours/day of television,† by sex — selected U.S. sites, Youth Risk Behavior Survey, 2011 |
||||||||||||
|---|---|---|---|---|---|---|---|---|---|---|---|---|
|
Site |
Used computers 3 or more hours/day |
Watched television 3 or more hours/day |
||||||||||
|
Female |
Male |
Total |
Female |
Male |
Total |
|||||||
|
% |
CI§ |
% |
CI |
% |
CI |
% |
CI |
% |
CI |
% |
CI |
|
|
Large urban school district surveys |
||||||||||||
|
Boston, MA |
38.5 |
(33.3–44.0) |
37.6 |
(31.7–43.9) |
38.1 |
(33.3–43.2) |
42.2 |
(35.7–49.0) |
41.6 |
(36.2–47.2) |
42.0 |
(36.8–47.3) |
|
Broward County, FL |
36.3 |
(32.4–40.3) |
39.7 |
(36.3–43.2) |
38.2 |
(35.7–40.7) |
39.4 |
(35.5–43.4) |
41.8 |
(38.1–45.7) |
40.6 |
(37.8–43.5) |
|
Charlotte-Mecklenburg, NC |
32.0 |
(28.0–36.3) |
35.0 |
(31.3–38.9) |
33.5 |
(30.8–36.4) |
37.7 |
(33.8–41.7) |
35.6 |
(31.5–39.9) |
36.6 |
(33.7–39.6) |
|
Chicago, IL |
31.4 |
(28.1–34.8) |
35.9 |
(31.6–40.3) |
33.3 |
(30.8–35.9) |
41.5 |
(37.0–46.3) |
40.6 |
(35.8–45.5) |
40.8 |
(37.5–44.2) |
|
Dallas, TX |
33.4 |
(29.5–37.4) |
35.7 |
(30.7–41.0) |
34.5 |
(31.6–37.5) |
45.9 |
(41.6–50.3) |
39.9 |
(35.3–44.7) |
43.1 |
(40.3–45.9) |
|
Detroit, MI |
25.5 |
(22.3–29.0) |
32.3 |
(27.9–37.0) |
28.8 |
(25.7–32.0) |
39.8 |
(36.0–43.8) |
49.5 |
(44.6–54.4) |
44.4 |
(41.2–47.6) |
|
District of Columbia |
35.2 |
(31.0–39.7) |
36.5 |
(31.6–41.6) |
35.6 |
(32.0–39.4) |
40.5 |
(36.6–44.5) |
36.1 |
(31.5–41.0) |
38.3 |
(35.0–41.7) |
|
Duval County, FL |
30.8 |
(28.5–33.3) |
37.9 |
(35.2–40.8) |
34.3 |
(32.4–36.2) |
42.5 |
(39.2–45.8) |
39.9 |
(37.1–42.8) |
41.1 |
(38.8–43.5) |
|
Houston, TX |
33.5 |
(30.8–36.3) |
35.5 |
(32.3–38.8) |
34.5 |
(32.2–36.9) |
44.3 |
(40.1–48.6) |
37.4 |
(33.6–41.3) |
40.9 |
(37.9–43.9) |
|
Los Angeles, CA |
29.9 |
(24.5–35.8) |
35.6 |
(31.5–39.8) |
32.9 |
(29.1–36.9) |
38.0 |
(32.5–43.8) |
34.9 |
(30.7–39.4) |
36.4 |
(33.0–39.8) |
|
Memphis, TN |
38.4 |
(34.6–42.3) |
44.1 |
(40.0–48.3) |
41.2 |
(38.5–44.0) |
55.4 |
(50.9–59.9) |
57.5 |
(53.0–61.9) |
56.4 |
(53.0–59.8) |
|
Miami-Dade County, FL |
35.5 |
(32.4–38.7) |
39.6 |
(36.3–43.0) |
37.5 |
(35.3–39.8) |
37.7 |
(33.9–41.7) |
38.9 |
(35.4–42.6) |
38.4 |
(35.9–40.9) |
|
Milwaukee, WI |
27.4 |
(24.2–30.8) |
36.3 |
(32.6–40.3) |
32.1 |
(29.6–34.6) |
46.0 |
(42.2–49.8) |
40.0 |
(36.3–43.8) |
42.8 |
(40.0–45.6) |
|
New York City, NY |
43.8 |
(41.3–46.3) |
44.2 |
(42.2–46.1) |
43.9 |
(42.2–45.6) |
39.5 |
(35.4–43.7) |
36.4 |
(32.9–40.1) |
38.0 |
(34.5–41.6) |
|
Orange County, FL |
33.8 |
(30.1–37.7) |
39.5 |
(35.2–44.1) |
36.6 |
(33.6–39.6) |
31.0 |
(27.4–34.9) |
35.3 |
(31.3–39.6) |
33.0 |
(30.1–36.1) |
|
Palm Beach County, FL |
33.4 |
(30.2–36.8) |
38.0 |
(34.1–42.1) |
35.8 |
(33.0–38.7) |
36.3 |
(33.1–39.5) |
39.3 |
(35.8–43.0) |
37.9 |
(35.3–40.5) |
|
Philadelphia, PA |
35.9 |
(31.7–40.3) |
45.8 |
(41.5–50.2) |
40.4 |
(37.1–43.8) |
44.4 |
(40.1–48.8) |
47.4 |
(42.9–52.0) |
45.8 |
(42.7–48.9) |
|
San Bernardino, CA |
28.9 |
(25.4–32.7) |
40.1 |
(36.5–43.8) |
34.6 |
(32.0–37.2) |
44.5 |
(39.9–49.3) |
46.3 |
(41.9–50.8) |
45.4 |
(42.2–48.8) |
|
San Diego, CA |
28.7 |
(24.7–33.0) |
34.5 |
(30.5–38.8) |
31.7 |
(28.2–35.4) |
31.2 |
(27.0–35.7) |
34.8 |
(30.2–39.7) |
33.0 |
(29.4–36.8) |
|
San Francisco, CA |
41.5 |
(37.3–45.7) |
45.6 |
(42.1–49.1) |
43.5 |
(40.5–46.5) |
29.1 |
(26.3–32.1) |
23.8 |
(20.7–27.3) |
26.5 |
(24.3–28.9) |
|
Seattle, WA |
23.2 |
(20.4–26.4) |
32.8 |
(29.2–36.7) |
28.2 |
(25.7–30.8) |
21.0 |
(17.8–24.6) |
24.3 |
(20.3–28.8) |
22.7 |
(19.9–25.7) |
|
Median |
33.4 |
37.6 |
34.6 |
39.8 |
39.3 |
40.6 |
||||||
|
Range |
23.2–43.8 |
32.3–45.8 |
28.2–43.9 |
21.0–55.4 |
23.8–57.5 |
22.7–56.4 |
||||||
|
* For something that was not school work. † On an average school day. § 95% confidence interval. ¶ Not available. |
||||||||||||
|
TABLE 98. (Continued) Percentage of high school students who attended physical education (PE) classes, by sex — selected U.S. sites, Youth Risk Behavior Survey, 2011 |
||||||||||||
|---|---|---|---|---|---|---|---|---|---|---|---|---|
|
Site |
Attended PE classes* |
Attended PE classes daily† |
||||||||||
|
Female |
Male |
Total |
Female |
Male |
Total |
|||||||
|
% |
CI§ |
% |
CI |
% |
CI |
% |
CI |
% |
CI |
% |
CI |
|
|
Large urban school district surveys |
||||||||||||
|
Boston, MA |
29.3 |
(20.7–39.7) |
34.3 |
(25.2–44.6) |
31.7 |
(23.8–40.8) |
7.8 |
(4.9–12.4) |
10.3 |
(6.6–15.9) |
9.0 |
(6.3–12.9) |
|
Broward County, FL |
33.4 |
(28.5–38.8) |
46.1 |
(41.6–50.7) |
40.0 |
(36.0–44.1) |
15.8 |
(13.1–19.1) |
24.4 |
(21.3–27.8) |
20.4 |
(18.1–22.9) |
|
Charlotte-Mecklenburg, NC |
28.4 |
(22.7–35.0) |
42.8 |
(36.9–49.0) |
35.7 |
(30.9–40.9) |
15.2 |
(10.3–21.8) |
19.9 |
(14.9–26.1) |
17.5 |
(13.6–22.3) |
|
Chicago, IL |
59.8 |
(51.8–67.2) |
61.9 |
(55.5–67.9) |
60.5 |
(54.1–66.5) |
43.3 |
(33.0–54.2) |
41.9 |
(35.0–49.3) |
42.5 |
(34.4–51.1) |
|
Dallas, TX |
49.7 |
(42.8–56.7) |
53.5 |
(46.9–59.9) |
51.8 |
(46.0–57.5) |
11.8 |
(8.7–15.8) |
11.9 |
(9.0–15.8) |
11.9 |
(9.5–14.9) |
|
Detroit, MI |
52.8 |
(48.5–57.1) |
58.1 |
(53.4–62.7) |
55.5 |
(51.9–59.1) |
18.1 |
(15.0–21.7) |
19.2 |
(15.2–23.9) |
18.5 |
(15.5–22.0) |
|
District of Columbia |
32.9 |
(26.7–39.7) |
35.9 |
(30.2–41.9) |
34.2 |
(29.2–39.5) |
12.3 |
(9.4–15.8) |
11.6 |
(8.7–15.3) |
11.9 |
(9.6–14.7) |
|
Duval County, FL |
38.1 |
(33.9–42.6) |
51.4 |
(47.6–55.1) |
44.8 |
(41.2–48.3) |
6.5 |
(5.1–8.2) |
11.6 |
(9.7–13.8) |
9.0 |
(7.7–10.5) |
|
Houston, TX |
57.6 |
(52.0–63.0) |
60.4 |
(56.1–64.6) |
59.1 |
(54.8–63.2) |
23.4 |
(19.7–27.5) |
22.6 |
(19.1–26.6) |
23.0 |
(20.1–26.1) |
|
Los Angeles, CA |
63.6 |
(52.0–73.8) |
63.2 |
(51.6–73.5) |
63.4 |
(52.1–73.4) |
35.5 |
(26.5–45.7) |
32.5 |
(25.7–40.1) |
33.8 |
(26.3–42.3) |
|
Memphis, TN |
37.3 |
(31.7–43.2) |
56.9 |
(50.7–62.8) |
47.0 |
(41.8–52.4) |
22.8 |
(18.1–28.4) |
35.5 |
(30.4–41.0) |
29.1 |
(24.9–33.8) |
|
Miami-Dade County, FL |
37.8 |
(32.0–44.0) |
54.5 |
(49.2–59.7) |
46.0 |
(41.1–51.0) |
7.1 |
(4.7–10.6) |
12.4 |
(10.2–15.0) |
9.8 |
(7.8–12.2) |
|
Milwaukee, WI |
38.0 |
(34.0–42.2) |
44.5 |
(39.6–49.5) |
41.4 |
(37.4–45.4) |
22.9 |
(19.5–26.8) |
24.4 |
(20.8–28.4) |
23.6 |
(20.5–27.0) |
|
New York City, NY |
82.3 |
(77.1–86.5) |
76.3 |
(70.5–81.3) |
79.5 |
(74.3–83.8) |
42.7 |
(35.4–50.2) |
40.1 |
(33.6–46.9) |
41.3 |
(34.9–48.2) |
|
Orange County, FL |
36.2 |
(30.5–42.4) |
51.3 |
(45.4–57.3) |
43.8 |
(38.4–49.3) |
18.8 |
(15.0–23.2) |
31.5 |
(26.9–36.6) |
25.1 |
(21.6–29.1) |
|
Palm Beach County, FL |
37.2 |
(31.1–43.7) |
52.0 |
(46.3–57.7) |
44.7 |
(39.3–50.3) |
13.8 |
(10.1–18.4) |
23.4 |
(19.8–27.5) |
18.7 |
(15.5–22.3) |
|
Philadelphia, PA |
47.8 |
(42.0–53.6) |
50.7 |
(44.6–56.7) |
49.1 |
(44.0–54.3) |
31.8 |
(25.7–38.5) |
30.4 |
(23.8–37.9) |
31.0 |
(25.2–37.5) |
|
San Bernardino, CA |
58.3 |
(50.3–66.0) |
61.4 |
(52.3–69.8) |
59.9 |
(51.8–67.4) |
48.8 |
(41.1–56.4) |
52.2 |
(43.7–60.7) |
50.5 |
(43.0–58.0) |
|
San Diego, CA |
56.2 |
(46.8–65.1) |
60.2 |
(52.6–67.4) |
58.3 |
(50.2–65.9) |
39.1 |
(31.6–47.2) |
42.0 |
(36.0–48.2) |
40.5 |
(34.2–47.3) |
|
San Francisco, CA |
50.4 |
(41.9–58.8) |
53.3 |
(45.1–61.2) |
51.6 |
(44.0–59.2) |
22.8 |
(17.4–29.2) |
24.9 |
(19.5–31.2) |
23.7 |
(18.9–29.2) |
|
Seattle, WA |
30.0 |
(24.9–35.7) |
40.2 |
(34.0–46.6) |
35.2 |
(30.0–40.7) |
14.4 |
(11.1–18.6) |
20.6 |
(16.8–25.1) |
17.5 |
(14.4–21.1) |
|
Median |
38.1 |
53.3 |
47.0 |
18.8 |
24.4 |
23.0 |
||||||
|
Range |
28.4–82.3 |
34.3–76.3 |
31.7–79.5 |
6.5–48.8 |
10.3–52.2 |
9.0–50.5 |
||||||
|
* On 1 or more days in an average week when they were in school. † 5 days in an average week when they were in school. § 95% confidence interval. ¶ Not available. |
||||||||||||
|
TABLE 100. (Continued) Percentage of high school students who played on at least one sports team,* by sex — selected U.S. sites, Youth Risk Behavior Survey, 2011 |
||||||
|---|---|---|---|---|---|---|
|
Site |
Female |
Male |
Total |
|||
|
% |
CI† |
% |
CI |
% |
CI |
|
|
Large urban school district surveys |
||||||
|
Boston, MA |
36.8 |
(31.4–42.5) |
56.0 |
(50.9–61.0) |
46.2 |
(42.6–49.9) |
|
Broward County, FL |
42.6 |
(38.8–46.4) |
55.1 |
(51.3–58.8) |
48.7 |
(46.1–51.4) |
|
Charlotte-Mecklenburg, NC |
39.9 |
(35.4–44.5) |
59.1 |
(55.4–62.8) |
49.3 |
(46.0–52.7) |
|
Chicago, IL |
48.0 |
(42.0–54.0) |
61.1 |
(57.6–64.4) |
53.9 |
(49.9–57.8) |
|
Dallas, TX |
44.0 |
(38.8–49.3) |
52.0 |
(46.8–57.1) |
47.9 |
(44.4–51.4) |
|
Detroit, MI |
— |
— |
— |
— |
— |
— |
|
District of Columbia |
48.2 |
(42.7–53.8) |
58.6 |
(54.4–62.6) |
53.0 |
(49.1–56.9) |
|
Duval County, FL |
42.7 |
(39.9–45.4) |
52.6 |
(49.3–55.9) |
47.5 |
(45.4–49.7) |
|
Houston, TX |
39.4 |
(35.7–43.3) |
49.7 |
(45.5–53.9) |
44.6 |
(41.3–48.0) |
|
Los Angeles, CA |
41.8 |
(36.9–46.8) |
53.3 |
(48.5–58.1) |
47.7 |
(44.6–50.8) |
|
Memphis, TN |
44.4 |
(39.6–49.3) |
62.4 |
(58.3–66.3) |
53.3 |
(50.6–56.0) |
|
Miami-Dade County, FL |
38.0 |
(34.4–41.7) |
52.8 |
(48.8–56.8) |
45.2 |
(42.5–48.0) |
|
Milwaukee, WI |
— |
— |
— |
— |
— |
— |
|
New York City, NY |
36.6 |
(33.8–39.5) |
49.4 |
(46.9–51.9) |
42.8 |
(40.5–45.0) |
|
Orange County, FL |
46.0 |
(42.8–49.2) |
58.8 |
(54.2–63.2) |
52.4 |
(49.8–54.9) |
|
Palm Beach County, FL |
45.0 |
(42.3–47.8) |
57.2 |
(53.6–60.7) |
51.2 |
(48.8–53.5) |
|
Philadelphia, PA |
37.0 |
(33.2–41.0) |
56.3 |
(51.8–60.7) |
46.3 |
(43.2–49.5) |
|
San Bernardino, CA |
47.3 |
(42.6–52.0) |
59.0 |
(54.4–63.5) |
53.1 |
(49.5–56.7) |
|
San Diego, CA |
44.0 |
(38.0–50.0) |
56.6 |
(53.0–60.2) |
50.5 |
(46.5–54.5) |
|
San Francisco, CA |
— |
— |
— |
— |
— |
— |
|
Seattle, WA |
54.5 |
(50.6–58.4) |
59.8 |
(55.3–64.1) |
57.3 |
(54.7–59.8) |
|
Median |
43.3 |
56.4 |
49.0 |
|||
|
Range |
36.6–54.5 |
49.4–62.4 |
42.8–57.3 |
|||
|
* Run by their school or community groups during the 12 months before the survey. † 95% confidence interval. § Not available. |
||||||
|
TABLE 102. (Continued) Percentage of high school students who were obese* and who were overweight,† by sex — selected U.S. sites, Youth Risk Behavior Survey, 2011 |
||||||||||||
|---|---|---|---|---|---|---|---|---|---|---|---|---|
|
Site |
Obese |
Overweight |
||||||||||
|
Female |
Male |
Total |
Female |
Male |
Total |
|||||||
|
% |
CI§ |
% |
CI |
% |
CI |
% |
CI |
% |
CI |
% |
CI |
|
|
Large urban school district surveys |
||||||||||||
|
Boston, MA |
14.2 |
(11.0–18.3) |
14.4 |
(11.4–18.0) |
14.3 |
(11.9–17.1) |
17.0 |
(13.8–20.8) |
18.9 |
(14.8–23.9) |
18.0 |
(14.8–21.7) |
|
Broward County, FL |
6.7 |
(4.8–9.2) |
12.1 |
(10.0–14.6) |
9.5 |
(7.8–11.4) |
12.9 |
(10.6–15.7) |
14.5 |
(12.0–17.4) |
13.7 |
(11.9–15.7) |
|
Charlotte-Mecklenburg, NC |
11.9 |
(9.6–14.7) |
13.6 |
(11.0–16.8) |
12.8 |
(10.9–15.0) |
15.2 |
(12.9–17.9) |
14.6 |
(12.2–17.4) |
14.9 |
(13.2–16.8) |
|
Chicago, IL |
11.8 |
(9.8–14.1) |
19.5 |
(16.9–22.5) |
15.5 |
(13.8–17.4) |
21.9 |
(18.5–25.7) |
14.2 |
(11.6–17.3) |
18.2 |
(15.9–20.8) |
|
Dallas, TX |
13.0 |
(10.1–16.4) |
17.6 |
(14.4–21.4) |
15.3 |
(12.9–17.9) |
19.9 |
(15.9–24.5) |
21.0 |
(17.4–25.1) |
20.4 |
(17.6–23.5) |
|
Detroit, MI |
19.0 |
(16.6–21.7) |
18.7 |
(16.1–21.7) |
18.9 |
(17.0–20.9) |
24.8 |
(22.2–27.6) |
20.4 |
(17.3–23.8) |
22.7 |
(20.8–24.8) |
|
District of Columbia |
15.5 |
(12.9–18.7) |
13.4 |
(10.5–17.0) |
14.5 |
(12.4–17.0) |
19.5 |
(16.3–23.1) |
16.4 |
(13.7–19.6) |
18.0 |
(15.7–20.5) |
|
Duval County, FL |
9.1 |
(7.7–10.8) |
14.7 |
(12.7–16.9) |
11.9 |
(10.6–13.3) |
17.1 |
(15.2–19.2) |
13.5 |
(11.7–15.5) |
15.3 |
(14.0–16.7) |
|
Houston, TX |
11.4 |
(9.4–13.9) |
15.7 |
(13.5–18.2) |
13.6 |
(12.1–15.4) |
19.1 |
(16.4–22.2) |
16.6 |
(14.2–19.3) |
17.8 |
(16.1–19.7) |
|
Los Angeles, CA |
6.3 |
(5.0–7.9) |
19.8 |
(16.7–23.2) |
13.3 |
(11.4–15.3) |
18.0 |
(14.9–21.6) |
15.9 |
(13.0–19.2) |
16.9 |
(14.8–19.2) |
|
Memphis, TN |
18.4 |
(15.4–21.8) |
18.5 |
(15.5–21.9) |
18.4 |
(16.4–20.6) |
19.7 |
(17.0–22.8) |
13.7 |
(11.1–16.8) |
16.8 |
(14.8–19.0) |
|
Miami-Dade County, FL |
9.6 |
(7.8–11.8) |
16.0 |
(13.6–18.7) |
12.7 |
(11.2–14.4) |
15.2 |
(13.0–17.8) |
14.8 |
(12.5–17.5) |
15.0 |
(13.4–16.8) |
|
Milwaukee, WI |
15.0 |
(12.9–17.3) |
18.9 |
(16.7–21.4) |
17.0 |
(15.4–18.7) |
23.5 |
(20.1–27.3) |
13.4 |
(10.9–16.4) |
18.4 |
(16.3–20.7) |
|
New York City, NY |
9.1 |
(7.8–10.6) |
14.1 |
(12.7–15.6) |
11.6 |
(10.6–12.8) |
16.4 |
(15.1–17.9) |
14.6 |
(13.3–15.9) |
15.5 |
(14.5–16.5) |
|
Orange County, FL |
7.4 |
(5.4–10.2) |
12.6 |
(9.9–15.8) |
10.0 |
(8.2–12.1) |
11.7 |
(9.3–14.6) |
12.3 |
(10.3–14.7) |
12.0 |
(10.4–13.8) |
|
Palm Beach County, FL |
6.8 |
(5.3–8.6) |
11.8 |
(9.6–14.5) |
9.3 |
(8.0–10.9) |
13.0 |
(11.2–14.9) |
14.5 |
(12.3–17.1) |
13.8 |
(12.3–15.4) |
|
Philadelphia, PA |
15.0 |
(12.4–18.0) |
19.7 |
(16.3–23.7) |
17.3 |
(15.1–19.8) |
21.6 |
(19.0–24.4) |
13.8 |
(11.5–16.4) |
17.7 |
(15.9–19.6) |
|
San Bernardino, CA |
12.4 |
(10.0–15.3) |
18.0 |
(15.1–21.3) |
15.2 |
(13.2–17.4) |
19.2 |
(16.3–22.4) |
17.3 |
(14.5–20.4) |
18.2 |
(16.1–20.6) |
|
San Diego, CA |
6.9 |
(5.3–9.0) |
15.5 |
(12.9–18.6) |
11.4 |
(9.6–13.4) |
13.4 |
(10.9–16.4) |
18.5 |
(15.5–21.9) |
16.0 |
(13.8–18.6) |
|
San Francisco, CA |
6.1 |
(4.1–8.9) |
8.8 |
(6.9–11.2) |
7.4 |
(5.8–9.4) |
10.4 |
(8.2–13.1) |
12.7 |
(10.4–15.5) |
11.6 |
(9.9–13.5) |
|
Seattle, WA |
6.2 |
(4.6–8.3) |
9.5 |
(7.5–11.9) |
7.9 |
(6.6–9.5) |
13.2 |
(10.7–16.1) |
13.6 |
(11.3–16.1) |
13.4 |
(11.8–15.1) |
|
Median |
11.4 |
15.5 |
13.3 |
17.1 |
14.6 |
16.8 |
||||||
|
Range |
6.1–19.0 |
8.8–19.8 |
7.4–18.9 |
10.4–24.8 |
12.3–21.0 |
11.6–22.7 |
||||||
|
* Students who were ≥95th percentile for body mass index, based on sex- and age-specific reference data from the 2000 CDC growth charts. † Students who were ≥85th percentile but <95th percentile for body mass index, based on sex- and age-specific reference data from the 2000 CDC growth charts. § 95% confidence interval. |
||||||||||||
|
TABLE 104. (Continued) Percentage of high school students who described themselves as slightly or very overweight and who were trying to lose weight, by sex — selected U.S. sites, Youth Risk Behavior Survey, 2011 |
||||||||||||
|---|---|---|---|---|---|---|---|---|---|---|---|---|
|
Site |
Described themselves as overweight |
Were trying to lose weight |
||||||||||
|
Female |
Male |
Total |
Female |
Male |
Total |
|||||||
|
% |
CI* |
% |
CI |
% |
CI |
% |
CI |
% |
CI |
% |
CI |
|
|
Large urban school district surveys |
||||||||||||
|
Boston, MA |
31.3 |
(27.1–35.8) |
24.8 |
(19.9–30.4) |
28.0 |
(25.1–31.1) |
57.7 |
(53.1–62.2) |
32.8 |
(27.7–38.3) |
45.2 |
(41.3–49.2) |
|
Broward County, FL |
29.9 |
(26.2–33.9) |
22.3 |
(19.7–25.1) |
26.0 |
(23.8–28.3) |
53.6 |
(50.2–56.9) |
27.6 |
(24.6–30.8) |
40.4 |
(38.0–43.0) |
|
Charlotte-Mecklenburg, NC |
31.4 |
(28.5–34.5) |
20.5 |
(17.0–24.4) |
25.9 |
(23.3–28.8) |
56.2 |
(51.7–60.6) |
28.6 |
(24.6–33.0) |
42.4 |
(39.0–45.9) |
|
Chicago, IL |
27.7 |
(24.4–31.4) |
23.4 |
(20.6–26.5) |
25.7 |
(23.3–28.2) |
53.1 |
(49.3–56.8) |
37.8 |
(34.1–41.7) |
45.9 |
(43.6–48.1) |
|
Dallas, TX |
36.3 |
(33.0–39.8) |
30.9 |
(26.1–36.3) |
33.8 |
(30.6–37.1) |
60.2 |
(55.8–64.5) |
37.0 |
(31.7–42.6) |
48.9 |
(45.6–52.1) |
|
Detroit, MI |
24.0 |
(21.1–27.1) |
13.5 |
(10.9–16.6) |
19.0 |
(17.0–21.3) |
41.6 |
(37.7–45.7) |
24.9 |
(21.0–29.3) |
33.7 |
(30.7–36.8) |
|
District of Columbia |
30.1 |
(25.8–34.8) |
16.7 |
(13.7–20.3) |
23.6 |
(20.6–26.8) |
49.6 |
(45.6–53.6) |
28.5 |
(23.7–33.7) |
39.6 |
(36.5–42.8) |
|
Duval County, FL |
28.6 |
(26.2–31.2) |
20.0 |
(17.7–22.5) |
24.4 |
(22.7–26.2) |
51.6 |
(49.0–54.3) |
28.1 |
(25.5–30.9) |
40.0 |
(37.8–42.2) |
|
Houston, TX |
32.4 |
(29.4–35.4) |
23.4 |
(20.8–26.3) |
27.9 |
(25.8–30.1) |
57.5 |
(54.1–60.8) |
38.8 |
(35.8–42.0) |
48.1 |
(45.9–50.3) |
|
Los Angeles, CA |
33.8 |
(31.1–36.7) |
28.3 |
(24.6–32.5) |
31.1 |
(29.6–32.6) |
61.3 |
(56.9–65.5) |
40.4 |
(37.1–43.9) |
50.4 |
(47.7–53.1) |
|
Memphis, TN |
33.7 |
(29.9–37.8) |
16.7 |
(14.3–19.3) |
25.4 |
(22.8–28.1) |
54.5 |
(50.3–58.7) |
27.5 |
(24.4–30.8) |
41.2 |
(38.7–43.8) |
|
Miami-Dade County, FL |
33.2 |
(30.0–36.5) |
20.5 |
(18.1–23.2) |
26.9 |
(24.7–29.3) |
56.8 |
(53.2–60.4) |
34.2 |
(31.2–37.4) |
45.5 |
(43.0–48.1) |
|
Milwaukee, WI |
— |
— |
— |
— |
— |
— |
52.3 |
(48.4–56.3) |
34.6 |
(31.4–38.0) |
43.5 |
(40.6–46.4) |
|
New York City, NY |
31.7 |
(29.7–33.8) |
24.2 |
(22.4–26.1) |
28.1 |
(26.5–29.8) |
53.6 |
(51.5–55.7) |
35.9 |
(33.3–38.5) |
45.0 |
(43.2–46.9) |
|
Orange County, FL |
29.0 |
(25.0–33.3) |
18.1 |
(14.9–21.9) |
23.5 |
(20.7–26.6) |
52.4 |
(47.7–57.0) |
24.6 |
(21.0–28.6) |
38.4 |
(35.4–41.5) |
|
Palm Beach County, FL |
28.2 |
(25.3–31.3) |
20.5 |
(17.8–23.4) |
24.4 |
(22.4–26.5) |
54.0 |
(51.0–57.0) |
25.6 |
(22.4–29.1) |
39.7 |
(37.5–42.0) |
|
Philadelphia, PA |
31.2 |
(27.7–34.9) |
20.8 |
(17.8–24.1) |
26.0 |
(23.7–28.4) |
54.0 |
(50.8–57.2) |
29.7 |
(26.3–33.3) |
42.2 |
(39.6–44.8) |
|
San Bernardino, CA |
32.5 |
(28.6–36.6) |
24.2 |
(21.2–27.5) |
28.4 |
(25.8–31.1) |
64.6 |
(60.3–68.7) |
39.9 |
(35.7–44.2) |
52.1 |
(48.5–55.7) |
|
San Diego, CA |
29.2 |
(26.1–32.5) |
26.8 |
(23.6–30.2) |
27.9 |
(25.6–30.3) |
59.7 |
(55.9–63.5) |
37.2 |
(33.8–40.8) |
48.3 |
(45.5–51.1) |
|
San Francisco, CA |
34.4 |
(31.6–37.3) |
25.9 |
(23.3–28.7) |
30.2 |
(28.4–32.1) |
54.2 |
(50.4–57.9) |
33.1 |
(30.3–36.0) |
43.5 |
(41.1–45.9) |
|
Seattle, WA |
26.8 |
(23.3–30.6) |
17.7 |
(15.3–20.4) |
22.0 |
(19.8–24.4) |
47.7 |
(43.8–51.6) |
26.9 |
(23.9–30.1) |
37.1 |
(34.5–39.7) |
|
Median |
31.2 |
21.5 |
26.0 |
54.0 |
32.8 |
43.5 |
||||||
|
Range |
24.0–36.3 |
13.5–30.9 |
19.0–33.8 |
41.6–64.6 |
24.6–40.4 |
33.7–52.1 |
||||||
|
* 95% confidence interval. † Not available. |
||||||||||||
|
TABLE 106. (Continued) Percentage of high school students who did not eat for 24 or more hours* and who took diet pills, powders, or liquids*,† by sex — selected U.S. sites, Youth Risk Behavior Survey, 2011 |
||||||||||||
|---|---|---|---|---|---|---|---|---|---|---|---|---|
|
Site |
Did not eat for 24 or more hours to lose weight or to keep from gaining weight |
Took diet pills, powders, or liquids to lose weight or to keep from gaining weight |
||||||||||
|
Female |
Male |
Total |
Female |
Male |
Total |
|||||||
|
% |
CI§ |
% |
CI |
% |
CI |
% |
CI |
% |
CI |
% |
CI |
|
|
Large urban school district surveys |
||||||||||||
|
Boston, MA |
15.0 |
(11.9–18.8) |
8.4 |
(5.4–12.7) |
11.7 |
(9.5–14.4) |
6.5 |
(4.4–9.4) |
2.8 |
(1.5–5.0) |
4.6 |
(3.4–6.3) |
|
Broward County, FL |
14.5 |
(12.2–17.2) |
7.9 |
(6.3–9.8) |
11.3 |
(9.9–12.7) |
6.8 |
(5.1–9.0) |
5.0 |
(3.7–6.7) |
5.9 |
(4.8–7.2) |
|
Charlotte-Mecklenburg, NC |
13.8 |
(11.3–16.9) |
6.5 |
(4.6–9.1) |
10.3 |
(8.6–12.3) |
6.1 |
(4.7–8.0) |
6.2 |
(4.3–9.0) |
6.3 |
(4.9–8.2) |
|
Chicago, IL |
20.6 |
(17.9–23.5) |
13.8 |
(11.4–16.5) |
17.5 |
(15.7–19.4) |
7.8 |
(5.8–10.4) |
7.8 |
(6.0–10.3) |
7.9 |
(6.3–9.8) |
|
Dallas, TX |
13.5 |
(10.7–16.9) |
9.0 |
(6.5–12.2) |
11.4 |
(9.6–13.5) |
7.2 |
(5.2–10.0) |
3.8 |
(2.5–5.8) |
5.6 |
(4.3–7.2) |
|
Detroit, MI |
18.1 |
(15.9–20.6) |
14.1 |
(11.4–17.3) |
16.6 |
(14.8–18.6) |
4.0 |
(2.9–5.5) |
6.6 |
(4.9–8.9) |
5.3 |
(4.3–6.6) |
|
District of Columbia |
14.9 |
(12.2–18.1) |
14.4 |
(11.3–18.2) |
14.7 |
(12.5–17.3) |
3.8 |
(2.2–6.4) |
6.5 |
(4.3–9.8) |
5.0 |
(3.5–7.2) |
|
Duval County, FL |
15.0 |
(13.2–17.0) |
9.5 |
(7.8–11.6) |
12.5 |
(11.1–14.0) |
6.5 |
(5.3–7.9) |
6.9 |
(5.5–8.7) |
6.8 |
(5.7–7.9) |
|
Houston, TX |
17.4 |
(14.6–20.6) |
13.0 |
(10.7–15.7) |
15.2 |
(13.3–17.3) |
6.0 |
(4.6–7.9) |
8.1 |
(6.5–10.1) |
7.2 |
(6.0–8.5) |
|
Los Angeles, CA |
12.4 |
(8.9–17.0) |
7.7 |
(5.8–10.2) |
10.0 |
(7.7–13.0) |
6.1 |
(4.1–8.9) |
6.2 |
(4.9–7.9) |
6.3 |
(5.0–8.0) |
|
Memphis, TN |
17.7 |
(14.8–21.0) |
9.1 |
(7.1–11.5) |
13.4 |
(11.6–15.5) |
4.3 |
(2.9–6.2) |
2.4 |
(1.4–4.0) |
3.4 |
(2.6–4.5) |
|
Miami-Dade County, FL |
16.0 |
(13.8–18.4) |
10.3 |
(8.6–12.4) |
13.2 |
(11.8–14.8) |
6.9 |
(5.6–8.5) |
4.8 |
(3.7–6.3) |
5.8 |
(4.9–7.0) |
|
Milwaukee, WI |
— |
— |
— |
— |
— |
— |
— |
— |
— |
— |
— |
— |
|
New York City, NY |
— |
— |
— |
— |
— |
— |
— |
— |
— |
— |
— |
— |
|
Orange County, FL |
18.6 |
(15.4–22.2) |
8.0 |
(5.7–11.1) |
13.2 |
(11.3–15.5) |
5.8 |
(4.3–7.9) |
2.9 |
(1.7–4.8) |
4.3 |
(3.2–5.7) |
|
Palm Beach County, FL |
14.9 |
(12.6–17.4) |
7.8 |
(6.0–10.1) |
11.4 |
(9.9–13.1) |
6.7 |
(5.1–8.9) |
5.1 |
(3.8–6.6) |
6.0 |
(4.9–7.3) |
|
Philadelphia, PA |
17.0 |
(13.7–20.9) |
11.6 |
(8.7–15.3) |
14.5 |
(12.2–17.1) |
6.9 |
(5.3–9.0) |
4.1 |
(2.7–6.2) |
5.7 |
(4.5–7.1) |
|
San Bernardino, CA |
18.4 |
(15.4–21.8) |
10.9 |
(8.4–13.9) |
14.5 |
(12.7–16.7) |
7.1 |
(5.5–9.2) |
5.0 |
(3.6–7.1) |
6.0 |
(4.9–7.4) |
|
San Diego, CA |
13.3 |
(10.6–16.7) |
7.6 |
(5.7–10.2) |
10.5 |
(8.8–12.5) |
6.8 |
(5.2–8.7) |
4.6 |
(2.9–7.3) |
5.6 |
(4.4–7.2) |
|
San Francisco, CA |
— |
— |
— |
— |
— |
— |
4.1 |
(2.8–5.9) |
6.2 |
(4.7–8.2) |
5.3 |
(4.1–6.7) |
|
Seattle, WA |
9.4 |
(7.6–11.7) |
8.0 |
(6.1–10.5) |
9.0 |
(7.5–10.8) |
4.4 |
(3.2–6.2) |
5.0 |
(3.5–7.0) |
5.1 |
(4.1–6.3) |
|
Median |
15.0 |
9.0 |
12.8 |
6.5 |
5.0 |
5.7 |
||||||
|
Range |
9.4–20.6 |
6.5–14.4 |
9.0–17.5 |
3.8–7.8 |
2.4–8.1 |
3.4–7.9 |
||||||
|
* To lose weight or to keep from gaining weight during the 30 days before the survey. † Without a doctor's advice. § 95% confidence interval. ¶ Not available. |
||||||||||||
|
TABLE 108. (Continued) Percentage of high school students who vomited or took laxatives to lose weight or to keep from gaining weight,* by sex — selected U.S. sites, Youth Risk Behavior Survey, 2011 |
||||||
|---|---|---|---|---|---|---|
|
Site |
Female |
Male |
Total |
|||
|
% |
CI† |
% |
CI |
% |
CI |
|
|
Large urban school district surveys |
||||||
|
Boston, MA |
4.0 |
(2.4–6.6) |
2.5 |
(1.3–4.7) |
3.3 |
(2.1–5.1) |
|
Broward County, FL |
5.4 |
(4.0–7.2) |
3.5 |
(2.3–5.2) |
4.6 |
(3.7–5.8) |
|
Charlotte-Mecklenburg, NC |
5.7 |
(4.0–8.0) |
5.5 |
(3.6–8.3) |
5.8 |
(4.2–8.0) |
|
Chicago, IL |
5.8 |
(4.1–8.1) |
7.2 |
(5.3–9.9) |
6.5 |
(5.1–8.1) |
|
Dallas, TX |
4.6 |
(3.3–6.4) |
3.9 |
(2.5–6.0) |
4.3 |
(3.2–5.7) |
|
Detroit, MI |
4.4 |
(3.3–5.9) |
6.1 |
(4.2–8.7) |
5.5 |
(4.3–6.9) |
|
District of Columbia |
5.6 |
(4.0–7.9) |
5.1 |
(3.2–8.2) |
5.7 |
(4.0–8.0) |
|
Duval County, FL |
6.2 |
(5.0–7.6) |
6.4 |
(4.9–8.4) |
6.5 |
(5.4–7.7) |
|
Houston, TX |
7.0 |
(5.5–8.9) |
5.4 |
(4.1–7.0) |
6.2 |
(5.1–7.5) |
|
Los Angeles, CA |
6.4 |
(4.4–9.3) |
5.2 |
(3.3–7.9) |
5.8 |
(4.4–7.6) |
|
Memphis, TN |
3.7 |
(2.5–5.5) |
2.2 |
(1.2–4.1) |
3.0 |
(2.1–4.3) |
|
Miami-Dade County, FL |
6.1 |
(4.9–7.5) |
4.2 |
(2.9–6.0) |
5.2 |
(4.2–6.3) |
|
Milwaukee, WI |
— |
— |
— |
— |
— |
— |
|
New York City, NY |
5.3 |
(4.4–6.4) |
4.5 |
(3.8–5.5) |
5.0 |
(4.4–5.7) |
|
Orange County, FL |
6.6 |
(4.9–8.8) |
3.1 |
(1.9–5.0) |
4.8 |
(3.8–6.2) |
|
Palm Beach County, FL |
6.0 |
(4.9–7.3) |
4.2 |
(3.0–5.9) |
5.1 |
(4.2–6.2) |
|
Philadelphia, PA |
6.1 |
(4.6–8.1) |
3.6 |
(2.1–6.0) |
4.9 |
(3.8–6.4) |
|
San Bernardino, CA |
5.1 |
(3.5–7.4) |
2.3 |
(1.3–3.9) |
3.7 |
(2.7–4.9) |
|
San Diego, CA |
5.7 |
(4.1–8.1) |
3.9 |
(2.8–5.4) |
4.8 |
(3.7–6.1) |
|
San Francisco, CA |
4.5 |
(3.3–6.2) |
5.4 |
(4.1–7.2) |
5.2 |
(4.2–6.4) |
|
Seattle, WA |
4.7 |
(3.3–6.6) |
4.4 |
(3.0–6.3) |
4.7 |
(3.6–6.1) |
|
Median |
5.6 |
4.3 |
5.0 |
|||
|
Range |
3.7–7.0 |
2.2–7.2 |
3.0–6.5 |
|||
|
* During the 30 days before the survey. † 95% confidence interval. § Not available. |
||||||
|
TABLE 110. (Continued) Percentage of high school students who had asthma, by sex — selected U.S. sites, Youth Risk Behavior Survey, 2011 |
||||||||||||
|---|---|---|---|---|---|---|---|---|---|---|---|---|
|
Site |
Ever had asthma* |
Current asthma† |
||||||||||
|
Female |
Male |
Total |
Female |
Male |
Total |
|||||||
|
% |
CI§ |
% |
CI |
% |
CI |
% |
CI |
% |
CI |
% |
CI |
|
|
Large urban school district surveys |
||||||||||||
|
Boston, MA |
28.2 |
(24.1–32.6) |
28.7 |
(23.9–34.0) |
28.3 |
(25.2–31.7) |
17.2 |
(13.4–21.8) |
13.4 |
(10.1–17.6) |
15.4 |
(12.6–18.6) |
|
Broward County, FL |
18.6 |
(15.4–22.3) |
20.2 |
(17.8–22.8) |
19.3 |
(17.4–21.3) |
8.1 |
(6.1–10.6) |
8.5 |
(6.7–10.7) |
8.3 |
(7.0–9.8) |
|
Charlotte-Mecklenburg, NC |
23.6 |
(19.8–27.9) |
25.3 |
(21.5–29.6) |
24.4 |
(21.5–27.5) |
11.9 |
(9.0–15.6) |
10.8 |
(8.6–13.4) |
11.3 |
(9.4–13.6) |
|
Chicago, IL |
21.1 |
(17.8–24.9) |
22.2 |
(19.4–25.4) |
21.6 |
(19.7–23.7) |
11.3 |
(8.5–14.9) |
7.3 |
(5.8–9.1) |
9.4 |
(7.6–11.6) |
|
Dallas, TX |
17.8 |
(14.3–21.8) |
20.5 |
(17.4–24.0) |
19.0 |
(16.7–21.6) |
7.4 |
(5.4–10.1) |
7.0 |
(5.3–9.1) |
7.2 |
(5.7–9.0) |
|
Detroit, MI |
22.6 |
(19.8–25.8) |
23.3 |
(19.8–27.2) |
22.9 |
(20.8–25.1) |
13.0 |
(11.0–15.4) |
9.5 |
(7.4–12.1) |
11.5 |
(10.0–13.1) |
|
District of Columbia |
26.1 |
(23.1–29.3) |
33.1 |
(28.6–37.9) |
29.5 |
(26.7–32.4) |
— |
— |
— |
— |
— |
— |
|
Duval County, FL |
20.8 |
(18.8–22.9) |
27.5 |
(25.0–30.2) |
24.1 |
(22.4–25.9) |
9.7 |
(8.2–11.4) |
10.5 |
(8.7–12.5) |
10.1 |
(8.9–11.4) |
|
Houston, TX |
16.8 |
(14.2–19.7) |
21.9 |
(18.9–25.4) |
19.3 |
(17.1–21.7) |
6.7 |
(4.9–9.1) |
6.1 |
(4.6–8.0) |
6.4 |
(5.2–7.8) |
|
Los Angeles, CA |
14.3 |
(12.2–16.6) |
18.0 |
(15.3–21.0) |
16.4 |
(14.7–18.3) |
6.8 |
(5.3–8.7) |
6.0 |
(4.3–8.4) |
6.5 |
(5.3–8.1) |
|
Memphis, TN |
19.8 |
(16.9–23.1) |
22.2 |
(19.2–25.6) |
20.9 |
(18.7–23.4) |
14.1 |
(11.8–16.6) |
12.0 |
(9.5–15.1) |
13.0 |
(11.2–15.1) |
|
Miami-Dade County, FL |
19.5 |
(16.8–22.5) |
21.7 |
(18.9–24.7) |
20.6 |
(18.4–22.9) |
8.5 |
(6.9–10.6) |
8.1 |
(6.1–10.7) |
8.3 |
(6.8–10.0) |
|
Milwaukee, WI |
25.5 |
(22.3–28.9) |
29.1 |
(25.9–32.5) |
27.3 |
(25.2–29.5) |
— |
— |
— |
— |
— |
— |
|
New York City, NY |
20.9 |
(19.4–22.5) |
25.3 |
(23.4–27.3) |
23.0 |
(21.7–24.3) |
— |
— |
— |
— |
— |
— |
|
Orange County, FL |
20.5 |
(17.7–23.7) |
20.9 |
(17.7–24.4) |
20.7 |
(18.5–23.0) |
9.1 |
(7.2–11.5) |
8.1 |
(6.3–10.4) |
8.7 |
(7.3–10.3) |
|
Palm Beach County, FL |
18.4 |
(16.2–20.8) |
20.5 |
(17.9–23.4) |
19.4 |
(17.6–21.4) |
9.5 |
(7.7–11.5) |
8.2 |
(6.6–10.1) |
8.8 |
(7.6–10.3) |
|
Philadelphia, PA |
28.4 |
(25.0–32.1) |
29.3 |
(25.3–33.6) |
29.1 |
(26.1–32.2) |
16.5 |
(13.5–19.9) |
16.1 |
(13.5–19.1) |
16.3 |
(14.2–18.7) |
|
San Bernardino, CA |
19.7 |
(16.9–22.8) |
19.0 |
(15.9–22.5) |
19.4 |
(17.3–21.7) |
11.2 |
(9.0–13.7) |
8.5 |
(6.0–12.1) |
9.9 |
(8.2–12.0) |
|
San Diego, CA |
22.7 |
(20.1–25.5) |
20.9 |
(17.7–24.4) |
21.8 |
(19.7–24.1) |
8.9 |
(6.5–12.0) |
7.9 |
(6.1–10.2) |
8.4 |
(7.0–10.0) |
|
San Francisco, CA |
17.1 |
(14.4–20.1) |
22.7 |
(19.9–25.8) |
20.3 |
(18.0–22.7) |
6.5 |
(4.7–8.9) |
7.9 |
(6.2–10.1) |
7.4 |
(6.1–9.0) |
|
Seattle, WA |
21.4 |
(18.6–24.5) |
21.6 |
(18.9–24.7) |
21.5 |
(19.4–23.7) |
10.3 |
(8.3–12.8) |
9.0 |
(6.8–11.8) |
9.6 |
(8.0–11.5) |
|
Median |
20.8 |
22.2 |
21.5 |
9.6 |
8.3 |
9.1 |
||||||
|
Range |
14.3–28.4 |
18.0–33.1 |
16.4–29.5 |
6.5–17.2 |
6.0–16.1 |
6.4–16.3 |
||||||
|
* Ever told by a doctor or nurse that they had asthma. † Ever told by a doctor or nurse that they had asthma and still have asthma. § 95% confidence interval. ¶ Not available. |
||||||||||||
|
TABLE 113. (Continued) National health objectives and leading health indicators from Healthy People 2020 (HP2020),* measured by the National Youth Risk Behavior Survey (YRBS), 2011 |
|---|
|
* Source: Adapted from US Department of Health and Human Services. Healthy People 2020. Available: http://www.healthypeople.gov/2020/default.aspx. Accessed November 23, 2011. † One or more times during the 12 months before the survey. § During the 12 months before the survey. ¶ On at least 1 day during the 30 days before the survey. ** During the 30 days before the survey. †† On each of the 7 days before the survey. §§ During the 7 days before the survey. ¶¶ On an average school day. *** The target setting method for this objective was a 10% improvement from the baseline; the baseline data source was the 2009 national YRBS. However, because of changes in question context starting in 2011, national YRBS prevalence estimates derived from the 60 minutes of physical activity question in 2011 are not comparable to those reported in 2009 or earlier. On the 2005–2009 national YRBS questionnaire, physical activity was assessed with three questions (in the following order) that asked the number of days students participated in: 1) at least 20 minutes of vigorous physical activity, 2) at least 30 minutes of moderate physical activity, and 3) at least 60 minutes of aerobic (moderate and vigorous) physical activity. On the 2011 national YRBS questionnaire, only the 60 minutes of aerobic physical activity question was included. ††† On an average school night. §§§ One or more times during the 30 days before the survey. ¶¶¶ Leading Health Indicator. |
Use of trade names and commercial sources is for identification only and does not imply endorsement by the U.S. Department of Health and Human Services. |
All MMWR HTML versions of articles are electronic conversions from typeset documents. This conversion might result in character translation or format errors in the HTML version. Users are referred to the electronic PDF version (http://www.cdc.gov/mmwr) and/or the original MMWR paper copy for printable versions of official text, figures, and tables. An original paper copy of this issue can be obtained from the Superintendent of Documents, U.S. Government Printing Office (GPO), Washington, DC 20402-9371; telephone: (202) 512-1800. Contact GPO for current prices.
**Questions or messages regarding errors in formatting should be addressed to mmwrq@cdc.gov.
